
 ?Mathematical formulae have been encoded as MathML and are displayed in this HTML version using MathJax in order to improve their display. Uncheck the box to turn MathJax off. This feature requires Javascript. Click on a formula to zoom.
ABSTRACT
The properties of natural fibers such as poor ultraviolet (UV) resistance and hydrophilicity that reduce the durability of composites limit their usage as reinforcements in polymer matrix composites. To compensate this, new types of composites are proposed in the present study. The tribological behaviors of multiphase composites with polyaspartic polyurea matrix produced by vacuum assisted resin transfer molding (VARTM) technique with jute reinforced, filled by graphene nanoplatelets (GNPs) and titanium dioxide (TiO2) nano-fillers at high temperatures are investigated. The wear tests were performed under 10, 20, and 30 N loads, at 60% humidity and temperatures of 100°C, 125°C, and 150°C using a heat moduled pin-on-disc tribotester with an AISI 4140 counter-surface disc having an average surface roughness value of 1.033 µm. The tests were carried out under dry friction conditions along 6000 m sliding distance at a sliding speed of 2 m/s. The results show that the wear damage types changed according to the nano-filler type. Wear loss and specific wear rate increased with increasing temperature and load in almost all types of composites. Using nano-filler caused irregularities in the change of the friction coefficient.
摘要
天然纤维的特性,如抗紫外线(UV)能力差和亲水性降低了复合材料的耐久性,限制了它们在聚合物基复合材料中作为增强材料的使用. 为了弥补这一点,本研究提出了新型复合材料. 研究了真空辅助树脂转移模塑(VARTM)技术制备的具有聚天冬氨酸聚脲基体的多相复合材料在高温下的摩擦学行为. 磨损试验在10、20和30 N载荷下,在60%湿度和100、125和150°C的温度下进行,使用具有AISI 4140反表面圆盘的热模制销盘摩擦试验机,平均表面粗糙度值为1.033 µm. 试验在干摩擦条件下以2 m/s的滑动速度沿6000 m的滑动距离进行. 结果表明,磨损损伤类型随纳米填料类型的变化而变化. 在几乎所有类型的复合材料中,磨损损失和比磨损率都随着温度和载荷的增加而增加. 使用纳米填料会导致摩擦系数变化的不规则性.
Introduction
Today, polymer matrix composites have become indispensable elements of the manufacturing industry. Especially, due to the widespread use of fiber-reinforced polymer matrix composites (FRPCs), which can be produced in large masses, the environmental problems that composites will create after the end of their life cycle have become an issue that needs to be considered. The pandemic period announced in 2020, which we are still in, has once again demonstrated the importance of the concept of “sustainability” in production. Two options come to the fore for sustainability in FRPCs:
Materials can be partially recycled by methods such as mechanical recovery, pyrolysis, solvolysis, cement kiln. However, these methods often concentrate on recycling carbon fiber, which is commercially more valuable, and at the end of these processes the fibers become substantially weaker than they originally used to be (Job et al. Citation2016). Good fiber matrix interface adhesion is desired for high mechanical and tribological properties in FRPCs. However, this situation causes problems by making it difficult to separate the fiber and matrix in the recycling of composites that have completed their life.
Another method is to select fiber and matrix materials as biodegradable as possible. Thus, it can be ensured that composites which complete their material life are added to the natural cycle. However, the biodegradability of the matrix causes the composite to become less resistant to external conditions. Therefore, it has become interesting to work using biodegradable fibers and matrix materials suitable for them instead of a biodegradable matrix. It was reported that the market volume of the natural fiber reinforced composite industry worldwide reached US $ 2.1 billion in 2010 (Mohammed et al. Citation2015). In the Natural Fiber Composites Industry Report, it was evaluated that this value has reached US $ 4.46 billion in 2016; until 2024, it is predicted to be US $ 10.89 billion with a compound annual growth rate (CAGR) of 11.8% (Li et al. Citation2020).
The unique properties of natural fibers and their composites such as low cost, low density, low abrasiveness, biodegradability, easy achievability, high thermal and sound insulation capacity, high environmental performance and high specific properties made them competitive with other fiber reinforcements such as glass fiber. (Ashik, Sharma, and Raghavendra Citation2017; Gu et al. Citation2014; Jawaid et al. Citation2013; Joshi et al. Citation2004; Pinto et al. Citation2013; Saheb and Jog Citation1999). But for serious competition with synthetic fibers, the obvious weaknesses of natural fibers must be overcome.
Natural fibers typically lose their strength substantially at 160°C (Joseph et al. Citation2003). This renders natural fibers incompatible with high curing temperature thermosets and limits their use to relatively low temperature applications (Sgriccia, Hawley, and Misra Citation2008). Since natural fibers are generally hydrophilic, their ability to bind to hydrophobic matrices is relatively poor (Pandita et al. Citation2014; Sgriccia, Hawley, and Misra Citation2008; Vigneshwaran et al. Citation2020). In addition, low maximum tensile strength and elongation values, high variability of the mechanical properties they offer, causing air bubbles in the product and low resistance to outdoor conditions are some of the important weaknesses of natural fibers (Sgriccia, Hawley, and Misra Citation2008). In the production of natural fiber reinforced polymer matrix composites, it is a good option to use polyurea (PUr) as the matrix material to eliminate the aforementioned weaknesses of the fibers. PUr is generally resistant to outdoor conditions and thus can eliminate the shortcomings of natural fibers. Especially aliphatic PUrs are a good alternative as they have much higher UV resistance. Moreover, PUr is a green technology since it does not contain volatile organic compounds (VOC) and it is in harmony with natural fibers in this respect, too. PUr is an elastomeric polymer and is formed by the polymerization process in which isocyanate (N = C = O) and amine (NH2) react (Iqbal et al. Citation2016, Citation2018). Isocyanate is also used in surface modification of cellulosic natural fibers (George et al. Citation1996; Kokta et al. Citation1990; Sathish et al. Citation2021). The functional group of isocyanate (-N = C = O) reacts with the hydroxyl (−OH) groups of the cellulose and lignin components of natural fibers and the moisture contained in the fiber. The first reaction referred in previous sentence results with formation of a urethane bond; whereas the second reaction leads to urea creationincreasing the moisture resistance (by reducing its hydrophilic property) of the fiber, which in turn strengthens the matrix-fiber interface adhesion (Kabir et al. Citation2012).
By adding fillers to fiber-reinforced polymer composites, multiphase composites with improved properties can be obtained. However, if the filler material is not selected in accordance with its purpose then, on the contrary it may reversely affect the desired properties which are aimed to be developed. PUrs are already in the form of a nano-filled composite because the nano-sized hard segments inside them are dispersed into the soft segment (Casalini et al. Citation2012). However, by applying nano-filler to the PUr matrix, composites with some improved properties can be produced. Proper filling material selection is not always an easy process. Adding filler can create a lot of variability in different parameters in composites. Especially in applications with complex mechanisms such as tribological experiments, it can affect different mechanisms and make them much more complex. For this reason, it is important to increase the number of tribological studies in multi phased composites. Although it is known that PUr has high resistance to reaction and wear (Samiee, Amirkhizi, and Nemat-Nasser Citation2013), few specific studies have been done on the tribology of PUr composites (Hu et al. Citation2009; Wang et al. Citation2014).
In this study, natural fiber reinforced aliphatic polyaspartic PUr matrix composites, unfilled and containing TiO2 and GNPs nano-fillers in different proportions (0.5,1,1.5 wt%), produced using VARTM, and their tribological behaviors under different loads and at different temperatures were investigated.
Material and method
Material
In the study, 11 × 12 inches plain woven jute fabric with 313 g/m2 areal density and 1.53 wt% oil content, which is in the class of natural fibers and procured from Ganges Jute Private Limited, is used as a reinforcement material. As the matrix material, White Chem PA 1005 polyaspartic PUr, which was procured from AKDE Performance Chemicals is used. The properties of the amine and hexamethylene diisocyanate (HDI) components of the polyaspartic PUr are presented in . The mechanical and physical properties of polyaspartic PUr are presented in .
Table 1. Technical properties of the PUr components (Erdoğdu Citation2020).
Table 2. The mechanical and physical properties of polyaspartic PUr (Erdoğdu Citation2020).
As nano-filler material; anatase TiO2 and GNPs procured from Nanografi Turkey are used. It is known that using TiO2 nano filler increases wear resistance. It has been observed that the use of TiO2 nanofillers in short fiber reinforced epoxy composites reduces the friction coefficient and wear rate (Chang and Friedrich Citation2010; Chang and Zhang Citation2006; Zhang et al. Citation2004, Citation2016). Nano TiO2, which has become widespread in environment friendly applications due to its photocatalyst effect in recent years, also has high UV resistance. The hydrophilic character of natural fibers weakens their attachment to the matrix. TiO2 behaves super hydrophilic under UV light (Kavitha et al. Citation2020). In this way, it is anticipated that the disadvantage of the hydrophilicity of the natural fiber can be partially eliminated by making the modified matrix hydrophilic. In other words, it is intended to strengthen the fiber-matrix interface adhesion.
GNPs also have a reducing effect on friction coefficient and specific wear rate of polymer composites, and their lubricating effect and particularly high thermal conductivity make GNPs a good alternative as nano-fillers in sliding wear applications (Kazemi-Khasragh et al. Citation2020; Kazemi‐khasragh et al. Citation2019; Kishore, Amrita, and Kamesh Citation2021). GNPs nano-filler was preferred based on the assumption that the lubricating effect will decrease the friction force during sliding and its high thermal conductivity will increase the wear resistance by ensuring that the heat on the contact surface is transferred to the composite to form a homogeneous distribution. Technical properties of TiO2 ve GNPs are presented in .
Table 3. Technical properties of TiO2 and GNPs (“As of December 11, 2021, the nanografi listed on its website https://nanografi.com/”).
Composite manufacturing
Firstly, 230 × 330 mm pieces were cut from the jute fabric roll in the same direction. Then, washed with tap water to remove dust, oil, wax from the cut fabric. Washing away the impurities enhances fiber-matrix interface adhesion but also removes the hard folds of the fabric to maintain easy formability. Washed fabric sheets were dried at room temperature for 1 week. Concurrently, resins for the VARTM process were prepared according to the parameters given in , with the help of an IKA RW 20 digital mixer. Since it is known that the viscosity of polyaspartic PUr material increases very rapidly, attention has been paid to keep amine and HDI mixing times particularly short and mixing speed particularly low.
Table 4. Preparing of the resins.
As can be seen from , 4 layers of jute fabric were placed in the vacuum package and VARTM process was initiated. In the production of unfilled and TiO2 filled composites, a normal sequential setup is used as in , while in the production of GNPs reinforced composites, double-sided peel ply and distribution media () are used. In this way, the problem of poor wetting of the fibers with the matrix material due to the increase in viscosity and agglomerations were reduced and better dispersion was achieved.
Figure 1. VARTM application, a) for unfilled and TiO2 nanofiller, b) GNPs nanofiller, c) general view.
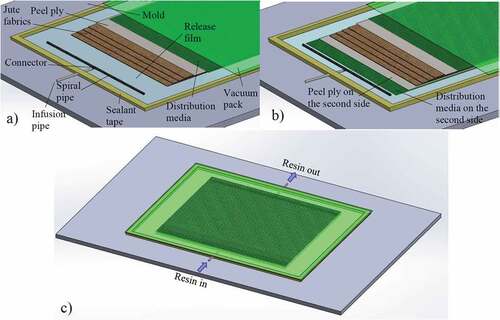
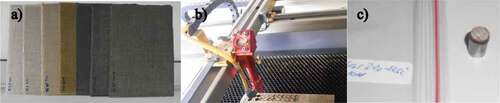
After the VARTM process was completed, the vacuum pack was left to cure at room temperature for 24 h, and the composite plates produced after curing were removed from the vacuum pack. Wear test samples of ⊘10 mm were taken from the produced unfilled and 0.5, 1, 1.5 wt% nano-filled composite plates () using EBH CNC laser (). In order to attach the composite specimens to the test device, composites were adhered to the steel pins with BETA Mitreapel instant adhesive and made ready for the test ().
Figure 2. a) Composite plates, b) CNC laser cutting, c) sample ready for test.
Tribological tests
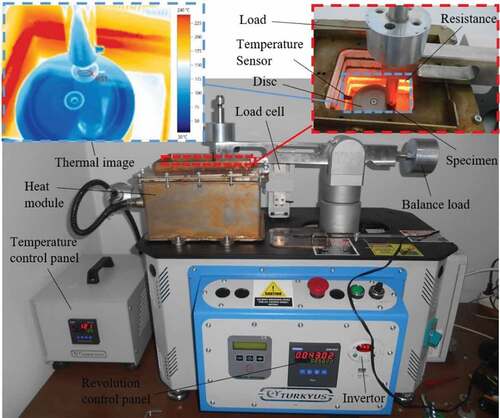
While determining the test type and test parameters, preference is made based on; the ability to show the durability limits of the material, compatibility and comparability with the literature as much as possible. Wear tests were carried out using the heat module pin-on-disc type Turkyus POD & HT & WT tribotest device shown in .
Figure 3. Wear test setup.
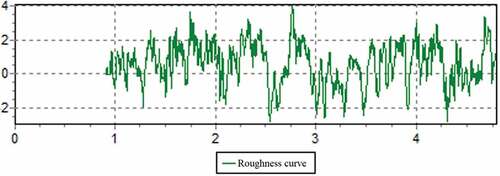
An AISI 4140 steel disc of 58 HRC surface hardness, 20 mm thick, ⊘80 mm is used as the counter surface. The decision to utilize AISI 4140 alloy steel as a counter surface, aside from its extensive use in the aviation and automotive industries, is based on such properties as convenience for surface hardening process and high wear resistance. Since it is aimed to determine the limits of the produced composites by testing under more difficult conditions, a high surface roughness was preferred. The surface roughness of the disc was measured at 0.8 mm sampling length and 4 mm evaluation length, with a Time TR 3200 roughness meter and the roughness curves were obtained using the Time 3200-EN (1.0) software. The average surface roughness value was found as Ra = 1.033 µm and the roughness curve closest to the average value is presented in .
Figure 4. Surface roughness curve of the metal countersurface (Erdoğdu Citation2020).
Tribotests were conducted in laboratory conditions with an ambient temperature of 20–23°C and a humidity around 60%. PUr is a material that is generally used for waterproofing in the construction industry and the majority of the ambient humidity is removed from the polymer at the selected high tribotest temperatures, no humidity adjustment was required in the test environment. Tribotests were carried out according to a standard (ASTM G 99–95a Standard Test Method for Wear Testing with a Pin-on-Disk Apparatus Citation2000) at 6000 m sliding distance and three different temperature values (100°C, 125°C, and 150°C). Due to the fact that the load values commonly used in the literature are concentrated in the range of 0–30 N and sliding speed values range of 1–5 m/s (Chaudhary, Bajpai, and Maheshwari Citation2018; Hashmi, Dwivedi, and Chand Citation2007; Mohan, Natarajan, and Kumaresh Babu Citation2011; Nirmal, Hashim, and Low Citation2012); wear tests were performed at a sliding speed of 2 m/s and under 10, 20, 30 N loads. In determining the test temperatures, the temperature resistance limit of natural fibers described in the first chapter was taken into account. At the beginning and at the end of each test, the samples were weighed with the Necklife FA 2004 precision scale with 0.1 mg sensitivity and the wear loss was calculated by calculating the difference between the values. Specific wear rates, which are a reliable parameter in comparing wear resistance, are calculated by EquationEquation (1)(1)
(1) .
It is given here as; W: specific wear rate (mm3/Nm), Δm: wear loss (g), ρ: density (g/mm3), N: load (N), L: sliding distance (m).
Before each test, the disc counter surface was cleaned with acetone. During the tests, thermal images of frictional surfaces were taken with Testo 875-1i thermal camera at 10-min intervals () and the temperature value of the highest temperature point in the interface area was taken with the help of Testo IR Soft software. The friction coefficient (µ) values were recorded at a frequency of 4 Hz during the tests with the Turkyus software. For each test parameter, three samples were tested and the average values of the test results were taken. At the end of the tribotests, scanning electron microscope (SEM) and energy dissipative X-ray (EDX) analyzes were performed on composite samples prepared with gold palladium powders and on the opposite surface of the disc using a 20 kV capacity Leo Evo 40 SEM device.
The chemical properties of the jute reinforced unfilled, TiO2 and GNPs filled PUr composites prepared within the scope of the study were characterized by Fourier-transform infrared (FTIR) spectroscopy. Perkin Elmer Two model FTIR spectrophotometer was used for FTIR analysis. Spectrums were obtained in the range of 400–4000 cm−1 and with a sensitivity of 4 cm−1. Homogeneous powder samples were prepared from the composites and their components by powder etching method and FTIR analyzes were performed in ATR mode.
The softening temperatures and thermal properties of the samples were determined by differential scanning calorimetry (DSC) analysis. DSC analyzes were carried out using Shimadzu DSC-60 device, in a static air atmosphere with a heating rate of 10°C/min, with 5 mg samples each in Al pan in the range of about 20–500°C. Alumina (Al2O3) was used as reference material in the analyzes.
Findings
Wear tests
In wear tests performed under different loads and high temperatures, three different parameters are tracked; friction coefficient, wear loss and interface temperature. Wear tests are carried out under 10, 20, and 30 N loads of unfilled composite specimens and specimens containing different proportions of nano-fillers. The average friction coefficient values after the running-in phase of the tests are presented in .
Figure 5. Average friction coefficient graph for wear tests performed under a)10 N, b)20 N, c)30 N.
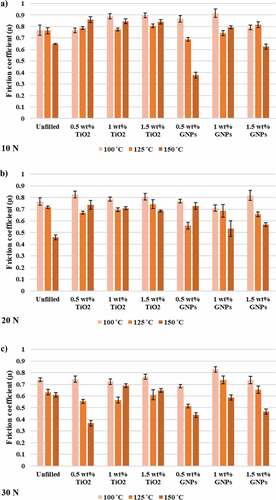
As can be seen in , µ values of unfilled composite samples have a linear relationship with temperature in which µ values decrease as the temperature increases. In nano-filled composites, no regular relationship between temperature and µ is observed, but generally µ values decrease with increasing temperature. When the behavior of µ with respect to load is observed in unfilled and TiO2 filled samples, it is seen that generally µ values decrease as the load increases under the same temperature conditions. The decrease in friction force as the load increases while the polymers are in friction contact with steel counter surfaces indicates the elastic deformation of the polymer surface asperities, whereas the increase in the friction force indicates the plastic deformation of the polymer surface asperities (Sinha and Briscoe Citation2009). Although it was expected that TiO2 nanofilling would directly decrease the µ values, more irregular results have been encountered. Jiang and Zhang (Citation2013) stated that particle fillers can have positive and negative effects depending on the conditions. As a negative effect, they stated that especially clustered particles can act as an abrasive body and increase wear in sliding, and the continuity of the matrix may decrease due to broken particles. In addition, TiO2‘s super hydrophilic property had a weak effect since it was only under the influence of UV light filtered from the atmosphere. On the other hand, in samples filled with GNPs, a regular relationship between the µ value with the applied load is not observed. Although it is expected that the high lubricity and thermal conductivity of GNPs would reduce the friction coefficient, viscosity enhancement and agglomeration tendency causes more errors in production and weakens the fiber-matrix interface adhesion (Erdoğdu and Temiz Citation2021; Erdoğdu, Korkmaz, and Temiz Citation2021). This state of disorder can be explained by the presence of such unique characteristics of GNPs and by the predominance of one feature over others at certain time intervals. The usage rates of the nano-filler materials used are also decisive at this point. Kazemi‐khasragh et al. (Citation2019) studied the sliding wear of GNPs nano-filled basalt fibers-reinforced epoxy composites at different ratios (0, 0.1, 0.2, 0.3, 0.4, and 0.5 wt%). They reported that GNPs fillers improved the wear properties from unfilled to 0.3 wt%, and after 0.3 wt%, they weakened these properties due to GNPs agglomeration. Having a high surface roughness value of the counter surface limited the film formation and reduced the positive effects of nano-fillers. It has been observed that there is no regular relationship between nano-filler ratio and µ in nano-filled composites.
During the wear tests, interface temperatures are monitored utilizing a thermal camera. Heat given by the heat module resistor together with the heat energy resulting from the friction, causes temperature increase on the frictional surface between the composite samples and the steel disc. The interface temperature values followed during the tests carried out under 10 N, 20 N, and 30 N loads are presented in , respectively.
Figure 6. The graphs of the sliding distance-interface temperatures of the wear tests performed under 10 N load (Erdoğdu Citation2020).
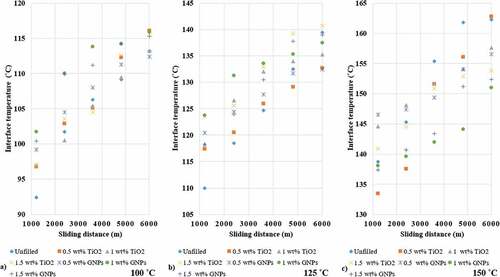
Figure 7. The graphs of the sliding distance-interface temperatures of the wear tests performed under 20 N load (Erdoğdu Citation2020).
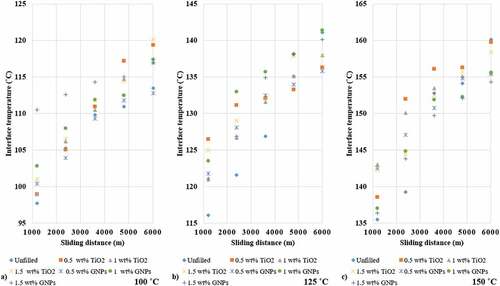
Figure 8. The graphs of the sliding distance-interface temperatures of the wear tests performed under 30 N load (Erdoğdu Citation2020).

Increasing both the sliding distance and the temperature in all samples naturally increased the interface temperature (). Maximum interface temperature values and maximum interface temperature difference values are seen in experiments conducted under 30 N load and 150 °C temperature conditions. While the interface temperature values in GNPs filled composite samples generally show a high tendency to increase up to about 150 °C, the tendency of the interface temperature values to increase at values higher than 150 °C ‘has somewhat decreased (). The reason behind this is the significant decrease of friction coefficient value as the temperature rises after this interface temperature value. The highest interface temperature is measured as 165.1 °C on unfilled composite samples under 30 N load and 150 °C temperature. Wear losses of unfilled and nano-filled composite samples are given in .
Table 5. Wear losses of composite samples (Erdoğdu Citation2020).
Since the tests are carried out at 100 °C and higher temperatures, it should be taken into account that the wear loss values are actually lower than the values given in , considering that there is additional loss due to moisture. In this case, it can be said that the wear resistance of PUr matrix composites is generally high. In general, wear loss increases with increasing load and temperature. Under the most extreme conditions (30 N load and 150 °C), it is understood that the lowest wear loss is in samples filled with 0.5 wt% GNPs.
At the same temperature values, the highest wear rates are generally observed under 10 N load (). Under the same temperature conditions, the increase in the load caused the wear rate to tend to decrease, albeit irregularly. Under the same loads (except 0.5 wt% GNPs samples under 30 N load), wear rate increases with the increase of temperature in all composite samples. However, if it is taken into consideration that the µ value generally decreases with the increase in temperature, it is understood that a film layer is formed between the steel counter-surface and the composite samples. In addition, analyzing the data in , it can be seen that temperature is more determinant in the change of wear rate than load. It should also be noted that, in the most extreme conditions (30 N load and 150 °C temperature), highest wear resistance is in samples filled with 0.5 wt% GNPs.
Table 6. Specific wear rates of composite samples (Erdoğdu Citation2020).
EDX and SEM analysis
Following the wear tests, the material transition from polymer composite to AISI 4140 steel counter surface is investigated. Visually observing the counter surface, very few and poorly adhered polymer residues are found to be evident. In order to examine this in detail, a SEM image is taken on the metal surface after the wear test of the TiO2 nano-filled sample by making use of the distinctiveness of the Ti element and EDX analysis is performed throughout various regions ().
Figure 9. SEM image of the disc surface and EDX results after the wear test of the sample filled with 1.5 wt% TiO2 at 30 N load, 150 °C temperature and 2 m/s sliding speed.
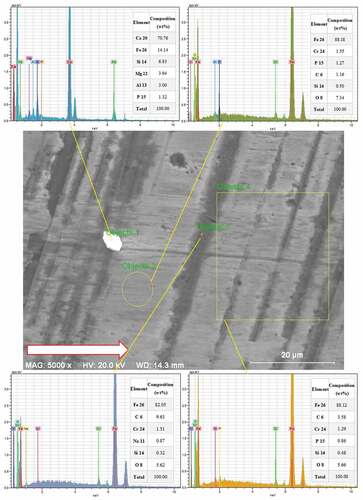
When is examined, even the fragment (Objects 1) detached from the refractory of the heat module is seen in the EDX data taken from different points and regions, no evidence of Ti element was found. This shows that even if the film layer is formed during the test, and even the material is transferred to the metal surface, there is no actual polymer transfer residue on the metal surface after the wear test under high temperature and pressure. The SEM and EDX analysis image of the regions with rare and poorly adhered residues is presented in .
Figure 10. The SEM image and EDX results of the regions with rare and poorly adhered residues on the disc surface.
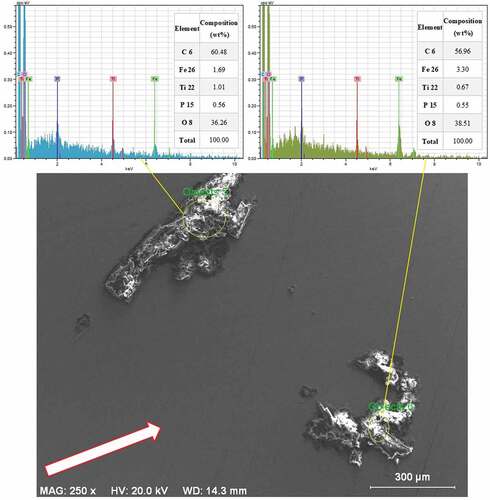
When is examined, it is seen that Ti element is found in EDX analysis of polymer residues that are noticeably large and weakly adhered on the disc surface. Although film formation and polymer transfer to metal surface occurs as a result of using an elastomer matrix such as PUr and high sliding rate and temperatures engaged, it’s seen that polymer residues are mostly removed from the metal surface simultaneously with the test. SEM images are taken from the worn surfaces of the composite specimens in order to observe the wear damage and wear mechanisms. SEM images of unfilled samples can be seen in .
Figure 11. SEM images of unfilled composite specimens’ worn surfaces at 150 °C, a)10 N, b) 30 N.
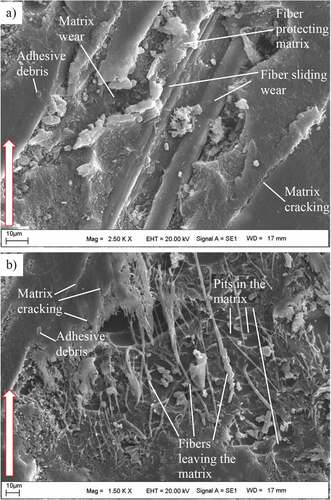
During the wear of multiphased polymer composites with fiber and filler, first the matrix protecting the fiber is worn, then the fiber itself is worn and thinned, then it is broken and separated by breaking (Chang and Zhang Citation2006). These stages, which include matrix and fiber wear damages due to sliding, are shown in . In addition to these damages, sharp-edged pits and cracks in the matrix, indicating the fatigue wear mechanism, are also observed. In , SEM images of the worn surfaces of TiO2 and GNPs filled composites are shown, respectively.
Figure 12. SEM images of the worn surfaces of TiO2 filled composite samples at 30 N-150 °C conditions, a) 0.5 wt% TiO2, b) 1 wt% TiO2, c) 1.5 wt% TiO2.
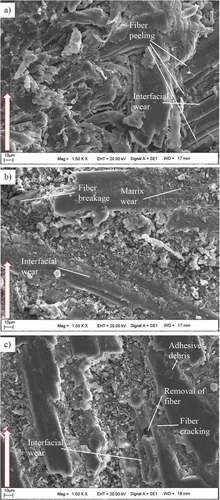
Figure 13. SEM images of the worn surfaces of GNPs filled composite samples at 30 N-150 °C conditions, a) 0.5 wt% GNPs, b) 1 wt% GNPs, c) 1.5 wt% GNPs.
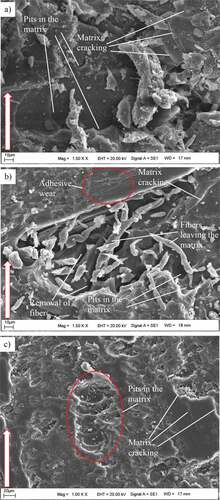
In , damages due to adhesion is seen first in the form of matrix wear due to sliding, then interface wear, fiber cracking, and finally breakage. The occurrence of damage in such a sequence also indicates that the fiber matrix interface adhesion is strong. In , similar to , matrix cracks and sharp-edged pits are seen, indicating strong adhesion damage as well as fatigue damage. Conducting the tests at a long sliding distance and the relatively weak fiber-matrix interface adhesion were effective in the occurrence of fatigue damage. First, crack zones were formed in the matrix and the cracks deepened due to fatigue and caused large breakages in these areas. By increasing the cohesive strength of polymers, nano-fillers can increase the resistance of composites to abrasive wear and fatigue wear (Sinha and Briscoe Citation2009). This is also linked to fiber-matrix interface adhesion. TiO2 nano-filler showed a similar effect, increasing the resistance to fatigue wear, too. On the other hand, in unfilled composites and GNPs nano-filled composites, significant fatigue damages are observed in addition to adhesive wear damages due to the effect of weaker interface adhesion.
FTIR characterization
FTIR spectrums prepared for structural analyzes of composites are shown in . Looking at the spectra of the TiO2 filled composites in , the Ti-O-Ti stretch in the range of 507–930 cm−1 on the peak of the pure nano TiO2 structure is seen in . In addition, Ti-O stretch is evident around 411 cm−1. The spectrum of the jute fiber structure is shown in . In this spectrum, especially the -OH group -H bond stretching vibrations of the cellulose groups in the jute structure give a wide band peak in the range of 3000–3600 cm−1. Again, C-H groups in the cellulose structure give aliphatic methyl peak in the range of 2850–2950 cm−1. C-O-C etheric stretching vibration is observed in the range of approximately 900–1100 cm−1.
Figure 14. FTIR spectrums of of TiO2 filled composites and their components, a) Nano TiO2, b) Jute fiber, c) PUr, d) 0.5 wt% TiO2, e) 1 wt% TiO2, f) 1.5 wt% TiO2.
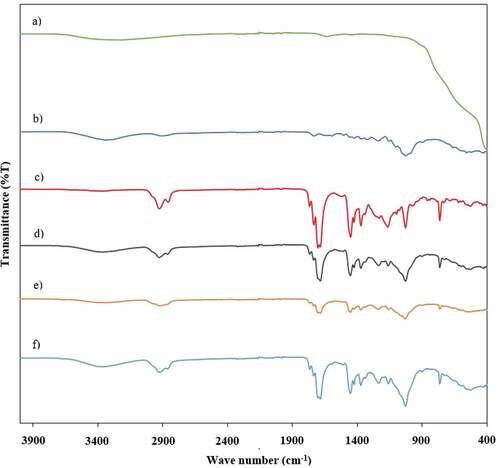
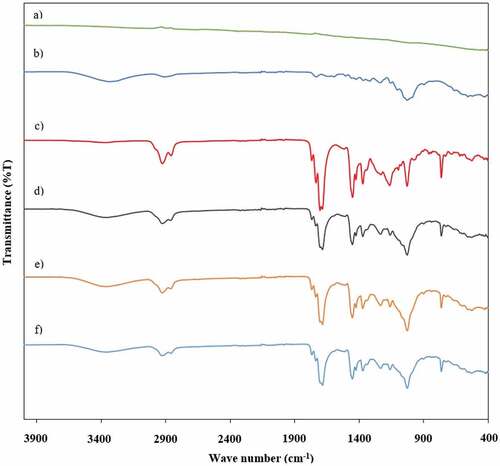
Figure 15. FTIR spectrums of of GNPs filled composites and their components, a) GNPs, b) Jute fiber, c) PUr, d) 0.5 wt% GNPs, e) 1 wt% GNPs, f) 1.5 wt% GNPs.
shows the FTIR spectrum of pure PUr. In this spectrum, C-H stretching vibrations originating from polymeric main chain are seen in the range of 2810–2960 cm−1. Especially around 1686 cm−1, a very strong C=O (carbonyl) peak is observed. Around 1450 cm−1 C-N stretching vibration and around 1371 cm−1 C-C aliphatic stretching vibration is observed. In addition, the C-O band peak around 1220 cm−1 and the C-H band peak around 760 cm−1 confirm the PUr structure. In the spectrums in , e and f, the -OH group -H bond in the range of 3000–3600 cm−1 and the C-O-C etheric stretching vibration around 1025 cm−1 are seen, originating from the fiber groups in the structure. In addition, C=O, C-N and C-C peaks, which are seen around 1682,1451,1370 cm−1, respectively, confirm the PUr structure. As the amount of TiO2 in the structure increases, the Ti-O peak intensity around 530 cm−1 increases and this proves that the desired structure is obtained.
Considering the spectrums of the GNPs filled composites in , there is no significant peak in the spectrum of pure GNPs in . This is compatible with the structure of GNPs. In , e and f spectrums, peaks belonging to composite structures with increasing GNPs filler content are seen. In all three composite structures, the basic peaks in both jute and pure PUr structures are clearly visible. Especially the band peak in the range of 3000–3600 cm−1 confirms the presence of jute in the composite. In addition, C-N peaks around 1450 cm−1 and C=O peaks around 1680 cm−1 confirm the presence of PUr in the composite. In addition, as the amount of GNPs in the structure increases, the C-C peak intensity around 1371 cm−1 increases and this proves that the desired structure is obtained.
Thermal analysis
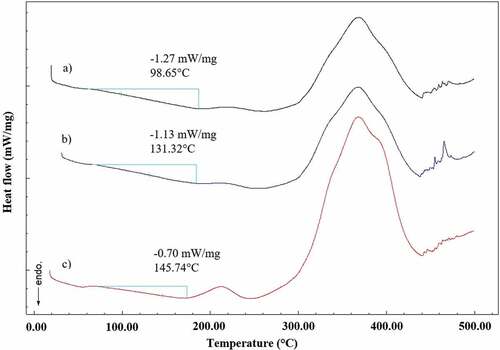
The thermal curves of pure PUr, 1 wt% TiO2 and GNPs filled composites obtained after DSC analysis are shown in . When the thermal curve of the PUr structure in is examined, it is seen that the glass transition temperature (Tg) is 98.65°C. This value is in accordance with the literature and confirms the aliphatic structure of PUr. There is also a two-stage thermal degradation process. In the first stage, degradation is seen in the crosslinking units in the PUr structure, while the main PUr structure is stable. At around 263°C, thermal degradation of the PUr structure begins and ends at 440.64°C. When the thermal curve () of the composite prepared by filling TiO2 into this structure is examined, it is seen that the Tg value has increased to 131.32°C. In addition, the other two thermal degradations remain stable. The first degradation starts at 188°C and continues up to 265°C. The second degradation starts from 265°C and continues up to 435.37°C. When the thermal curve in is examined, it is seen that the Tg value of the GNPs filled composite is 145.74°C. Considering the thermal degradation, it is seen that the first mass loss is in the range of 178.94°C − 251.18°C. Due to the degradation of GNPs, the area under the peak in this region is larger than that of other samples. The second decomposition exotherm peak, which is caused by the degradation of the polymeric structure, starts at 260.36°C and ends at 441.06°C. When all the data are examined together, it can be said that the composite structures are thermally stable up to about 190°C and both added nanofillers increase the Tg value.
Figure 16. DSC results of composites, a) PUr, b) 1 wt% TiO2, c) 1 wt% GNPs.
Conclusions
In this study using the VARTM method, woven jute reinforced, polyaspartic PUr matrix, both unfilled and nano-filled composites are produced, and their tribological behavior at high temperatures is investigated. The usability of polyaspartic PUr as a matrix and its producibility with the VARTM method is tested. The effects of TiO2 and GNPs nanofillers with different filling ratios on tribological properties are investigated. At the end of the study, the following results are collected:
Polyaspartic PUr material is used as a matrix in composites and found to be compatible with natural fiber reinforcement and the VARTM technique.
It is observed that the nano-filler used in multiphased polymer composites significantly affects the dominant wear mechanisms. It is also understood that while adhesive and fatigue wear mechanisms are dominant in unfilled and GNPs filled composites, only the adhesive wear mechanism is dominant in TiO2 filled composites.
The increase in temperature in unfilled composites resulted in a decrease in the friction coefficient. Although the increase in temperature in nano-filled composites also causes a tendency to decrease the friction coefficient in general; the modification of the matrix caused serious differences in the friction mechanisms which in turn, caused irregular changes in the friction coefficient.
Except for 0.5 wt% GNPs filled samples, wear loss and specific wear rate increases with increasing temperature and increasing load in all samples with and without nano filler.
Acknowledgements
Authors are grateful to Savaş Erdoğdu and Başak Erdoğdu for proofreading the article. This study is derived from the doctoral dissertation at reference (Erdoğdu 2020). Authors are grateful to the Scientific Research Projects Unit of Inonu University for financial support through projects FDK-2019-1812 and FBA-2019-1750.
Disclosure statement
No potential conflict of interest was reported by the author(s).
Additional information
Funding
References
- Ashik, K. P., R. S. Sharma, and N. Raghavendra. 2017. Evaluation of tensile, modal and fracture properties of jute/epoxy natural composites with addition of silicon Di oxide as filler material. Materials Today: Proceedings 4 (9):9586–21. doi:10.1016/j.matpr.2017.06.229.
- ASTM G 99–95a Standard Test Method for Wear Testing with a Pin-on-Disk Apparatus. 2000. Annual book of ASTM standards. West Conshohocken, United States: American Society for Testing and Materials.
- Casalini, R., R. Bogoslovov, S. B. Qadri, and C. M. Roland. 2012. Nanofiller reinforcement of elastomeric polyurea. Polymer 53 (6):1282–87. doi:10.1016/j.polymer.2012.01.034.
- Chang, L., and K. Friedrich. 2010. Enhancement effect of nanoparticles on the sliding wear of short fiber-reinforced polymer composites: A critical discussion of wear mechanisms. Tribology International 43 (12):2355–64. doi:10.1016/j.triboint.2010.08.011.
- Chang, L., and Z. Zhang. 2006. Tribological properties of epoxy nanocomposites: Part II. A combinative effect of short carbon fibre with nano-TiO2. Wear 260 (7–8):869–78. doi:10.1016/j.wear.2005.04.002.
- Chaudhary, V., P. K. Bajpai, and S. Maheshwari. 2018. An investigation on wear and dynamic mechanical behavior of jute/hemp/flax reinforced composites and its hybrids for tribological applications. Fibers and Polymers 19 (2):403–15. doi:10.1007/s12221-018-7759-6.
- Erdoğdu, Y. E. 2020. Investigation of the mechanical and tribological behaviors of natural fiber reinforced particle filled polymer matrix composites. [In Turkish]. PhD diss., Inonu University.
- Erdoğdu, Y. E., E. E. Korkmaz, and Ş. Temiz. 2021. Effect of graphene nanoplatelet filling on mechanical properties of natural fiber reinforced polymer composites. Materials Testing 63 (4):322–28. doi:10.1515/mt-2020-0046.
- Erdoğdu, Y. E., and Ş. Temiz. 2021. Abrasive wear on natural fiber reinforced graphene nanoplatelets filled epoxy matrix composites. Journal of the Institute of Science and Technology 11 (1):440–49. In Turkish. doi:10.21597/jist.811215.
- George, J., R. Janardhan, J. S. Anand, S. S. Bhagawan, and S. Thomas. 1996. Melt rheological behaviour of short pineapple fibre reinforced low density polyethylene composites. Polymer 37 (24):5421–31. doi:10.1016/S0032-3861(96)00386-2.
- Gu, Y., X. Tan, Z. Yang, and Z. Zhang. 2014. Hot compaction and mechanical properties of ramie fabric/epoxy composite fabricated using vacuum assisted resin infusion molding. Materials & Design (1980-2015) 56:852–61. doi:10.1016/j.matdes.2013.11.077.
- Hashmi, S. A. R., U. K. Dwivedi, and N. Chand. 2007. Graphite modified cotton fibre reinforced polyester composites under sliding wear conditions. Wear 262 (11–12):1426–32. doi:10.1016/j.wear.2007.01.014.
- Hu, H., S. Yu, M. Wang, J. Ma, and K. Liu. 2009. Tribological properties of epoxy/polyurea composite. Polymers for Advanced Technologies 20 (9):748–52. doi:10.1002/pat.1347.
- Iqbal, N., M. Tripathi, S. Parthasarathy, D. Kumar, and P. K. Roy. 2016. Polyurea coatings for enhanced blast-mitigation: A review. RSC advances 6 (111):109706–17. doi:10.1039/C6RA23866A.
- Iqbal, N., M. Tripathi, S. Parthasarathy, D. Kumar, and P. K. Roy. 2018. Aromatic versus aliphatic: Hydrogen bonding pattern in chain‐extended high‐performance polyurea. Chemistry Select 3 (7):1976–82. doi:10.1002/slct.201703176.
- Jawaid, M., H. A. Khalil, A. Hassan, R. Dungani, and A. Hadiyane. 2013. Effect of jute fibre loading on tensile and dynamic mechanical properties of oil palm epoxy composites. Composites Part B: Engineering 45 (1):619–24. doi:10.1016/j.compositesb.2012.04.068.
- Jiang, Z., and Z. Zhang. 2013. Wear of Multi-Scale Phase Reinforced Composites. In Tribology of nanocomposites, ed. J. P. Davim, 79–100. Berlin Heidelberg: Springer.
- Job, S., P. Mativenga, N. A. Shuaib, G. Oliveux, G. Leeke, and S. Pickering. 2016. Composites Recycling - where are we now?. United Kingdom: Composites UK.
- Joseph, P. V., K. Joseph, S. Thomas, C. K. S. Pillai, V. S. Prasad, G. Groeninckx, and M. Sarkissova. 2003. The thermal and cystallisation studies of short sisal fibre reinforced polypropylene composites. Composites Part A, Applied Science and Manufacturing 34 (3):253–66. doi:10.1016/S1359-835X(02)00185-9.
- Joshi, S. V., L. T. Drzal, A. K. Mohanty, and S. Arora. 2004. Are natural fiber composites environmentally superior to glass fiber reinforced composites? Composites Part A, Applied Science and Manufacturing 35 (3):371–76. doi:10.1016/j.compositesa.2003.09.016.
- Kabir, M. M., H. Wang, K. T. Lau, and F. Cardona. 2012. Chemical treatments on plant-based natural fibre reinforced polymer composites: An overview. Composites Part B: Engineering 43 (7):2883–92. doi:10.1016/j.compositesb.2012.04.053.
- Kavitha, M. K., L. Rolland, L. Johnson, H. John, and M. K. Jayaraj. 2020. Visible light responsive superhydrophilic TiO2/reduced graphene oxide coating by vacuum-assisted filtration and transfer method for self-cleaning application. Materials Science in Semiconductor Processing 113:105011. doi:10.1016/j.mssp.2020.105011.
- Kazemi‐khasragh, E., F. Bahari‐sambran, S. M. H. Siadati, R. Eslami‐farsani, and S. Arbab Chirani. 2019. The effects of surface‐modified graphene nanoplatelets on the sliding wear properties of basalt fibers‐reinforced epoxy composites. Journal of Applied Polymer Science 136 (39):47986. doi:10.1002/app.47986.
- Kazemi-Khasragh, E., F. Bahari-Sambran, C. Platzer, and R. Eslami-Farsani. 2020. The synergistic effect of graphene nanoplatelets–montmorillonite hybrid system on tribological behavior of epoxy-based nanocomposites. Tribology International 151:106472. doi:10.1016/j.triboint.2020.106472.
- Kishore, M., M. Amrita, and B. Kamesh. 2021. Tribological properties of basalt-jute hybrid composite with graphene as nanofiller. Materials Today: Proceedings 43:244–49. doi:10.1016/j.matpr.2020.11.654.
- Kokta, B. V., D. Maldas, C. Daneault, and P. Beland. 1990. Composites of polyvinyl chloride-wood fibers. I. effect of isocyanate as a bonding agent. Polymer-Plastics Technology and Engineering 29 (1–2):87–118. doi:10.1080/03602559008049836.
- Li, M., Y. Pu, V. M. Thomas, C. G. Yoo, S. Ozcan, Y. Deng, K. Nelson, and A. J. Ragauskas. 2020. Recent advancements of plant-based natural fiber–reinforced composites and their applications. Composites Part B: Engineering 200:108254. doi:10.1016/j.compositesb.2020.108254.
- Mohammed, L., M. N. Ansari, G. Pua, M. Jawaid, and M. S. Islam. 2015. A review on natural fiber reinforced polymer composite and its applications. International Journal of Polymer Science 2015:1–15. 243947. doi:10.1155/2015/243947.
- Mohan, N., S. Natarajan, and S. P. Kumaresh Babu. 2011. Sliding wear behavior of graphite filled glass-epoxy composites at elevated temperatures. Polymer-Plastics Technology and Engineering 50 (3):251–59. doi:10.1080/03602559.2010.531606.
- Nirmal, U., J. Hashim, and K. O. Low. 2012. Adhesive wear and frictional performance of bamboo fibres reinforced epoxy composite. Tribology International 47:122–33. doi:10.1016/j.triboint.2011.10.012.
- Pandita, S. D., X. Yuan, M. A. Manan, C. H. Lau, A. S. Subramanian, and J. Wei. 2014. Evaluation of jute/glass hybrid composite sandwich: Water resistance, impact properties and life cycle assessment. Journal of Reinforced Plastics and Composites 33 (1):14–25. doi:10.1177/0731684413505349.
- Pinto, M. A., V. B. Chalivendra, Y. K. Kim, and A. F. Lewis. 2013. Effect of surface treatment and Z-axis reinforcement on the interlaminar fracture of jute/epoxy laminated composites. Engineering Fracture Mechanics 114:104–14. doi:10.1016/j.engfracmech.2013.10.015.
- Saheb, D. N., and J. P. Jog. 1999. Natural fiber polymer composites: A review. Advances in Polymer Technology: Journal of the Polymer Processing Institute 18 (4):351–63. doi:10.1002/(SICI)1098-2329(199924)18:4<351:AID-ADV6>3.0.CO;2-X.
- Samiee, A., A. V. Amirkhizi, and S. Nemat-Nasser. 2013. Numerical study of the effect of polyurea on the performance of steel plates under blast loads. Mechanics of Materials 64:1–10. doi:10.1016/j.mechmat.2013.03.008.
- Sathish, S., N. Karthi, L. Prabhu, S. Gokulkumar, D. Balaji, N. Vigneshkumar, T. S. Ajeem Farhan, A. AkilKumar, and V. P. Dinesh. 2021. A review of natural fiber composites: Extraction methods, chemical treatments and applications. Materials Today: Proceedings 45 (9):8017–23. doi:10.1016/j.matpr.2020.12.1105.
- Sgriccia, N., M. C. Hawley, and M. Misra. 2008. Characterization of natural fiber surfaces and natural fiber composites. Composites Part A, Applied Science and Manufacturing 39 (10):1632–37. doi:10.1016/j.compositesa.2008.07.007.
- Sinha, S. K., and B. J. Briscoe. 2009. Polymer Tribology. Singapore: World Scientific.
- Vigneshwaran, S., R. Sundarakannan, K. M. John, R. D. J. Johnson, K. A. Prasath, S. Ajith, V. Arumugaprabu, and M. Uthayakumar. 2020. Recent advancement in the natural fiber polymer composites: A comprehensive review. Journal of Cleaner Production 277:124109. doi:10.1016/j.jclepro.2020.124109.
- Wang, X., S. Z. Luo, G. S. Liu, L. C. Zhang, and Y. Wang. 2014. Abrasion test of flexible protective materials on hydraulic structures. Water Science and Engineering 7 (1):106–16.
- Zhang, Z., C. Breidt, L. Chang, F. Haupert, and K. Friedrich. 2004. Enhancement of the wear resistance of epoxy: Short carbon fibre, graphite, PTFE and nano-TiO2. Composites Part A, Applied Science and Manufacturing 35 (12):1385–92. doi:10.1016/j.compositesa.2004.05.005.
- Zhang, L., G. Zhang, L. Chang, B. Wetzel, B. Jim, and Q. Wang. 2016. Distinct tribological mechanisms of silica nanoparticles in epoxy composites reinforced with carbon nanotubes, carbon fibers and glass fibers. Tribology International 104:225–36. doi:10.1016/j.triboint.2016.09.001.