
 ?Mathematical formulae have been encoded as MathML and are displayed in this HTML version using MathJax in order to improve their display. Uncheck the box to turn MathJax off. This feature requires Javascript. Click on a formula to zoom.
ABSTRACT
The huge amount of solid waste produced during the hydrodistillation of Pelargonium graveolens L’Hér. is a serious environmental hazard. The aim of this research is to reduce this environmental pollution and to valorize this waste by using its extract as a natural dye. Extracts were used for dyeing wool samples. The dyed fabrics showed shades ranging between brown and beige. By using the Minitab 19 Software, a definitive screening design was used to optimize the dye extraction process. The studied extraction process parameters were pH, temperature, and extraction time. The main studied responses were the color strength and the polyphenol, flavonoid, and condensed tannin contents (mg.g−1). Based on the photochemical study and the UV–vis absorption spectra, it was found that the polyphenol content varies between 4.144 and 7.567 mg.g−1. For the tannin content, the highest value was equal to 120.967 mg.g−1. To optimize the colorant extraction process, the K/S was also measured by the spectrocolorimeter. Process optimum conditions were of 11, 100°C, and 65 min, respectively, for pH, temperature, and extraction time. The optimum K/S value was equal to 115.15. Therefore, the solid waste hydrodistillation of Pelargonium graveolens can be an interesting choice for the natural dyeing of textile fabrics.
摘要
在Pelargonium graveolens L’Hér的水力蒸馏过程中产生的大量固体废物. 是严重的环境危害. 这项研究的目的是减少这种环境污染,并通过将其提取物用作天然染料,使这种废物价值化. 提取物用于染色羊毛样品。染色织物的色调介于棕色和米色之间. 通过使用Minitab 19软件,使用确定的筛选设计来优化染料提取过程. 研究的提取工艺参数为pH、温度和提取时间. 主要研究反应是颜色强度和多酚、类黄酮和浓缩单宁含量(mg.g-1). 根据光化学研究和UV-vis吸收光谱,发现多酚含量在4.144和7.567 mg.g-1之间变化. 单宁含量的最高值为120.967 mg.g-1. 为了优化着色剂提取过程,还通过分光光度计测量K/S.工艺最佳条件分别为11、100°C和65分钟,pH值、温度和提取时间. 最佳K/S值为115.15. 因此,天竺葵颗粒 的固体废物水力蒸馏可作为纺织品天然染色的一个有趣选择.
Introduction
Several researches were carried out to replace toxic synthetic dyes with natural ones. Natural dyes are known for their ecological, biocompatible, sustainable, and biodegradable aspects (Adeel et al. Citation2022; Haji and Naebe Citation2020; Hosseinnezhad et al. Citation2022). These dyes are extracted from renewable materials as especially rarely exploited plants (Batool, Iqbal, and Adeel Citation2022; Ur-Rehman et al. Citation2022).
The economic value of using waste-derived materials in several recycling and value-adding has been the subject of new natural dyeing methods (Mustafa et al. Citation2022). The sustainable extraction of natural dyes from agro-industrial wastes in the textile and fashion industries is another method for recycling waste using a sustainable and circular economic strategy (Adeel et al. Citation2018, Citation2019; Haque et al. Citation2022).
Hydrodistilation is a conventional method frequently used in the food, pharmaceutical, and cosmetic industries to extract essential oils from plants. This traditional method is known for producing huge amounts of agricultural wastes. These wastes are usually dumped into the environment. Thus, these huge amounts of waste should be valorized and recycled rather than abandoned since they contain valuable resources. This circular chemistry-based study aimed to reuse hydrodistillation solid wastes in eco-friendly textile dyeing and posed the challenge to discover and valorize a new value-added material (Gharred et al. Citation2021).
Pelargonium graveolens L’Hér. is known in many countries like Spain, France, China, Egypt, Algeria, Morocco, and Tunisia (Hamidpour et al. Citation2017). This specie is called rose geranium. In Tunisia, the area of geranium has been increasing since 2002 from nearly 60 to nearly 287 ha in 2011 (Ben ElHadj Ali et al. Citation2020). As in all the Mediterranean countries, this specie has a great value and is widely used in the pharmaceutical industry. Its floral water is extracted from the flowers, stems, and leaves. It is used in popular medicine and gastronomy (Ennaifer et al. Citation2018). In addition, its essential oil is extracted and used in cosmetic industries and perfumery. The antioxidant, antidiabetic, antifungal, and antibacterial activities of rose geranium species have been well confirmed (Al-Mijalli et al. Citation2022; Pandey et al. Citation2020).
In Tunisia, rose geranium is widely used to obtain a food hydrosol utilized in traditional pastries. However, the distillation of hydrosol and essential oil produces a large amount of colored water discharge (Riahi et al. Citation2020). According to the literature, researchers such as Gharred et al. and Dhouibi et al. used this effluent for dyeing textile fabrics (Dhouibi et al. Citation2021; Gharred et al. Citation2021). Nevertheless, the important amount of hydrodistillation solid waste was not yet used in the textile industry, and there have been no previous reports of its valorization. In this context, the main objective of this research was to study the possibility of the valorization of Pelargonium graveolens hydrodistillation solid waste for dyeing wool fabrics. The extraction of natural dye conditions was optimized by the establishment of a definitive screening design (DSD) with three independent parameters. These parameters were the pH, the extraction temperature (°C), and the extraction time (min). The studied responses were the color strength K/S, the polyphenol content (mg.g−1), the flavonoid content (mg.g−1), and the condensed tannin content (mg.g−1).
Materials and methods
Materials
The natural dye proposed in this study was the extract of residual solid waste collected from the hydrodistillation of Pelargonium graveolens. One hundred grams of dried plant parts (stems and leaves) were submitted for extraction with hydrodistillation while using distillation apparatus with 500 mL of water for 6 h (until no more geranium hydrosol was extracted). At the end of the extraction process, the residual bath containing water and plant parts was filtered and the plant parts waste resulting from the hydrodistillation of the rose geranium was dried at room temperature and its aqueous extract was then used as a natural dye.
Commercial bleached plain weave wool samples were used for dyeing. The mass per unit area of samples was of 140 g.m−2.
Chemicals
Vanillin (C8H8O3, Fluka), hydrochloric acid (HCl, Sigma Aldrich), aluminum chloride (AlCl3, Fluka), sodium nitrite (NaNO2, Fluka), sodium hydroxide (NaOH, Sigma Aldrich), ethanol (C2H6O, Sigma Aldrich), Folin-Ciocalteu reagent (Fluka), sodium carbonate (Na2CO3, Fluka), sulfuric acid (H₂SO₄, Fluka), catechin (Fluka), quercetin (Fluka), and gallic acid (Fluka) were laboratory reagents grade.
Extraction process
The waste resulting from the hydrodistillation of the geranium graveolens was dried at room temperature. Extraction of natural dyes from Pelargonium graveolens hydrodistillation solid waste was carried out in a laboratory dyeing machine (Ahiba Datacolor International, USA) in 90 mL of distilled water with a fixed quantity of leaves (3 g) and stems (3 g). The extraction temperature was ranging from 60°C to 100°C. The extraction time was varied from 45 to 75 min. The pH was also varied from 7 to 11.
Dyeing process
Wool fabric samples were dyed in a laboratory dyeing machine (Ahiba Datacolor International, USA) in the filtered extracted solution with fabric-to-liquor ratio (the ratio of the weight of fabric (g) to the total volume of dye bath (mL)) of 1:40. The dyeing bath pH was fixed at 3. Dyeing time and temperature were of 60 min and 80°C, respectively. At the end, the obtained fabrics were washed with water, squeezed, and dried at 60°C.
UV–vis absorption spectra
The UV–vis spectra of the rose geranium aqueous extracts were recorded using the JENWAY 6705 UV/VIS spectrophotometer. Absorbances were measured for wavelengths ranging from 200 to 600 nm.
Determination of condensed tannin content
The condensed tannin contents in geranium extracts were determined using the Julkunen–Titto method. A 50 mL sample of the extract was mixed with 1.5 mL vanillin (4%) and 750 µL HCl (37%). After incubation of the mixture at room temperature for 20 min, its absorbance was measured at a wavelength equal to 500 nm. The condensed tannin content was expressed in mg EC/g sample. (Julkunen-Tiitto Citation2002)
Determination of flavonoid content
For the determination of the flavonoid content, 1 mL of NaNO2 (5%) was added to 500 µL of rose geranium extract. The solution was then incubated at room temperature for 6 min. Then, 1 mL of AlCl3 (10%) and 10 mL of NaOH (1 M) were added to the solution. Ethanol (70%) was also added to the solution until it reaches the gauge line of a 25 mL flask. Then, the solution is incubated at room temperature for 15 min. To determine the flavonoid content, the absorbance of the solution was measured at a wavelength equal to 510 nm. The flavonoid content was expressed in mg QE/g sample. (Ibrahimi and Hajdari Citation2020)
Determination of total polyphenol content
The total polyphenol content in the extract of Pelargonium graveolens was determined using the method of Slinkard and Singleton. In a beaker, 50 µL of the extract was mixed with 1 mL of distilled water, 0.5 mL of Folin-Ciocalteu reagent, and 2.5 mL of Na2CO3 (20%). The solution was incubated at room temperature for 20 min. The absorbance of the resulting blue solution was measured at a wavelength equal to 765 nm. The total polyphenol content was then expressed in the mg GAE/g sample. (Thi Thu Ha et al. Citation2020)
Color evaluation
Dyed wool samples were examined by measuring the reflectance curve between 350 and 700 nm using a Datacolor 400™ spectrophotometer, with dataMaster 2.3 software using D65 illuminant. The color strength (K/S) value was calculated based on Kubelka–Munk equation (1) (Dhouibi et al. Citation2021):
Where K is the absorption coefficient, S is the scattering coefficient, R is the reflectance of dyed samples, and is the reflectance of undyed samples.
In this study, the dyed samples showed shades between brown and beige. In this case, it is preferable to measure the sum (K/S) which is determined by using equation (2).
Fourier Transform Infrared (FTIR) analysis
Fourier transform infrared spectra of the aqueous extracts of rose geranium, undyed and dyed wool samples were recorded using a Perkin-Elmer IR-197 spectrophotometer for a wavelength ranging from 4000 to 400 cm−1. The number of scans was 32 scans at a resolution of 4 cm−1.
Design of experiment
In the present research, dye extraction experiments were set by using the DSD (Minitab 19). The three studied parameters, A, B, and C, represent the pH, the extraction temperature, and the extraction time, respectively. Each factor was varied according to three levels (). The analysis of regression and variance (ANOVA) was used to determine the optimal conditions for extraction.
Table 1. Studied factors and levels.
Results and discussion
Modeling of the extraction process
Variance analysis (ANOVA)
The DSD, shown in , consists of 13 sets of experiments. The responses are the sum (K/S), the total polyphenol content (TPC), the flavonoid content, and the condensed tannin content.
Table 2. Definitive screening design used in the extraction process.
From , it can be noticed that the extraction conditions have an important effect on the percentages of flavonoid and condensed tannin. All the experiments, except 6, 7, and 9, showed that the flavonoid content was more important than the condensed tannin content.
From results presented in , the mathematical models relating the sum (K/S) and the total polyphenol content (TPC) with the different varied parameters were set:
Where Sum (K/S) is the sum of the color yield, TPC is the total phenol content, A is the dyeing duration, B is the dyeing temperature, C is the dyeing bath pH, and R2 is the correlation coefficient.
The quality of the developed model was evaluated based on the correlation coefficient value (R2). The R-squared values were equal to 0.76 and 0.74, respectively, for the sum of K/S and TPC. This means that both proposed models can predict with a good accuracy the sum (K/S) and the total phenol content.
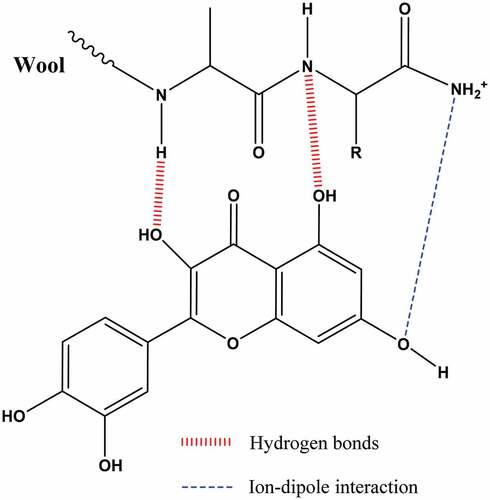
The main coloring species present in the dyeing bath was the polyphenolic compound. At pH 3 (pH<pHiso), the wool contains protonated amino groups. These groups promote hydrogen bonds and ion–dipole interactions with polyphenol hydroxyl groups () (Moussa et al. Citation2018).
Figure 1. Representation of the probable bonds between the wool sites and coloring compounds.
The extraction time effect on the total phenolic content and the sum (K/S)
The effects of the extraction time on the total phenolic content (TPC) and the sum (K/S) are shown in .
Figure 2. Main effects plot for sum (K/S) and TCP (mg/g).
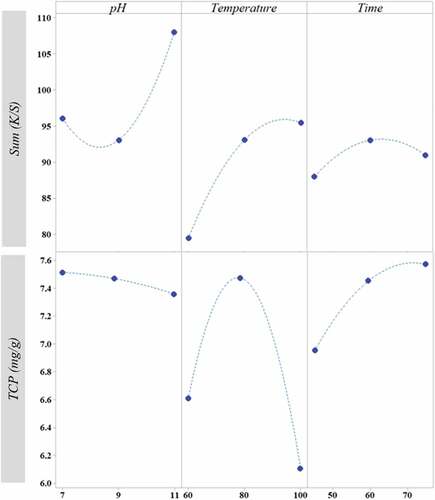
Firstly, it can be noticed that the color yield increases with the extraction time. It reaches its maximum value for an extraction time equal to 60 min. This can be explained by the higher contact time of the powder with the water that leads to the capture more coloring compounds by the solvent. But a further increase in time leads to a decrease in color yield (K/S) which can be due to the decomposition of coloring compounds. It is believed that a longer extraction time would result in a greater exposure to oxygen thus increasing the risk of oxidation of dyeing compounds (Mahfoudhi et al. Citation2015).
On the other hand, the maximum concentration of phenolic compounds was reached after an extraction time equal to 75 min.
The pH effect on the total phenolic content and the sum (K/S)
The color yield and total phenol content of the aqueous extracts obtained under different alkaline concentrations are shown in .
The alkaline concentration increased the color yield (K/S) which reached its maximum for a pH equal to 11. This can be explained by the fact that the phenolic groups contained in the extract reacted with alkali and formed more water-soluble salts. Thus, the increased ionization of phenolic groups in the basic medium caused the increase in the solubility of the color components. (Baaka et al. Citation2015; Uddin Citation2015)
On the other hand, as the sodium hydroxide concentration increased, the TCP decreases slightly. This is due to the reaction of phenolic groups (polyphenols and flavonoids) with bases. As a result, water-soluble salts were formed (Mahfoudhi et al. Citation2015).
The temperature effect on the total phenolic content and the sum (K/S)
The effect of the temperature on the phenol content and color yield is shown in . It can be noticed that the rise in temperature was accompanied with an increase in the phenol content. The TPC reached its maximum at 80°C and then it decreased to 6.1 mg/g. Increasing the extraction temperature from 60°C to 80°C favors the dissolution of the natural colorant. This phenomenon can be assigned to the better solubility of the dye components at higher temperatures. Indeed, heat decreases the viscosity of the solvent and turns the cell wall permeable, thus facilitating its penetration into the solid matrix (Chen, Sung, and Lin Citation2015; Haji and Rahimi Citation2020). The decrease in the phenol content for temperatures exceeding 80°C was due to the decomposition of phenolic compounds. As shown in , the color yield (K/S) became higher as the extraction temperature was increased.
Optimization of the extraction process
Contour plots analysis
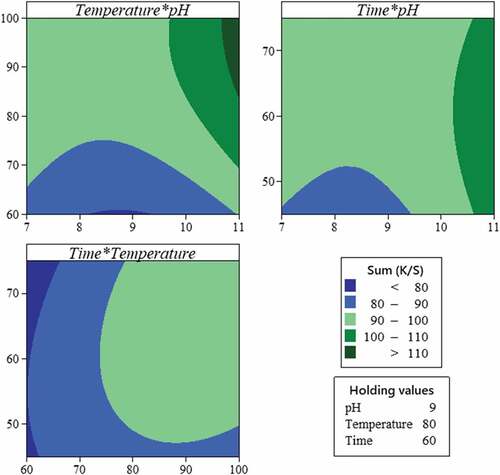
A contour plot, which is a graphical presentation of a three-dimensional response surface in terms of two independent variables, holding all other variables at a fixed level, helps to understand the main and the interaction effects of the studied factors on the analyzed response (Baaka, Mahfoudhi, and Mhenni Citation2018). Based on the set model, contour plots were generated. They can be used to establish ideal operating conditions and corresponding response values.
As shown in , the high color yield was obtained at the highest levels of pH and extraction temperature and time.
Figure 3. Contour plots for the effects of pH, extraction temperature, and extraction time on the sum of the color yield (K/S).
Response optimization
In this research, the goal of the optimization is to find conditions that maximize the color yield. The optimal values of the studied parameters were obtained by using the Minitab software. The optimal conditions were equal to 11, 100°C, and 65 min, respectively, for pH, temperature, and extraction time.
Characterization of aqueous extracts by UV-Visible spectroscopy
Thirteen aqueous extracts were analyzed by UV/Visible spectroscopy. The UV/Vis spectra were recorded for wavelengths ranging from 200 to 600 nm. The obtained spectra of the aqueous extracts are presented in .
Figure 4. UV–visible spectra of aqueous extracts.
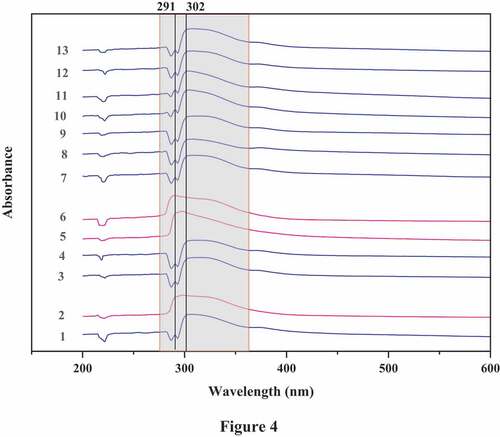
All the UV–vis spectra except number 2, 5, and 6 showed absorption in the 284–293 nm and 300–390 nm wavelength regions. On the other hand, the spectra numbers 2, 5, and 6 indicated adsorption peaks in 280–380 nm wavelength region. The absorption peaks in 284–293 nm wavelength region can be assigned to the electronic transition of benzene and its derivatives, which may contain many aromatic components such as phenols (Moussa et al. Citation2018). Absorption in the 300–390 nm region can be assigned to the presence of flavonoids in the extraction solution (Moussa et al. Citation2018).
FTIR investigation of extract, wool fabric, and dyed wool fabrics
The FTIR spectrum of the extract is presented in . The natural extract presents a large peak detected at 3306 cm−1, which is attributed to OH stretching bonds. Other peaks are shown at 2116 cm−1 (C=C stretching) and 1642 cm−1 (C=O stretching). Therefore, the FTIR of the aqueous extracts shows the presence of polyphenols in the extracts.
Figure 5. FTIR spectra of (a) aqueous extract and (b) undyed and dyed wool with the optimum colorant extract.
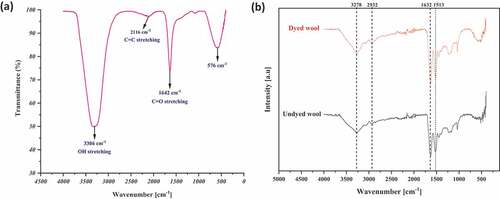
The FTIR spectra of undyed and dyed wool with the optimum colorant extract are shown in . The large peak in the region between 3540 and 3140 cm−1 is the result of the combined effect of N-H and -OH bonds stretching, and this peak is significantly broadened after dyeing. In addition, peaks at 1632 and 1513 cm−1, which show bending of N-H, are increased (Singh and Sheikh Citation2020). These effects further confirm the dyeing of wool due to the presence of polyphenols in the extract (Hosseinnezhad et al. Citation2020). These data are close to those reported in the literature (Popescu et al. Citation2021).
Conclusion
The solid waste generated by the geranium rosat hydrodistillation industry is considered a serious environmental problem. In this research, this solid waste was valorized by using its extract as a natural dye. Three main parameters related to the extraction process were studied. These parameters were the pH, the extraction temperature, and time. For the extraction pH, it varied according to three levels from 7 to 9. The temperature and time were also varied from 80°C to 100°C and 45 to 75 min, respectively. To evaluate the effects of these parameters on the extraction process efficiency, four responses were analyzed. These responses were the color strength (K/S) and the polyphenol, flavonoid, and condensed tannin contents (mg.g−1). The geranium rosat extracts were then used for dyeing wool samples. Based on the sum (K/S) of the different dye samples, a mathematical model was set to predict this response as a function of the extraction process parameters. The extraction process conditions were then optimized using the Minitab software. Optimum conditions were equal to 11, 100°C, and 65 min, respectively, for pH, extraction temperature, and extraction time. The sum (K/S) of the sample dyed with the optimum extract was equal to 115.15.
To conclude, in this paper the possibility of using the extract of pelargonium graveolens waste as a natural dye was investigated. The colorant extraction process parameters were varied, and the obtained extracts were used for dyeing wool samples. The extraction process was finally optimized in order to obtain the highest sum (K/S). The use of such a natural dye will not only help in the valorization of geranium graveolens waste resulting from the hydrodistillation industry but also in reducing colorant cost by the substitution of high-cost synthetic dye by a natural one.
Highlights
The solid waste hydrodistillation of Pelargonium graveolens L’Hér. was utilized for dyeing wool fabrics with attractive color yield values.
The dyed fabrics showed shades between brown and beige.
The definitive screening design was used to study the effects of extraction parameters (pH, extraction time, and extraction temperature) and to optimize the dye extraction process.
Disclosure statement
No potential conflict of interest was reported by the authors.
References
- Adeel, S., M. Habiba, S. Kiran, S. Iqbal, S. Abrar, and C. -M. Hassan. 2022. Utilization of colored extracts for the formulation of ecological friendly plant-based green products. Sustainability 14 (18):11758. doi:10.3390/SU141811758.
- Adeel, S., S. Kiran, N. Habib, A. Hassan, S. Kamal, M. -A. Qayyum, and K. Tariq. 2019. Sustainable ultrasonic dyeing of wool using coconut coir extract. Textile Research Journal 90 (7–8):744–12. doi:10.1177/0040517519878795.
- Adeel, S., F. Ur Rehman, A. Hameed, N. Habib, S. Kiran, K. -M. Zia, and M. Zuber. 2018. Sustainable extraction and dyeing of microwave-treated silk fabric using Arjun bark colorant. Journal of Natural Fibers 17 (5):745–58. doi:10.1080/15440478.2018.1534182.
- Al-Mijalli, S. -H., H. -N. Mrabti, H. Assaggaf, A. -A. Attar, M. Hamed, A. -E. -L. Baaboua, N. El Omari, N. El Menyiy, Z. Hazzoumi, R. -A. Sheikh, et al. 2022. Chemical profiling and biological activities of pelargonium graveolens essential oils at three different phenological stages. Plants 11 (17):2226. doi:10.3390/plants11172226.
- Baaka, N., M. Ben Ticha, W. Haddar, S. Hammami, and M. -F. Mhenni. 2015. Extraction of natural dye from waste wine industry: Optimization survey based on a central composite design method. Fibers and Polymers 16 (1):38–45. doi:10.1007/S12221-015-0038-5.
- Baaka, N., A. Mahfoudhi, and M. -F. Mhenni. 2018. Tannin-rich natural dye extracted from kermes oak (Quercus coccifera L.): Process optimization using response surface methodology (RSM). Journal of Natural Fibers 16 (8):1209–20. doi:10.1080/15440478.2018.1458685.
- Batool, F., N. Iqbal, and S. Adeel. 2022. Natural dye yielding potential and compounds of selected vegetable residues belonging to Brassicaceae: An approach towards sustainability. Pakistan Journal of Botany 54 (1):329–36. doi:10.30848/PJB2022-1(39).
- Ben ElHadj Ali, I., F. Tajini, A. Boulila, M. -A. Jebri, M. Boussaid, C. Messaoud, and H. Sebaï. 2020. Bioactive compounds from Tunisian Pelargonium graveolens (L’hér.) essential oils and extracts: α-amylase and acetylcholinesterase inhibitory and antioxidant, antibacterial and phytotoxic activities. Industrial Crops and Products 158:112951. doi:10.1016/J.INDCROP.2020.112951.
- Chen, Y. -L., J. -M. Sung, and S. -D. Lin. 2015. Effect of extraction methods on the active compounds and antioxidant properties of ethanolic extracts of Echinacea purpurea flower. American Journal of Plant Sciences 06 (01):201–12. doi:10.4236/AJPS.2015.61023.
- Dhouibi, N., M. Ben Ticha, H. Raddaoui, C. Boudokhane, and H. Dhaouadi. 2021. Valorization and reuse of Centaurea Kroumeriensis hydrodistillation effluent: a sustainable phytodyeing process for wool fabrics. Fibers and Polymers 22 (8):2238–50. doi:10.1007/S12221-021-0727-1.
- Ennaifer, M., T. Bouzaiene, M. Chouaibi, and M. Hamdi. 2018. Pelargonium graveolens aqueous decoction: a new water-soluble polysaccharide and antioxidant-rich extract. BioMed Research International 2018:1–11. doi:10.1155/2018/2691513.
- Gharred, N., N. Baaka, N. Bettache, A. Hamdi, A. Dbeibia, H. Dhaouadi, A. Morere, C. Menut, and S. Dridi-Dhaouadi. 2021. Wastewater to ecological dyeing process and bioactive compounds resources: case study of Dittrichia graveolens hydrodistillation aqueous residue. Waste and Biomass Valorization 12 (9):5065–77. doi:10.1007/S12649-021-01375-4.
- Haji, A., and M. Naebe. 2020. Cleaner dyeing of textiles using plasma treatment and natural dyes: A review. Journal of Cleaner Production 265:121866. doi:10.1016/J.JCLEPRO.2020.121866.
- Haji, A., and M. Rahimi. 2020. RSM Optimization of wool dyeing with Berberis Thunbergii DC leaves as a new source of natural dye. Journal of Natural Fibers 19 (8):2785–98. doi:10.1080/15440478.2020.1821293.
- Hamidpour, R., S. Hamidpour, M. Hamidpour, V. Marshall, and R. Hamidpour. 2017. Pelargonium graveolens (Rose Geranium) - a novel therapeutic agent for antibacterial, antioxidant, antifungal and diabetics. Archives in Cancer Research 05 (01). doi:10.21767/2254-6081.1000134.
- Haque, M. A., R. Mia, S. T. Mahmud, M. A. Bakar, T. Ahmed, M. S. Farsee, and M. I. Hossain. 2022. Sustainable dyeing and functionalization of wool fabrics with black rice extract. Resources, Environment and Sustainability 7:100045. doi: 10.1016/J.RESENV.2021.100045.
- Hosseinnezhad, M., K. Gharanjig, S. Adeel, S. Rouhani, H. Imani, and N. Razani. 2022. The effect of ultrasound on environmentally extraction and dyeing of wool yarns. Journal of Engineered Fibers and Fabrics 17:155892502211044. doi:10.1177/15589250221104471/FORMAT/EPUB.
- Hosseinnezhad, M., K. Gharanjig, H. Imani, and N. Razani. 2020. Green dyeing of wool yarns with yellow and black myrobalan extract as bio-mordant with natural dyes. Journal of Natural Fibers 19 (10):3893–915. doi:10.1080/15440478.2020.1848735.
- Ibrahimi, H., and A. Hajdari. 2020. Phenolic and flavonoid content, and antioxidant activity of honey from Kosovo. Journal of Apicultural Research 59 (4):452–57. doi:10.1080/00218839.2020.1714194.
- Julkunen-Tiitto, R. 2002. Phenolic constituents in the leaves of northern willows: Methods for the analysis of certain phenolics. Journal of Agricultural and Food Chemistry 33 (2):213–17. doi:10.1021/JF00062A013.
- Mahfoudhi, A., N. Baaka, W. Haddar, M. F. Mhenni, and Z. Mighri. 2015. Development and optimization of the extraction process of natural dye from Tamarix aphylla (L.) Karst. Leaves using response surface methodology (RSM). Fibers and Polymers 16 (7):1487–96. doi:10.1007/S12221-015-4772-5.
- Moussa, I., N. Baaka, R. Khiari, A. Moussa, G. Mortha, and M. F. Mhenni. 2018. Application of Prunus amygdalus by-products in eco-friendly dyeing of textile fabrics. Journal of Renewable Materials 6 (1):55–67. doi:10.7569/JRM.2017.634141.
- Mustafa, N., M. MansoorAsghar, R. Mustafa, Z. Ahmed, H. Rjoub, and R. Alvarado. 2022. The nexus between environmental strategy and environmental performance: analyzing the roles of green product innovation and mechanistic/organic organizational structure. Environmental Science and Pollution Research. doi: 10.1007/S11356-022-22489-9.
- Pandey, P., R. -K. Upadhyay, V. Singh, R. Padalia, R. Kumar, K. -T. Venkatesha, A. -K. Tiwari, S. Singh, and S. Tewari. 2020. Pelargonium graveolens L. (Rose-scented geranium): New hope for doubling Indian farmers’ income. Environment Conservation Journal 21 (1&2):141–46. doi:10.36953/ECJ.2020.211217.
- Popescu, V., A. C. Blaga, M. Pruneanu, I. N. Cristian, M. Pîslaru, A. Popescu, V. Rotaru, I. Crețescu, and D. Cașcaval. 2021. Green chemistry in the extraction of natural dyes from colored food waste, for dyeing protein textile materials. Polymers 13 (22):3867. doi:10.3390/POLYM13223867.
- Riahi, L., H. Cherif, S. Miladi, M. Neifar, B. Bejaoui, H. Chouchane, A. S. Masmoudi, and A. Cherif. 2020. Use of plant growth promoting bacteria as an efficient biotechnological tool to enhance the biomass and secondary metabolites production of the industrial crop Pelargonium graveolens L’Hér. under semi-controlled conditions. Industrial Crops and Products 154:112721. doi:10.1016/J.INDCROP.2020.112721.
- Singh, A., and J. Sheikh. 2020. Cleaner functional dyeing of wool using Kigelia Africana natural dye and Terminalia chebula bio-mordant. Sustainable Chemistry and Pharmacy 17:100286. doi:10.1016/J.SCP.2020.100286.
- Thi Thu Ha, P., N. Thi Bao Tran, N. Thi Ngoc Tram, and V. Hoang Kha. 2020. Total phenolic, total flavonoid contents and antioxidant potential of Common Bean (Phaseolus vulgaris L.) in Vietnam. AIMS Agriculture and Food 5 (4):635–48. doi:10.3934/agrfood.2020.4.635.
- Uddin, M. G. 2015. Extraction of eco-friendly natural dyes from mango leaves and their application on silk fabric. Textiles and Clothing Sustainability 1 (1):7. doi:10.1186/s40689-015-0007-9.
- Ur-Rehman, F., S. Adeel, S. Liaqat, M. Hussaan, M. Roni, A. Bulbul, and W. Haddar. 2022. Environmental friendly bio-dyeing of silk using Alkanna tinctoria based Alkannin natural dye. Industrial Crops and Products 186:115301. doi:10.1016/J.INDCROP.2022.115301.