
 ?Mathematical formulae have been encoded as MathML and are displayed in this HTML version using MathJax in order to improve their display. Uncheck the box to turn MathJax off. This feature requires Javascript. Click on a formula to zoom.
ABSTRACT
Since cement manufacturing contributes significantly to CO2 pollution worldwide, biochar provides a novel opportunity to integrate it into the construction materials and eventually substitute a portion of cement usage. Consequently, this investigation aims to explore the response surface methodology (RSM) to predict compressive strength and identify optimal values for each parameter that affects the preparation of bio-mortars cement with biochar produced from Washingtonia filifera waste pyrolysis (WFWB). The status of the 7-days and 28-days samples compressive strength, porosity, as well as thermal conductivity of the bio-mortars produced by partially substituting cement at different rates (0%, 1%, 2%, 3%, 4%, and 5%) with pyrolyzed WFWB biochar at varying temperatures (300°C, 400°C, and 500°C) were examined experimentally and statistically. Moreover, the parameter effect on the experimental data performance was identified through analysis of variance (ANOVA). Results indicated an increase in the compressive strength at 28 days of almost 12%, 3%, and 2% at an optimum biochar content of 1% for the WFWB500, WFWB400 and WFWB300 samples respectively. In addition, the findings confer the feasibility of producing bio-mortars with a compressive strength of 63.81 MPa at 28 days with a 1% replacement rate of WFWB500 and coefficient of thermal conductivity of 0.52 W/m.K.
摘要
由于水泥制造在全球范围内对二氧化碳污染做出了重大贡献,生物炭提供了一个新的机会,将其整合到建筑材料中,并最终替代部分水泥使用. 因此,本研究旨在探索响应面方法(RSM),以预测抗压强度,并确定影响用来自华盛顿州丝状菌废弃物热解(WFWB)的生物炭制备生物砂浆水泥的每个参数的最佳值. 在不同温度(300°C、400°C和500°C)下,用热解WFWB生物炭以不同比例(0%、1%、2%、3%、4%和5%)部分替代水泥,对7天和28天样品的抗压强度、孔隙率以及生物砂浆的导热性进行了实验和统计检验. 此外,通过方差分析(ANOVA)确定了参数对实验数据性能的影响. 结果表明,WFWB500、WFWB400和WFWB300样品在最佳生物炭含量为1%时,28天抗压强度分别增加了12%、3%和2%. 此外,研究结果证明了生产28天抗压强度为63.81 MPa、WFWB500替代率为1%、导热系数为0.52 W/m.K的生物砂浆的可行性.
1. Introduction
To attenuate CO2 emissions on the planet, the incorporation of waste into the construction materials is being globally encouraged. Various alternatives were mentioned in the literature, like the incorporation of biomass waste (Shi et al. Citation2019) and ash (Onorevoli et al. Citation2018), to replace cement in mortars and concretes to develop new materials. Considerable research has discussed the sustainability issues relating to cementitious materials due to its biomass degradation of alkaline nature (Boumaaza, Belaadi, and Bourchak Citation2022b). The introduction of biochar to building materials enables carbon sequestration and its enclosure inside the structure for decades. Indeed, biochar can mitigate more than 870 kg of CO2 equivalent per ton of dry biomass greenhouse gases (Woolf et al. Citation2010). The biggest advantage of biochar over other bio-based waste products is its generation technique (pyrolysis). This eliminates the emissions from the combustion process, while contributing to waste elimination (Gupta, Kua, and Low Citation2018). Biochar emerged as a building material, and its utilization as a cement addition/substitute in building materials is currently under development (Maljaee et al. Citation2021).
However, since biochar has several different raw materials, the conditions and types of biomass preparation are the most significant factors that influence the performance of biochar/cement composites. Numerous investigations have indicated an increase in the compressive strength after the incorporation of biochar into cementitious mortars. Gupta et al. utilized biochar from wood waste and food residues such as rice as a carbon retention admixture in cementitious mortars and achieved the same mechanical strengths as the baseline mortar with 1–2 wt% addition of biochar (Gupta, Kua, and Koh Citation2018). They also noticed an improvement in compressive strength by more than 20%. (Akhtar and Sarmah Citation2018) explored the biochar influence on composite mechanical properties by replacing a fraction of the cement by 1% of its volume for various biochar types using rice husk, litter from poultry, and paper wastes. The compressive strength was found to be similar to the baseline material by substituting 0.1 wt% of total mixture with biochar from paper mill sludge. A study by (Ahmad et al. Citation2015) utilized pyrolyzed bamboo fibers as a reinforcement in cement mortars. It was observed that a minor contribution of 0.08 wt% bamboo biochar improved the compressive strength and mortar matrix toughness. Similarly, Zeidabadi et al. substituted a proportion of cement with rice husk and bagasse biochar (Zeidabadi et al. Citation2018). They found an improvement of more than 22% and 50% of compressive strength over the concrete baseline for the mix with 10% and 5% by weigth biochar replacement, respectively.
However, flexural strength, tensile strength, and compressive strength depend on input factors such as biochar type, biochar density, pyrolysis temperature, water-cement ratio, etc., which require several sample tests, resources, and time. RSM are highly recognized regression modeling approaches that are capable of providing better prediction of process quality due to their precision and varied use in the engineering field as described by (Boumaaza, Belaadi, and Bourchak Citation2021) and (Tayebi and Nematzadeh Citation2021). Lately, RSM had been widely used in the field of construction materials to predict their mechanical properties (Li, Lu, and Gao Citation2020; Sultana et al. Citation2020) with many studies being performed in the field of recycled concrete. RSM conceptions utilize a minimum experimental trial number, assess concrete characteristics with reasonable accuracy, and offer high performance when optimizing the input parameters as described in the results by (Benzannache et al. Citation2021) and (Belaadi et al. Citation2020). It has been noticed that there is a lack of work in the field of biochar application in WFWB cementitious mortars. Subsequently, the novelty and originality of this study lies in the prediction of bio-mortar properties in the form of porosity, water absorption, thermal conductivity, and compressive strength on the 7th and 28th day of a novel bio-mortar by approach RSM. This investigation will examine the influence of two main variables, the pyrolysis temperature of biochar and mass of substituted cement, in relation to the total volume of cement bio-mortars by partial cement substitution and their optimization, to overcome this knowledge gap. An experimental investigation was conducted to evaluate the bio-mortar properties to develop the predictive models and produce the ideal mix design that are still unknown among biochar-based cement mortars. The RSM models developed will be examined using several pertinent performance parameters such as the determination coefficient (R2), root mean square error (RMSE), mean absolute deviation (MAD) and mean absolute percentage error (MAPE).
2. Research significance
A large variety of waste materials is available and encourage in the construction industry. The utilization of biomass waste in the construction industry has the potential to provide a good alternative to naturally occurring aggregates in concrete and mortar. Many researchers studied the development of biochar applications resulting from biomass pyrolysis and its potential usage to minimize the carbon footprint of cement-based building materials. Therefore, this study is to examine the response surface methodology (RSM) to predict the compressive strength, porosity, and thermal conductivity of bio-mortars by substituting partially cement at various ratios (0%, 1%, 2%, 3%, 4%, and 5%) with biochar produced from the pyrolysis of Washingtonia filifera (WFWB) waste at different temperatures (300°C, 400°C, and 500°C). Thus, the importance of this paper is to determine the influence of biochar rate as well as its pyrolysis temperature on the compressive strength, porosity, as well as thermal conductivity of the produced bio-mortars in order to identify the optimal values for each parameter affecting the bio-mortars preparation. In addition, predictive empirical equations are generated to predict the compressive strength, porosity, and thermal conductivity of the bio-mortars for different biochar contents and temperatures.
3. Materials and methods
3.1. Cement, sand and biochar preparation
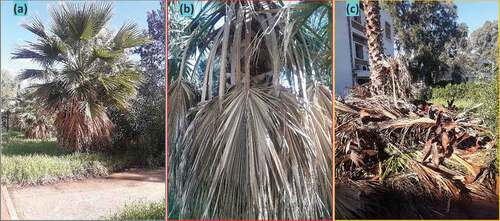
WF palm is now a real ornamental tree in rural and urban areas of Algeria. Due to its continued maintenance annual growth, it generates large volumes of agricultural residues valued between 10,000 and 12,000 tons per year, capable of producing great potential as an economic material in industrial applications as a renewable source (). The rachis wastes of WF locally collected in east Algeria in the region of Guelma, is obtained by removing the WF palm leaves (). This waste is then reduced to lengths of 30 to 50 cm and used as biomass for the production of biochar. They were then pyrolyzed in an oven for 30 min in the range of 300°C up to 500°C. The biochar was crushed in grinder to obtain finer particles and subsequently placed in a hermetic tank to be chilled to provide bio-mortar. The locally acquired CEM II/A-S 42.5N type cement from an Algerian factory and in accordance with ASTM C150 was utilized in all bio-mortars. For the mortar production, it was used with natural sand obtained from an Algerian company’s quarry, National Society of Aggregates, having a size of 4 mm maximum in accordance with ASTM C33. Biochar grains have a size lower as compared to sand to cement, which indicates these biochar particles provide bonding filler for larger ones.
Figure 1. (a) Washingtonia filifera tree (b) dead palm leafs rachis and (c) rachis waste.
3.2. Experimental conception according to RSM technique
RSM statistical analysis method is very efficient prediction for assessing independent variables influence on responses within limited number of tests as described in the results by (Kursuncu et al. Citation2022) and (Boumaaza, Belaadi, and Bourchak Citation2022a). This method is mainly applied if many input variables are influencing the output (response). An orthogonal experimental design using a central composite design (CCD) with two independent variables was chosen to treat the different data using RSM trials using Design Expert 13 software on bio-mortars where cement was replaced partially by WFWB biochar. The actual and coded variable levels are shown in . The variable levels considered were five levels of biochar content (0%, 1%, 2%, 3%, 4% and 5%) and three levels of pyrolysis temperature (0°C, 300°C to 500°C). After codes are identified and test plan obtained, the tests were conducted, and responses were registered to provide the relations of these variables with the obtained results. The CCD plan was composed of 4 axial (factorial) and 4 cubic points having 8 repetitions in the central locations, which establish an experiment number of 16 carried out based on the two adopted variables: biochar content and pyrolysis temperature with their level during the trials according to (EquationEquation 1(1)
(1) ).
Table 1. Configuration of selected parameters and levels for testing.
with p indicates the number of variables, 2p denotes the factorial points, 2p represents the axial points, and r denotes remaining tests in the points center.
RSM objective was to perform models regression based on independent variables correlations and their levels predicting output responses as described by (Nematzadeh, Maghferat, and Herozi Citation2021) and (Dashti and Nematzadeh Citation2020). These regression models are predicated on the basis of second-order polynomial (Eq. 2).
where Y represents the response (the compressive strength or porosity), where B0 is the constant parameter, and Bi, Bii, and Bij denote linear coefficients, quadratic factors and linear interaction, respectively (Hammoudi et al. Citation2019).
indicates variables and levels specifically the temperature (B) and WFWB biochar wt% (A) utilized to develop experimental design. Variable levels involved in design of experiments (DOE) are denoted as (−1) and (+1) codes, i.e., the lowest and highest values attributed to the factors centered at a mean level (0). In order to perform this research, 16 experiments were conducted depending on variables levels of testing ().
Table 2. 7 and 28 days compressive strength, porosity, capillary water absorption and thermal conductivity of bio-mortars prepared with biochar at different temperatures.
3.3. Bio-mortars production
Bio-mortars composed of a mixture with sand and partly substituted cement with WFWB biochar being manufactured according to the experimental plan. A mechanical mixer meeting the recommendations of ASTM C305 was used to mix the mortar samples. A total of 16 series of experiments were performed. The bio-mortar mixes were placed in cylindrical molds with sizes of 50 by 50 mm to obtain samples for compressive strength testing. All samples cast, were subsequently removed from the mold after 24 h and conserved at ambient temperature (23 ± 2°C). Cement, sand and water proportions used for the bio-mortars mix were of 1:3:0.5.
3.4. Determination of biochar reinforced bio-mortar properties
3.4.1. The capillary water uptake measure
Cementitious mortar water uptake was determined at 28 days according to the capillary water uptake test, as defined in ASTM C1585. To determine the rate of water absorption in cement mortars, three specimens were studied with a 50 ± 3% humidity and 23 ± 1°C air temperature for each mortar type. The specimens were regularly taken out of the water to measure their water retention at different intervals. The specimens were desiccated at 90°C for 48 h and to cool at ambient conditions for 5 h before initial mass determination. The samples were subsequently weighed at 5 min, 10 min, 30 min, 1 h, 24 h, 48 h, 72 h, 96 h, 120 h, 144 h, 168 h and 192 h (Tan et al. Citation2020). The % water absorption in the reference mortar and the biochar containing mortars was measured at selected time periods up to completely saturated. Water uptake is calculated by the formula Eq 3. Where Mdry is the oven dry mass after 48 h (g); Msat stands for mass saturated after specimen immersion (g).
3.4.2. Porosity measurement
Porosity is important for all granular mixes and for all applications involving granular materials. The hydrostatic balance was used to evaluate the water available (porosity), conforming to the NF AFNOR 2010. Porosity was determined using the hypothesis that the specimen pores would be completely saturated during the immersion period with water (Zhang et al. Citation2023). Thus, the mass loss caused by oven curing would be a measure of pore space filled with water. The porosity P was determined using the mass of the samples taken in water, Mwater, in saturated air, Mair, and oven-dried at 90°C, Mdry, according to the following equation:
3.4.3. Thermal conductivity
The thermal conductivity represents a significant parameter indicating the capacity of a construction material to provide thermal conductivity. As the material is more thermally insulating, the factor λ will be lower. For this purpose, various samples of bio-mortar were tested for their thermal conductivity with a thermo-test apparatus using ASTM D5930 standard procedure. After curing for 28 days, the thermal conductivity λ (W/m.K) was measured for all three prismatic sizes (40 × 40 × 160) mm3 for each specimen performed. The thermal conductivity could be determined using the average value:
Where Q (W) is the heating power of the heating unit; d (m) is the width of the specimen; A (m2) is the effective heat transfer area, T1 and T2 (K) are the temperatures of the heating unit and cooling unit, respectively.
3.4.4. Compressive test
Compression tests were conducted after a curing period of 7 and 28 days with a universal Servo Electric testing machine Zwick/Roell Z005 having a 5 kN load cell at 2 mm/min displacement speed according to ASTM C109. A computer enabling data transmission with test Xpert V10.11 software monitored the machine. The compressive strength at 7 and 28 day was determined for three samples investigated in each mixture.
4. Statistical and experimental analysis results
4.1. WFWB biochar effect on compressive strength
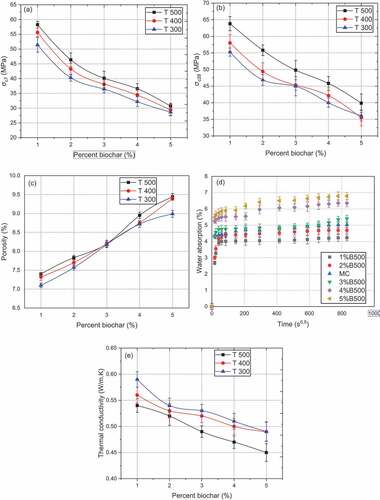
The test results of compressive strength at 7 and 28 days after substituting cement with WFWB300, WFWB400, and WFWB500 are shown in and . As a result, all the findings showed adequate coherence. During the first days of curing, a typical variation in the compressive strength of the cement mortars incorporated with biochar was observed as the biochar content increased. Replacing cement partially with biochar caused a decrease in 7- and 28-day compressive strength, excluding the 1% by weight addition of biochar. Replacing cement with 2% WFWB500 resulted in a 2% and 1% decrease in 7-day and 28-day compressive strength, respectively. However, the compressive strength of 1% of added WFWB500 was found to be 58.25 MPa and 63.81 MPa, which is 23% and 13% greater than the baseline specimen with 47.24 and 56.35 MPa at the 7th and 28th days, respectively. On the other hand, the addition of 1% of WFWB400 and WFWB300 caused an increase in compressive strength of 18% and 9%, respectively, on the 7th day and 3% and 2%, respectively, on the 28th day, compared to bio-mortar without biochar. However, adding 3, 4, and 5% of WFWB500 led to a decrease in resistance of 1%, 11%, and 18%, respectively, at 28 days. In addition, an identical tendency is noticed where the addition of 2%, 3%, 4% and 5% of WFWB400 and WFWB300 decreased the compressive strength. When the percentage of WFWB is higher than 2%, the decrease in compressive strength of WFWB300 was found to be significantly greater, compared to WFWB400 and WFWB500, owing to the greater hydrophilicity and storage capacity of WFWB, which is produced at a pyrolysis temperature of 300°C. For proportions above 2%, WFWB particles in the bio-mortars attract water, which inhibits hydration and decreases the compressive strength of bio-mortars with WFWB. The results of this research corroborate with other investigations where the inclusion of biochar in smaller substitution levels resulted in increased compressive strength (Praneeth et al. Citation2021; Sirico et al. Citation2021). As such, Gupta et al. (Gupta, Kua, and Pang Citation2018), observed that 1 and 2 wt% addition of biochar pyrolyzed by 500°C and 300°C resulted in an improved compressive strength of (14%, 10%) and (7%, 3%), respectively, in comparison to the base mortar. In fact, the compressive strength increased up to 1% substitution of cement with biochar and decreased for the other percentages for all specimens. The compressive strength increased less for WFWB400 and WFWB300 than for WFWB500 and this for 1% of WFWB. An analogous result is reported by (Tan et al. Citation2020), 1% pyrolyzed biochar content at 500°C gave a compressive strength of about 52 MPa, which was 20% higher than the baseline mortar. Nevertheless, the mortar with higher biochar content (5% and 10% by weight) showed a reduced compressive strength. However in the study conducted by the authors recently on the prediction of bending properties of bio-mortar produced by partially substituting cement with the same WFRB (Boumaaza et al. Citation2022). It was also observed that a partial cement replacement of 1% WFRB pyrolysis at 500°C, exhibited improvements in flexural modulus, flexural strength, and displacement of 265%, 5%, and 20%, respectively, over the control mortar.
Figure 2. Experimental values of (a) 7 days, (b) 28 days compressive strength, (c) porosity, (d) capillary water absorption and (e) thermal conductivity of bio mortars versus wt % biochar pyrolyzed in the range of 300°C, 400°C and 500°C.
4.2. Biochar inclusion influence on porosity, capillary water absorption and thermal conductivity
Water accessible porosities results are reported in . Accordingly, the 1% and 2% cement substitutes with WFWB500, WFWB400, and WFWB300 biochar produced porosity values of (7.40%, 7.32% and 7.10%) and (7.83%, 7.70% and 7.57%), respectively, lower than the baseline bio-mortar porosity of 7.85%. Indeed, a very small decrease in porosity for 2% WFWB500 content. Increases of 5%, 14%, and 20% were obtained for bio-mortars formulated with 3%, 4%, and 5% substitution of cement with WFWB500 biochar, respectively (). The decrease in porosity with 1% and 2% of cement weight substitution by WFWB biochar is associated to the reduced water uptake capacity. In addition to the bio-mortar blend, the biochar soaked up and maintained some of the curing water, thus causing the quantity of loose water contained in the wet mixture to decrease. The increased porosity of bio-mortar with 3%, 4% and 5% biochar is due to a high proportion of porous biochar particles that impacts the consistency of mortar, thus leading to more voids in cured mortars (Achour, Ghomari, and Belayachi Citation2017). Analogous findings were reported by (Maljaee et al. Citation2021) where a partial cement substitute with 1–4 wt% biochar resulted in increased porosity of the cement mortars because of its pores present in its texture. In addition, Gupta et al. (Gupta, Kua, and Pang Citation2018) noticed lower fluidity in mixtures with high content 5–8 wt% biochar in the composition of mortars, impacted mortar compactness, leading also to higher porosity in the cured mortar. The reported findings corroborated with those observed by Gupta et al. (Gupta and Kua Citation2018), where the biochar produced at 500°C displayed more closely intersecting pores of uniform form over the biochar at 300°C, which ascribed to fuller liberation of volatiles and organics at an increased pyrolysis temperature. The compressive strength plotted against porosity was illustrated in where there is a clear reduction in the compressive strength as porosity increased.
Figure 3. (a) Compressive strength 28-days (b) capillary water absorption and (c) thermal conductivity according to porosity of the bio-mortars.
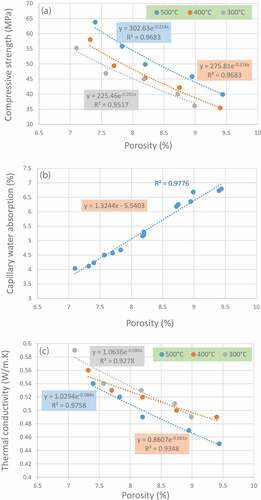
The experiment was performed over a period of 8 days for samples dated 28 days. The profile of capillary uptake of water in bio-mortars containing 1–5% WFWB prepared at 500°C (p-values are less than 0.05 at 95% confidence interval) is illustrated in . A linear regression of the slope of water uptake, which occurred for the initial 6-hours -period of testing (), can be used to obtain the primary level of uptake. The subsequent process of water uptake corresponds to the secondary level of water uptake, where water seals the minor voids in the specimen continuously to saturation (1 to 8 days). The findings revealed that the water uptake was reduced in the samples containing 1–2 wt% WFWB500 compared to the control mortar, while for 3%, the absorption was similar to the control. This decrease can be explained by the hydrophilicity of WFWB, which causes an increased friction with the capillary wall inside the mortar, thus leading to the decreased capillary water uptake rate. However, increasing the WFWB500% by 4% and 5% by weight increased the capillary water absorption by 26% and 35%, respectively. This result was in agreement with Tan et al. (Tan et al. Citation2020), who stated that higher water uptake with increased content of WFWB in the bio-mortar was likely caused by the increasing void ratio in the mortar. A similar tendency was observed in the capillary water uptake results for WFWB400 and WFWB300, which indicates that the capillary water uptake increased with an increase in the WFWB inclusion rates, but reduced in specimens with 1 wt% and 2 wt% WFWB. These findings correlated well with the porosity measurements of the mortar that contained 1–5% WFWB as shown in .
The variation of thermal conductivity with biochar content is shown in . The findings indicated a decrease in thermal conductivity as the biochar content increased. Nevertheless, the thermal conductivity of bio-mortars with 1–5% biochar pyrolyzed to 500°C, 400°C and 300°C reduced by 22–35%, 19–29% and 15–41%, respectively, compared to the reference mortar. This demonstrates the significant effect of biochar content on thermal conductivity. These results were obtained due to the increased porosity of cured bio-mortars caused by the elevated biochar water uptake ability, which results in a swell ability on contact with water, thus resulting in the reduced thermal conductivity of the bio-mortar. This results corroborated with literature reports (Tan et al. Citation2020). depicted the thermal conductivity data variation according to the porosity. A slight reduction in thermal conductivity was observed as the biochar pyrolysis temperature increased. Thermal conductivity of WFWB500-reinforced bio-mortars for 1% and 5% content was about 8% and 7% lower than that for the WFWB300 alternative, respectively. The results agreed with those observed in literature (Tan et al. Citation2020).
4.3. Conception of mathematical model
This research was conducted in accordance with CCD to obtain the influence of different parameters to predict the 7-day and 28-day compressive strength, porosity, and thermal conductivity of the bio-mortar mix for various factor values. The quadratic models satisfy the choice conditions identified before, as they show the highest coefficients in terms of correlation, predicted R2 and adjusted R2 (). Moreover, the linear and 2FI models were also inappropriate based on their considerably small correlation coefficients. On the other hand, the cubical model was dismissed due to the imprecision in adjusting the plots. To determine significance and relationship of the variables according to each individual response model, an analysis of variance (ANOVA) was performed (). For CCD design, the model fitting process is performed iteratively to obtain a precise model for the response. Initially, for estimating the variable-response dependence using experimental data, a quadratic model (EquationEquation (5)(5)
(5) to (Equation8
(8)
(8) )) is adopted. It is then monitored by eliminating irrelevant terms in the model using statistical analysis. The results obtained from the ANOVA analysis indicated an adequate description in the equations of the relationship between the independent factors and the responses. Additionally, correlation coefficients and P-values of the acquired model were discussed.
Table 3. ANOVA of quadratic model for bio-mortar/biochar compressive strength at 7 and 28 days, porosity and thermal conductivity.
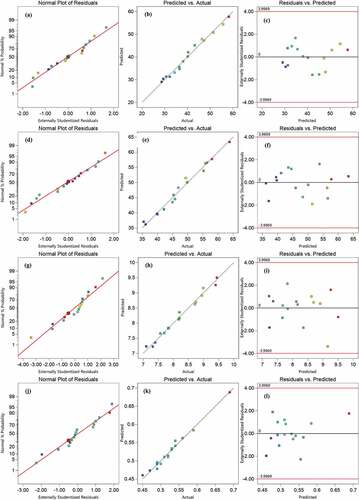
The model F-values for 7-day and 28-day compressive strength, porosity and thermal conductivity models were 125.12, 166.35, 158.11 and 250.94 respectively, thus indicating the excellent significance of these models obtained by ANOVA analysis. Furthermore, the p values (<0.0001) were considerably less than 0.05 and validate the significance model terms. While the terms A, B, AB, and A2 were considered significant for the compressive strength on the 7th and 28th day, the terms A, B, and B2 were considered important for porosity and thermal conductivity in the current models. The discrepancy in the R2 predicted and R2 adjusted values was found to be less than 0.2 in all models and the accuracy values (good accuracy) that assess signal-to-noise values, which were 33.22, 40.42, 36.98, and 62.02 for the 7-day and 28-day compressive strength, porosity, and thermal conductivity models, respectively, were greater than 4. These values indicate an appropriate signal, and allow the utilization of these models to investigate the conceptual field. Additionally, it is important to validate the fitting and accuracy of the quadratic models of biochar-based bio-mortars using diagnostic graphs to the experimental values. shows the precision and pertinence of the models through plotting. The experimental data distribution was estimated with the normal probability approach which is commonly employed to evaluate the distribution of the data using a normal probability plot. All data was noticeably distributed approximately normally, as illustrated in because the data, which was visualized using the graph, was plotted and dispersed along a right straight. The comparison of the predicted and actual values reveals a right line distribution of the points to the diagonal, and thus indicates the perfect relevance of the model-predicted values (). The residuals plot showed a clustering of values aligned on a straight line, which indicated an error of normal distribution. In addition, in order to assess the precision of the predicted equations, residual analysis was investigated. The residual scattering, as suggested by (Aziminezhad, Mahdikhani, and Memarpour Citation2018), did not contain the undesired distribution modes, especially the important residuals. Following which, in a subsequent process, the accuracy of the model was evaluated through residual testing such as residual graphs and residual standard error, where the adequacy of the chosen model is graphically judged. The residual in the current model was small and evenly scattered over the entire data range, thus showing no errors in the data as observed in ().
Figure 4. Normal probability versus residuals, Actual versus predicted and Residuals versus predicted plots of (a-c) 7 days compressive strength, (d-f) 28 days compressive strength, (g-i) porosity and (j-l) thermal conductivity bio-mortars data.
4.4. Principal effects and response surface curves of bio-mortars
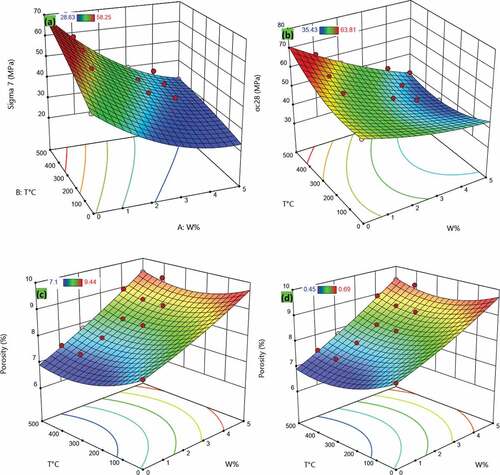
After the compressive strength, the porosity and thermal conductivity models were validated, the main effects and results of response surface curves were examined. illustrated the main effects of content WFWB and the pyrolysis temperature biochar on the compressive strength at 7 and 28 days, porosity and thermal conductivity of bio-mortars. showed that the compressive strength increases until the pyrolysis temperature reached 500°C and decreased when the percentage content WFWB increased. Furthermore, showed that increasing the pyrolysis temperature slightly decreased the porosity and thermal conductivity, however, the higher WFWB content, made the porosity increased, but the thermal conductivity decreased, confirming further the experimental results. show the responses surface and 3D curves for the interaction of the two factors pyrolysis temperature and WFWB on compressive strength at 7 and 28 days, porosity and thermal conductivity. It can be noticed that the compressive strength increased with increasing pyrolysis temperature and that increasing the WFWB content boosted the porosity and improved the thermal conductivity.
Figure 5. Principal effects plot (a) 7 day compressive strength data, (b) 28 day compressive strength data, (c) porosity and (d) thermal conductivity.
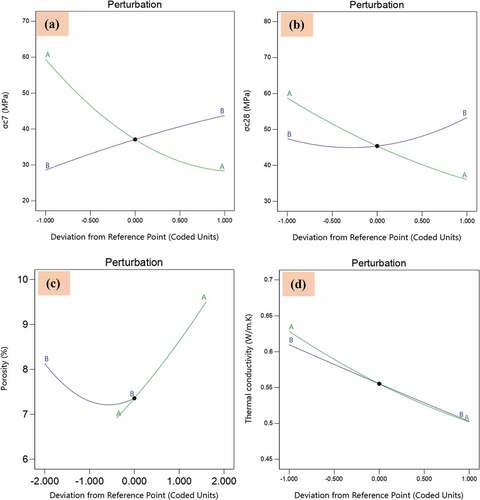
Figure 6. Surface contour tracings (a) 7 day compressive strength data, (b) 28 day compressive strength data, (c) porosity and (d) thermal conductivity.
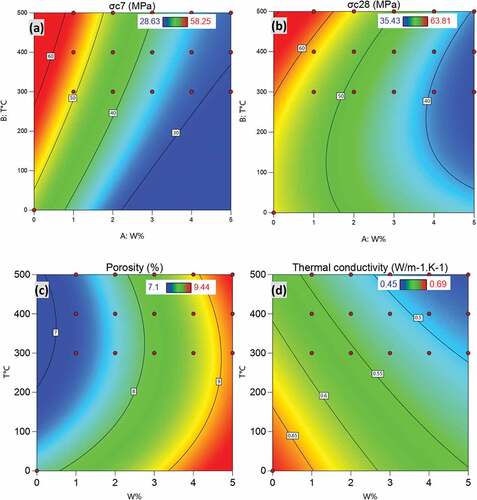
Figure 7. 3D response plots RSM models: (a) 7 day compressive strength data, (b) 28 day compressive strength data, (c) porosity and (d) thermal conductivity.
After investigating the effect of experimental parameters on the 7-day and 28-day compressive strength, porosity, and thermal conductivity of bio-mortars, the ranges of these variables that result in the optimal values were identified. The desirability portion of the Design Expert software was utilized to optimize the models. This function provides information about the input and output (desired response) of the optimal parameters simultaneously based on optimal levels of the input parameters (). The maximum values of the 28-day compressive strength, porosity, and thermal conductivity obtained from optimization using the software were 63.45 MPa, 7.37%, and 0.54 W/m.K, respectively. The associated values for the pyrolysis temperature and WFWB content were 500°C and 1%, respectively as shown in and .
Figure 8. Optimal values of compressive strength and porosity corresponding to optimum parameters of bio-mortars with a desirability = 0.816.
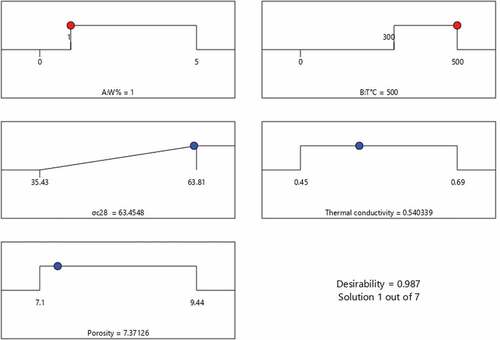
Figure 9. Optimal parameters for bio-mortars (a,b) 7 days compressive strength data, (c,d) 28 days compressive strength data, (e,f) porosity and (g,h) thermal conductivity.
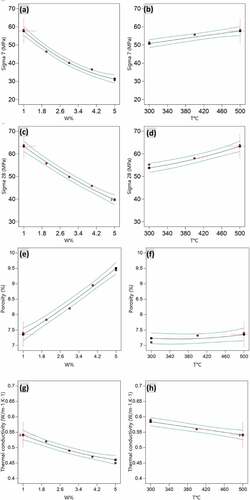
Table 4. Best solutions of bio-mortar production parameters with corresponding responses.
5. Conclusion
This study aimed to contribute to environmental protection by partially substituting cement with biochar obtained by Washingtonia filifera pyrolysis waste for the manufacture of bio-materials. Substitution of biochar produced from Washingtonia filifera rachis waste for 1 and 2 wt% cement in bio-mortar mixes increased the compressive strength. However, at higher rates exceeding 2%, when biochar was incorporated as a cement substitute, the compressive strength decreased, which is attributed to low porosity by the addition of 1 and 2 wt% of WFWB, compared to that of an addition of 3, 4, and 5 wt%. In addition, the substitution of cement with WFWB500 biochar provided superior strength, compared to WFWB400 and WFWB300, in the developed bio-mortars. However, the porosity and capillary water absorption of bio-mortars showed increases in specimens with higher biochar content and a significant improvement in thermal conductivity, which favors their application as insulating materials. RSM models were found to be adequate and appropriate for predicting the compressive strength, porosity, and thermal conductivity. The local accessibility of Washingtonia filifera wastes makes their incorporation as a biochar substitute for cement very suitable for various purposes related to paving and unstructured building elements, road concrete, and joints mortar. It is important to consider that the use of 1% WFWB in the cementitious matrix provides a composite with improved thermal and mechanical properties.
Although many investigations were conducted of the properties of mortars incorporating natural fibers, limited research exists in the literature on the use of biochar from biomass pyrolysis in mortars. Furthermore, no research was performed on the substitution of cement with biochar from Washingtonia filifera fiber waste in cementitious mortars even after the mentioned references. The use of natural wastes in construction can provide a positive environmental substitute for natural aggregates in concrete and mortar. There are many researchers exploring the development of biochar applications in the cementitious mortars as well as the possible application of biochar produced by biomass pyrolysis in order to mitigate the carbon footprint of cement building materials. Due to the easy availability and low cost of environmentally wastes, their incorporation as a cement substitute as biochar is strongly suggested in several applications like pavement mortar, paving, joint mortar and non-structural concrete elements. For further work, the experimental program will induce other mixes with varying proportions of cement-sand and several ranges of water-to-binder ratio.
Highlights
Compressive strength, porosity and thermal conductivity of the bio-mortar substitute cement with WFWB were measured
Compressive strength decreases with increasing porosities in bio-mortars.
An optimization process for bio-mortar mixture offering the highest CS.
The RSM models of CS, porosity and thermal conductivity can be deployed to predict new bio-mortar mixtures.
Acknowledgment
This project was funded by the Deanship of Scientific Research (DSR), King Abdulaziz University, Jeddah, Saudi Arabia, under grant no. (KEP-3-135-42). The authors, therefore, acknowledge with thanks DSR technical and financial support.
Disclosure statement
No potential conflict of interest was reported by the authors.
Additional information
Funding
References
- Achour, A., F. Ghomari, and N. Belayachi. 2017. Properties of cementitious mortars reinforced with natural fibers. Journal of Adhesion Science and Technology 31 (17):1938–20. doi:10.1080/01694243.2017.1290572.
- Ahmad, S., R. Khushnood, P. Jagdale, J. M. Tulliani, and G. A. Ferro. 2015. High performance self-consolidating cementitious composites by using micro carbonized bamboo particles. Materials & Design 76:223–29. doi:10.1016/j.matdes.2015.03.048.
- Akhtar, A., and A. Sarmah. 2018. Novel biochar-concrete composites: manufacturing, characterization and evaluation of the mechanical properties. The Science of the Total Environment 616–617:408–16. doi:10.1016/j.scitotenv.2017.10.319.
- Aziminezhad, M., M. Mahdikhani, and M. Memarpour. 2018. RSM-based modeling and optimization of self-consolidating mortar to predict acceptable ranges of rheological properties. Construction and Building Materials 189:1200–13. doi:10.1016/j.conbuildmat.2018.09.019.
- Belaadi, A., M. Boumaaza, H. Alshahrani, and M. Bourchak. 2023. Optimization of Palm Rachis Biochar Waste Content and Temperature Effects on Predicting Bio-Mortar : ANN and RSM Modelling. Journal of Natural Fibers 20 (1):2151547. doi:10.1080/15440478.2022.2151547.
- Belaadi, A., M. Boumaaza, S. Amroune, and M. Bourchak. 2020. Mechanical characterization and optimization of delamination factor in drilling bidirectional jute fibre-reinforced polymer biocomposites. International Journal of Advanced Manufacturing Technology 111 (7–8):2073–94. doi:10.1007/s00170-020-06217-6.
- Benzannache, N., A. Belaadi, M. Boumaaza, and M. Bourchak. 2021. Improving the mechanical performance of biocomposite plaster/washingtonian filifira fibres using the RSM method. Journal of Building Engineering 33:33. doi:10.1016/j.jobe.2020.101840.
- Boumaaza, M., A. Belaadi, and M. Bourchak. August 2021. The Effect of Alkaline Treatment on Mechanical Performance of Natural Fibers-Reinforced Plaster: Part II Optimization Comparison between ANN and RSM Statistics. Journal of Natural Fibers 19(14):1–16. doi: 10.1080/15440478.2021.1964129.
- Boumaaza, M., A. Belaadi, and M. Bourchak. 2022a. The effect of alkaline treatment on mechanical performance of natural fibers-reinforced plaster: Optimization using RSM. Journal of Natural Fibers 18 (12):2220–40. doi:10.1080/15440478.2020.1724236.
- Boumaaza, M., A. Belaadi, and M. Bourchak. 2022b. Systematic review on reinforcing mortars with natural fibers: Challenges of environment-friendly option. Journal of Natural Fibers 0 (0):1–25. doi:10.1080/15440478.2022.2060408.
- Boumaaza, M., A. Belaadi, M. Bourchak, M. Jawaid, and H. Satha. 2022. Comparative study of flexural properties prediction of washingtonia filifera rachis biochar Bio-Mortar by ANN and RSM models. Construction and Building Materials 318:125985. doi:10.1016/j.conbuildmat.2021.125985.
- Dashti, J., and M. Nematzadeh. 2020. Compressive and direct tensile behavior of concrete containing Forta-Ferro fiber and calcium aluminate cement subjected to sulfuric acid attack with optimized design. Construction and Building Materials 253:118999. doi:10.1016/j.conbuildmat.2020.118999.
- Gupta, S., and H. W. Kua. 2018. Effect of water entrainment by pre-soaked biochar particles on strength and permeability of cement mortar. Construction and Building Materials 159:107–25. doi:10.1016/j.conbuildmat.2017.10.095.
- Gupta, S., H. Kua, and H. Koh. 2018. Application of Biochar from Food and Wood Waste as Green Admixture for Cement Mortar. The Science of the Total Environment 619–620:419–35. doi:10.1016/j.scitotenv.2017.11.044.
- Gupta, S., H. Kua, and C. Low. 2018. Use of biochar as carbon sequestering additive in cement mortar. Cement and Concrete Composites 87:110–29. doi:10.1016/j.cemconcomp.2017.12.009.
- Gupta, S., H. Kua, and S. Pang. 2018. Biochar-mortar composite: manufacturing, evaluation of physical properties and economic viability. Construction and Building Materials 167:874–89. doi:10.1016/j.conbuildmat.2018.02.104.
- Hammoudi, A., K. Moussaceb, C. Belebchouche, and F. Dahmoune. 2019. Comparison of Artificial Neural Network (ANN) and Response Surface Methodology (RSM) prediction in compressive strength of recycled concrete aggregates. Construction and Building Materials 209:425–36. doi:10.1016/j.conbuildmat.2019.03.119.
- Kursuncu, B., O. Gencel, O. Y. Bayraktar, J. Shi, M. Nematzadeh, and G. Kaplan. 2022. Optimization of foam concrete characteristics using response surface methodology and artificial neural networks. Construction and Building Materials 337:127575. doi:10.1016/j.conbuildmat.2022.127575.
- Li, Z., D. Lu, and X. Gao. 2020. Multi-objective optimization of gap-graded cement paste blended with supplementary cementitious materials using response surface methodology. Construction and Building Materials 248:118552. doi:10.1016/j.conbuildmat.2020.118552.
- Maljaee, H., H. Paiva, R. Madadi, L. Tarelho, M. Morais, and V. Ferreira. 2021. Effect of cement partial substitution by waste-based biochar in mortars properties. Construction and Building Materials 301:124074. doi:10.1016/j.conbuildmat.2021.124074.
- Nematzadeh, M., A. Maghferat, and M. R. Z. Herozi. 2021. Mechanical properties and durability of compressed nylon aggregate concrete reinforced with forta-ferro fiber: Experiments and optimization. Journal of Building Engineering 41:102771. doi:10.1016/j.jobe.2021.102771.
- Onorevoli, B., G. da Silva Maciel, M. Machado, V. Corbelini, E. Caramão, and R. Jacques. 2018. Characterization of feedstock and biochar from energetic tobacco seed waste pyrolysis and potential application of biochar as an adsorbent. Journal of Environmental Chemical Engineering 6 (1):1279–87. doi:10.1016/j.jece.2018.01.039.
- Praneeth, S., L. Saavedra, M. Zeng, B. Dubey, and A. Sarmah. 2021. Biochar admixtured lightweight, porous and tougher cement mortars: Mechanical, durability and micro computed tomography analysis. The Science of the Total Environment 750:142327. doi:10.1016/j.scitotenv.2020.142327.
- Shi, S., L. Cai, Y. Weng, D. Wang, and Y. Sun. 2019. Comparative life-cycle assessment of water supply pipes made from Bamboo vs. Polyvinyl Chloride. Journal of Cleaner Production 240:118172. doi:10.1016/j.jclepro.2019.118172.
- Sirico, A., P. Bernardi, C. Sciancalepore, F. Vecchi, A. Malcevschi, B. Belletti, and D. Milanese. 2021. Biochar from wood waste as additive for structural concrete. Construction and Building Materials 303:124500. doi:10.1016/j.conbuildmat.2021.124500.
- Sultana, N., S. Zakir Hossain, M. Alam, M. Islam, and M. Al Abtah. 2020. Soft computing approaches for comparative prediction of the mechanical properties of jute fiber reinforced concrete. Advances in Engineering Software 149:102887. doi:10.1016/j.advengsoft.2020.102887.
- Tan, K., X. Pang, Y. Qin, and J. Wang. 2020. Properties of cement mortar containing pulverized biochar pyrolyzed at different temperatures. Construction and Building Materials 263:120616. doi:10.1016/j.conbuildmat.2020.120616.
- Tayebi, M., and M. Nematzadeh. 2021. Effect of hot-compacted waste nylon fine aggregate on compressive stress-strain behavior of steel fiber-reinforced concrete after exposure to fire: Experiments and optimization. Construction and Building Materials 284:122742. doi:10.1016/j.conbuildmat.2021.122742.
- Woolf, D., J. E. Amonette, F. A. Street-Perrott, J. Lehmann, and S. Joseph. 2010. Sustainable biochar to mitigate global climate change. Nature Communications 1. doi:10.1038/ncomms1053.
- Zeidabadi, Z., S. Bakhtiari, H. Abbaslou, and A. Ghanizadeh. 2018. Synthesis, characterization and evaluation of biochar from agricultural waste biomass for use in building materials. Construction and Building Materials 181:301–08. doi:10.1016/j.conbuildmat.2018.05.271.