
 ?Mathematical formulae have been encoded as MathML and are displayed in this HTML version using MathJax in order to improve their display. Uncheck the box to turn MathJax off. This feature requires Javascript. Click on a formula to zoom.
ABSTRACT
Sound absorbers play a significant role in keeping a quiet and noise-free environment. Both synthetic and natural materials can use to control noise. Currently, natural materials are a valid alternative to conventional synthetic materials. This paper aims to study the physical parameters of Grewia Optiva fibers. The theoretical models’ assessment has been carried out to calculate the sound absorption coefficient with the help of Scilab software for synthetic (melamine foam, polyurethane foam, and mineral wool) and natural (kenaf fiber, coir fiber, and Grewia Optiva fiber) materials. The results from the simulation conclude that the sound absorption coefficient of Grewia Optiva fiber is almost similar to or much better than other synthetic and natural sound absorbers. Hence, Grewia Optiva fibers can be a valid substitute for traditional sound absorbers for sound absorption purposes.
摘 要
吸音器在保持安静和无噪音的环境中发挥着重要作用. 合成材料和天然材料都可以用来控制噪音. 目前,天然材料是传统合成材料的有效替代品. 本文旨在研究Grewia Optiva光纤的物理参数. 利用Scilab软件对合成(三聚氰胺泡沫、聚氨酯泡沫和矿物棉)和天然(红麻纤维、椰纤维和Grewia Optiva纤维)材料的吸声系数进行了理论模型评估. 模拟结果表明,Grewia Optiva纤维的吸声系数几乎与其他合成和天然吸声材料相似或更好. 因此,Grewia Optiva纤维可以有效地替代传统的吸声材料.
Introduction
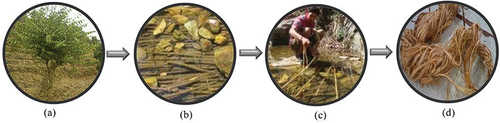
Noise pollution affects the quality of human life, and a noise-less environment is essential for residential and commercial places, aviation, automobiles, etc. Such an environment helps to improve the standard of life and comfort. In general, synthetic materials like melamine foam, polyurethane foam, polyester fiber, glass wool, rock wool, etc., are extensively used for noise control. Nowadays, the attention toward natural sound absorbers increases because of the environmental consequences and health issues associated with synthetic materials. Natural sound absorbers have many advantages in comparison to synthetic absorbers, such as biodegradability, environment-friendly, low cost, etc. Several fibrous sound absorbers are reported in the literature, such as jute (Bansod and Mohanty Citation2016, Citation2017; Fatima and Mohanty Citation2011), hemp (Berardi and Iannace Citation2015; Santoni et al. Citation2019; Yilmaz et al. Citation2011), flax (Lee et al. Citation2017), kenaf (Berardi and Iannace Citation2015; Lim et al. Citation2018), coconut (Ayub et al. Citation2012; Berardi and Iannace Citation2015), kapok fiber (Xiang et al. Citation2013), etc. In addition, a green material viz. Grewia Optiva fiber (GOF) is a biodegradable fiber. Grewia Optiva trees are spread in forests of the north-western Himalayas. The branches of Grewia Optiva trees are smooth, pale silvery brown, and the barks are thick, dark brown, and roughish. For this work, GOF are transported from a village Pancheshwar, District: Pithoragarh, Uttarakhand, India. The steps for processing fibers from the branches are given in . This fiber has never been investigated before in literature from the viewpoint of its utility as a sound absorber.
Figure 1. (a) Grewia Optiva tree branches, (b) Branches submerged in water, (c) extracting process of GOF, and (d) yellow-colored GOF.
In recent years, mathematical models have been reported to predict the acoustic behavior of several fibrous sound absorbers. The Delany and Bazley (DB) model for jute (Bansod and Mohanty Citation2016, Citation2017), coir (Berardi and Iannace Citation2015), kenaf (Berardi and Iannace Citation2015; Lim et al. Citation2018), hemp (Berardi and Iannace Citation2015), etc., Miki model for coir (Ayub et al. Citation2011), Dunn-Davern (DD) model for jute (Bansod and Mohanty Citation2017), Garai and Pompoli (GP) model for jute (Bansod and Mohanty Citation2016), kapok fiber (Xiang et al. Citation2013), etc., Johnson-Champoux-Allard model (JCA) for jute (Bansod and Mohanty Citation2016), hemp (Santoni et al. Citation2019), etc. are used to predict the acoustic behavior. The aim of this paper is to study the physical parameters of GOFs such as diameter, pore size, tortuosity, porosity, density, airflow resistivity, viscous characteristic lengths, and thermal characteristic length. In addition, the implementation of mathematical models such as DB, Miki, DD, GP, Wu, and JCA are used to predict the acoustic behavior of GOFs. The 30 mm thick material samples have been taken for theoretical and experimental analysis. Furthermore, the results are compared with other synthetic and natural sound absorbers with the help of Scilab software.
Surface morphology of GOF
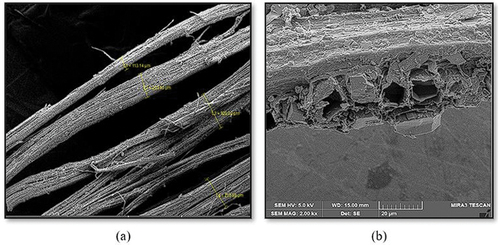
It has been confirmed from the SEM images of GOFs that GOFs are porous fiber material that contain many connected open-air cavities, and those air cavities are the major contributors to sound energy absorption. Furthermore, by observing the microstructure of GOFs, it realizes that a single GOF is a bundle of sub-fibers, and the cell wall of sub-fibers has millions of nanofibers (). The sound waves propagate through the air spaces and the GOF lumen, in which the frictional effect between cell wall and airflow transforms sound energy into heat.
Figure 2. (a) GOFs and (b) Pores in GOF at 20 µm scale.
Influencing parameters of GOF for acoustic performance
The influencing physical parameters of GOF for acoustic performance are fiber diameter, pore size, tortuosity, porosity, density, airflow resistivity, viscous characteristic lengths, and thermal characteristic length. The knowledge of these non-acoustical parameters is a prime requisite for the modeling of GOFs. As soon as these physical parameters are known, the acoustic simulation can be finished early in the design stage of product development.
Porosity and density
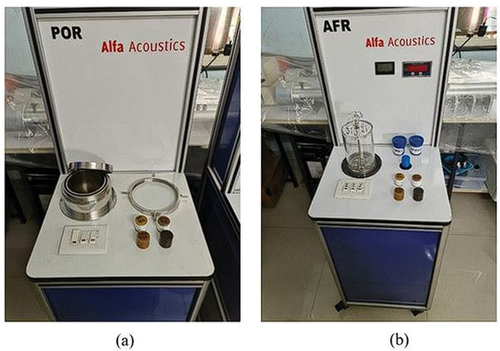
The porosity of the material is defined as the ratio of the volume of the open pores to the total volume. The numerous literature has shown that porosity is one of the important factors in acoustic absorption behavior (Mamtaz et al. Citation2016; Yilmaz et al. Citation2011). A test rig based on Boyle’s law was used to measure the porosity of the samples. The apparatus comprises of mild steel chamber diameter of 110 mm and a height of 110 mm, as shown in (). The fabricated samples were placed in the measurement chamber, and the volume of the chamber was decreased gradually in steps of every 15 seconds to attain thermal equilibrium inside the chamber. The density of fibrous material is an important factor in determining acoustic behavior. It is reported in several works of literature that as the density of fibrous material increases, the sound absorption of fibrous material also increases (Mamtaz et al. Citation2016). The bulk density
measures all the solid materials and pores of the fibers but the absolute density
measure only the solid matter of the fibers (excludes the pores and the lumen) (Mwaikambo and Ansell Citation2001). The density of GOFs is determined by the Archimedes principle. Benzene is used as displacement liquid in place of water to avoid absorption during the experiment. The
and the
are determined as follows.
Figure 3. (a) Porosity test rig and (b) Airflow resistivity test rig.
where = solvent density (benzene),
= weight of fiber, and
= weight of fiber in the solvent.
Diameter and pore size
The fiber diameter and pore size of fibrous material are significant parameters for enhancing acoustic performance. The reduction in diameter raises the sound absorption coefficient (SAC), hence higher airflow resistance with a more tortuous path (Mamtaz et al. Citation2016). The smaller the pore size, the larger the density of fibrous material, and hence, the greater the frictional effect between air and pore boundary, higher viscous loss, and better sound absorption (Liu, Yan, and Zhang Citation2016). The mean diameter of GOFs is calculated by empirical EquationEquation (3)(3)
(3) (Allard and Champoux Citation1992).
where d = mean diameter of GOF, and = bulk density of GOF.
Tortuosity and airflow resistivity
Tortuosity explains the effect of the internal structure of the material on sound absorption properties (Fatima and Mohanty Citation2011). If the tortuosity increases, the sound absorption of the material also increases. It is defined as the ratio of the square of the geometric length (L’) through the porous medium to the straight-line length (L) across the porous medium (Ghanbarian et al. Citation2013). The tortuosity of the GOF is determined by EquationEquation (4)
(4)
(4) .
The airflow resistivity ) is defined as the resistance that airflow experiences within the structure when the air enters through fibrous material. The reduction in fiber diameter increases the airflow resistivity and hence increases the sound absorption (Berardi and Iannace Citation2015; Yang et al. Citation2018). There are several theoretical and empirical models for fibrous materials to predict airflow resistivity (Berardi and Iannace Citation2015; Garai and Pompoli Citation2005; Yang et al. Citation2018). Once the airflow resistivity is identified, several theoretical models can be used to determine the SAC of materials. The airflow resistivity of GOF is directly measured in a test rig () according to ASTM C522–03 standard. The samples were placed in a test rig, and adjusted to the airflow to give a readable setting on the flow meter and pressure measuring devices.
Characteristic lengths
Two characteristic lengths, i.e., viscous characteristic length () and thermal characteristic length (
), are the significant parameters to determine the acoustic behavior of fibrous material. The viscous characteristic length describes the effect of viscous dissipation, while the thermal characteristic length defines the thermal dissipation effect at medium and high frequencies. The viscous and the thermal characteristic length of GOF are given by EquationEquations (5)
(5)
(5) and (Equation6
(6)
(6) ), respectively (Allard and Champoux Citation1992).
Mathematical modeling
There are several models available in the literatures for predicting the sound absorption mechanism of fibrous sound absorbers, and each one is commonly selected on the basis of individual absorption mechanism (Allard and Champoux Citation1992; Delany and Bazley Citation1970; Dunn and Davern Citation1986; Garai and Pompoli Citation2005; Miki Citation1990; Qunli Citation1988). The main aim of these existing models is to describe the characteristic wave impedance and the characteristic sound propagation constant by using some physical parameters like airflow resistance, tortuosity, porosity, viscous characteristic lengths, and thermal characteristic length. These models are categorized as empirical models and phenomenological models. The empirical models are based on the application of regression methods to experimental data of the impedance and airflow resistivity measurements. These empirical models require a single parameter, i.e., airflow resistivity (Bansod and Mohanty Citation2016). The first empirical model is developed by Delany and Bazley (Citation1970). In this model, they have used only airflow resistivity (for predicting the acoustical characteristics of absorbent material (Delany and Bazley Citation1970). This model estimates the impedance and wave propagation properties of fibrous materials as a function of the quotient between frequency (f) and airflow resistivity (Sagartzazu, Hervella-Nieto, and Pagalday Citation2008). However, the execution of this model is limited to a certain range of airflow resistivity, i.e.,
and porosity close to 1 where
is in Hz and
is in raylm−1. The expressions for both characteristic wave impedance (
) and characteristic sound propagation constant (
) are given as follows (Berardi and Iannace Citation2015).
where, R is real component, X is imaginary component, α is attenuation constant in nepers/m, β is phase constant = (angular frequency)/(speed of sound) = ω/c rad/m.
where, is the air density,
is the speed of sound in air;
,
,
, and
are the coefficient of
, and
,
,
, and
are the degrees of
. The coefficients and the degrees (proposed by DB) to describe both
and
are mentioned in . The surface acoustic impedance (Z) and the normal SAC
can be calculated by following equations.
Table 1. Coefficients and degrees of empirical models.
where, l is the thickness of the material.
The equations of the DB model have not given good results in the low-frequency region because the real part of the surface impedance is displayed the negative value in the low-frequency region. The value of surface impedance must be a positive real function, and the DB model has not fulfilled this criterion. Miki has modified the DB model to have a real positive value of surface impedance in the low-frequency region (Miki Citation1990). Moreover, Miki has generalized the model with respect to the porosity, the tortuosity, and the pore shape factor ratio. Miki has used the same experimental data of DB and obtained new empirical equations for characteristic impedance and characteristic propagation constant, which gives positive and real values for surface impedance. Miki has been given the modified coefficients and the degrees to those proposed by DB and are given in . DD has retained the DB equations to calculate the new regression constant for foam materials (Dunn and Davern Citation1986). The modified coefficients and degrees of the DD model are reported in . DD empirical model results are suitable only for the low flow resistivity foams. The new empirical relations have been established to calculate the acoustic properties of medium resistivity foams by Wu (Qunli Citation1988). mentions the coefficients and the degrees of Wu’s empirical model. Further, the GP model has been developed to predict the airflow resistivity, acoustic impedance, and SAC of polyester fiber. The values of the coefficients and the degrees are given in (Garai and Pompoli Citation2005).
In empirical models, the cylindrical geometry has assumed for the sound propagation in fibrous materials. In actuality, the pore shapes in fibrous materials are very intricate, and difficult to have exact models. Several other models have been introduced to investigate the relation between fibrous materials with sound (Mamtaz et al. Citation2016; Sagartzazu, Hervella-Nieto, and Pagalday Citation2008). These models are known as phenomenological models. The phenomenological models are superior to the empirical model as they use additional parameters like tortuosity, porosity, viscous characteristic length, and thermal characteristic length of the material. In Johnson-Champoux-Allard (JCA) model, all five non-acoustical parameters (flow resistivity, tortuosity, porosity, thermal characteristic length, and viscous characteristic length) have been used to obtain the acoustic behavior of fibrous materials. In this model, the frame of the porous material assumes as acoustically rigid (motionless) over a wide range of frequencies. The following equations have been given by Allard to determine the effective density ( and compressibility
(Egab, Wang, and Fard Citation2014).
where, is the reference pressure and
is Prandtl’s number.
where, η is the fluid dynamic viscosity, c is a parameter that depends on pore geometry and is a parameter analogous to c. The
,
, Z and
can be calculated as follows.
Results and discussion
The physical parameters of GOF are reported in . All these parameters have significant effects on the sound-absorbing behavior of GOF. It has been confirmed that the average diameter of GOF is higher than other synthetic and natural fibers (Arenas and Crocker Citation2010). The porosity in GOF confirms that it has sufficient pores and their interconnections for sound to pass through and get diminished. Moreover, the spongy nature and cross arrangement of lumen also assist in effective sound absorption. The diameter of pores of GOF are 2–12 µm, this variation of pore diameter is also good for sound absorption. The lumen in fiber can be clearly seen at regular interval in the micrograph (). Further, the non-acoustical parameters of the sound-absorbing materials for the theoretical models’ assessment are tabulated in .
Table 2. Physical parameters of GOF.
Table 3. The values of non-acoustical parameters of some of the sound absorbers.
SAC prediction of different materials by different theoretical models
The SAC of GOF, along with other sound absorbers (melamine foam (MF), polyurethane foam (PUF), mineral wool (MW), kenaf fiber (KF), and coir fiber (CF)), are predicted by both the empirical and the phenomenological models. The SAC of each sound absorber is illustrated graphically by empirical and phenomenological models. The value of SAC increases with frequency in low-frequency range (0.1–1.5 kHz). It reaches the optimum value in the medium-frequency range (1.5–4 kHz), then a slight drop in the high-frequency range, (4–5 kHz). The sound absorption performance is almost similar for all the materials in the low-frequency region, but there is a considerable shift in the medium and the high-frequency ranges. Due to the non-linear behavior of sound absorbing materials, the values of SAC are different in all frequency region. Also, sound is reflected and refracted when it entered in the porous material and due to the low energy elastic collision, small amount of energy has been converted into heat and hence materials have low absorption coefficient during low-frequency waves. Also, the waves have high wavelength near low frequencies and hence low energy. The sound waves reflect and refract and loses energy after colliding with the fiber wall. There are less collision and less loss of sound energy with low-frequency. Furthermore, at low-frequency region, the thickness and denser structure of the material play an important role and it has direct relationship. Alternatively in medium- and high-frequency region, there has been more energy loss in the form of heat due to inelastic collisions. At high frequencies, the incidence sound wave is in phase with the reflected wave and coincidence dip phenomenon may occurs which may further decrease the SAC. The SAC curves for different materials (MF, PUF, MW, KF, CF, and GOF) by the acoustic models such as DB and Miki, DD and Wu, and GP and JCA are shown in , respectively.
Figure 4. Comparison of SAC curves for the different sound absorbers by using (a) Delany and Bazley model, and (b) Miki model.
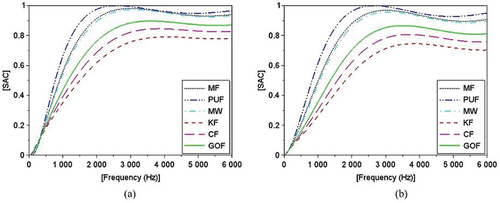
Figure 5. Comparison of SAC curves for the different sound absorbers by using (a) Dunn-Davern model, and (b) Wu model.
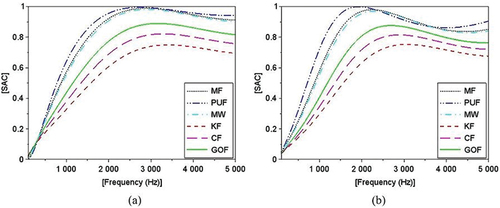
Figure 6. Comparison of SAC curves for the different sound absorbers by using (a) Garai and Pompoli model, and (b) Johnson-Champoux-Allard model.
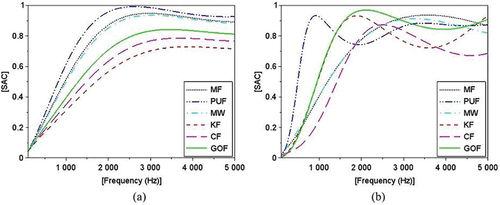
In the low-frequency region, the values of SAC for KF and CF are superior in the frequency ranges 0.0–0.327 kHz and 0.327–0.333 kHz, whereas PUF has shown higher SAC values in the remaining low-frequency range as compared to other sound absorbers in DB model. Furthermore, in the Miki model, the values of SAC are superior in the frequency range 0.0–0.138 kHz for KF, 0.138–0.146 kHz for CF, and 0.146–1.5 kHz for PUF. In the DD model, KF, CF, GOF, MW, and PUF have shown superior values of SAC in 0.0–0.22 kHz, 0.22–0.264 kHz,0.264–0.325 kHz, 0.325–0.358 kHz, and 0.358–1.5 kHz frequency regions, respectively. Moreover, in the Wu model, the values of SAC for PUF are better than all the other absorbers in the low-frequency range. In the GP model, KF and PUF have higher values of SAC in the 0.0–0.1 kHz and 0.1–1.5 kHz frequency regions, respectively. Likewise, in the JCA model, the MF PUF and GOF have shown superior values of SAC in the frequency ranges 0.0–0.37, 0.37–1.3 kHz, and 1.4–1.5 kHz, respectively. In the medium frequency region, the SAC values for PUF are better in DB, Miki, DD, and GP models than the other sound absorbers. Also, in the Wu model, PUF has shown superior values of SAC in the frequency ranges 1.5–2.3 kHz and 3.67–4.5 kHz. Moreover, in the JCA model, the values of SAC for GOF are higher in 1.6–2.9 kHz frequency ranges with respect to others, whereas MF has shown superior values of SAC in the frequency range 2.9–4 kHz. Furthermore, in the high-frequency range, the values of SAC for PUF are superior in DB, Miki, DD, Wu, and GP models, but in the JCA model, MF has shown better values of SAC in 4–4.7 kHz and in 4.8–5 kHz frequency region KF has shown better values of SAC amongst others. The patterns in all the empirical models are more or less similar to each other, but in the phenomenological model, there are variations in SAC curves, and these curves are closer to the experimental results. Further, the results confirm that the SAC for PUF is found to be superior in DB, Mikki, DD, and GP empirical models in the frequency range 0.4–5 kHz. But in the Wu model, MF has shown best SAC in comparison to other counterparts in the frequency range 2.4–3.7 kHz. Moreover, in phenomenological model, the mixed observations for SAC have been found in the frequency regions, i.e., the SAC are best for PUF, GOF, MF and KF in the frequency ranges 0.2–1.3 kHz, 1.4–2.9 kHz, 3–4.7 kHz, and 4.8–5 kHz, respectively. Also, the values of SAC for GOF are superior to all other natural fibers. The decreasing order of SAC using different models in low, medium, and high-frequency regions are mentioned in .
Table 4. Decreasing order of SAC values in DB and Miki models.
Table 5. Decreasing order of SAC values in DD and Wu models.
Table 6. Decreasing order of SAC values in GP and JCA models.
Comparison of SAC for GOF by experimental and mathematical modeling
The SAC of GOF has been projected by theoretical models, and the outcomes have been compared with the experimental value. The comparison between theoretical and experimental SAC values is shown in , and it is observed that the value of SAC from mathematical models in the low-frequency region is almost similar to the experimental results. But in theoretical models, once the frequency range increases from low to high, the SAC values decrease except for the JCA model (in comparison to experimental results). Furthermore, with the increase in frequency from 500 Hz to 3 kHz, a variation in measured and predicted SAC values has been observed. The predicted SACs from empirical models are more or less similar throughout the remaining frequency range. But the phenomenological model has shown a dissimilarity in SAC values between 500 Hz to 3 kHz frequency range, and these values are closer to the experimental values. But then again, in the frequency range 3 to 4 kHz for all models, the experimental and theoretical SAC values are similar to each other. Moreover, it has been observed from the results that the JCA model captures a similar trend with experimental results and shows higher accuracy in comparison to empirical models. The empirical models have shown similar predictions to each other, and the values of SAC from these models have been a little lower than the experimental results. The reason for the discrepancy of SAC in theoretical models is because empirical models depend on airflow resistivity only. The coefficients and degrees used in empirical models are different from each other. Moreover, empirical models are appropriate for only one type of material in a certain frequency range. Further, in empirical models, fiber pore shapes are very complicated to model, thus the cylindrical geometry has been assumed for the sound propagation. In contrary, the phenomenological model depends on airflow resistivity, porosity, tortuosity, thermal characteristic length, and viscous characteristic length. The JCA model is a simplified model to minimize empirical models’ inconsistencies at low-frequency. The JCA model is more accurate and reliable than other empirical models. Therefore, this phenomenological model gives closer prediction to the experimental results.
Figure 7. Comparison of experimental and theoretical modeling SAC values of GOFs.
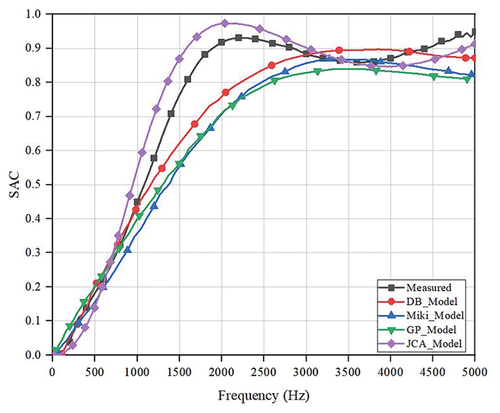
The comparison of different mathematical models confirms that the SAC of GOF is superior than other natural absorbers in medium and high-frequency regions. Also, in some of the frequency regions (mentioned in the above tables), the SAC of GOF has shown higher values amongst all the other natural and synthetic absorbers. Similarly, studies show that the SAC of natural coir fiber by experiments can be best represented by JCA and Miki model (Taban et al. Citation2019). Hence, it is established that theoretical models can match the results with measurement. So, the estimation of parameters of GOF and subsequent prediction of SAC of GOF could be safely used for SAC estimation by various models.
Regression analysis
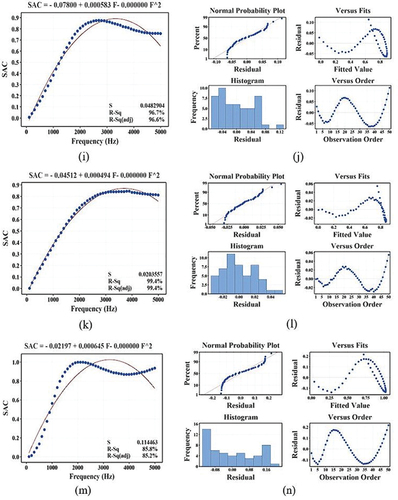
The regression analysis for experimental and theoretical data have been conducted to best fit the datasets. The R-squared value for GOF have been found to be 90.9% from experiments. However, the same is 98.3%, 99.4%, 99.0%, 96.7%, 99.4% for empirical models like for DB model, Miki model, DD model, Wu model, and GP model, respectively. Similarly, for JCA model, R-squared value is 85.8%. The R-squared value is a statistical measure in a regression model that determines the proportion of variance in the dependent variable (SAC) that can be explained by the independent variable (frequency). All empirical models that are one parameter dependent models have greater than 95% of R-squared value, indicating a regression model to be considered reliable. The R-squared value of JCA model also indicate slightly reduced reliability which is evident since the model depends on 5 parameters. The experimental R-squared value also indicate reliability. The fitted line plots with regression equations, and residual plots for GOF with respective datasets have been shown in for experimental results, empirical models (5 nos.) and phenomenological (JCA) model. The regression analysis has indicated that the input parameters are approximately well fitted at a 95% confidence level. Further, the probability plots have shown that the residuals are normally distributed.
Figure 8. Regression analysis (a) fitted line plot for experimental data, (b) residual plots for experimental data, (c) fitted line plot for DB model, (d) residual plots for DB model, (e) fitted line plot for Miki model, (f) residual plots for Miki model, (g) fitted line plot for DD model, (h) residual plots for DD model, (i) fitted line plot for Wu model, (j) residual plots for Wu model, (k) fitted line plot for GP model, (l) residual plots for GP model, (m) fitted line plot for JCA model, and (n) residual plots for JCA model.
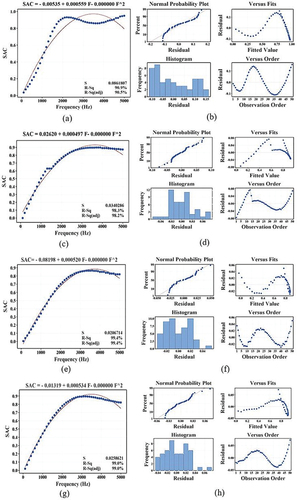
Figure 8. (Continued).
The p-value is less than 5% (), which confirms the dependency of SAC on frequency. Also, the comparison of the fitted line plots, regression equations, and residual plots for all materials in different theoretical models are given in . The regression analysis in all the theoretical models confirms the fits at 95% confidence level, probability plots confirm the normal distributions.
Table 7. Comparison of Analysis of Variance.
Table 8. Fitted line plots, regression equations, and residual plots for materials in different theoretical models.
Conclusion
The conclusions from this study are as follows.
The average diameter of GOF is higher than other synthetic and natural fibers.
The diameter of pores of GOF are in between 2-12 µm.
The results conclude that GOF has shown SAC of 0.85-0.95 in the mid to high-frequency range, which is almost similar to or higher than the other synthetic and natural sound absorbers studied in this paper.
The results revealed that the SAC for PUF is found to be superior in empirical models except for Wu empirical model in the frequency range 0.4-5 kHz.
In the Wu model, MF has shown best SAC in comparison to other counterparts in the frequency range 2.4-3.7 kHz.
Moreover, in phenomenological model, the SAC are best for PUF, GOF, MF and KF in the frequency ranges 0.2-1.3 kHz, 1.4-2.9 kHz, 3-4.7 kHz, and 4.8-5 kHz, respectively.
Acknowledgement
First author thanks the Ministry of Human Resource and Development, Ministry of Education (MOE), Government of India for giving Ph.D. fellowship.
Disclosure statement
No potential conflict of interest was reported by the authors.
References
- Allard, J. F., and Y. Champoux. 1992. New empirical equations for sound propagation in rigid frame fibrous materials. The Journal of the Acoustical Society of America 91 (6):3346–24. doi:10.1121/1.402824.
- Arenas, J., and M. Crocker. 2010. Recent trends in porous sound-absorbing materials. Sound & Vibration 44 (July):12–17.
- Ayub, M., M. J. M. Nor, M. H. Fouladi, R. Zulkifli, and N. Amin. 2012. A practical acoustical absorption analysis of coir fiber based on rigid frame modeling. Acoustical Physics 58 (2):246–55. doi:10.1134/S1063771012020194.
- Ayub, M., R. Zulkifli, M. Fouladi, N. Amin, and M. J. M. Nor. 2011. A study on the acoustical absorption behavior of coir fiber using miki model. International Journal of Mechanical and Materials Engineering 6 (December):343–49.
- Bansod, P. V., and A. R. Mohanty. 2016. Inverse acoustical characterization of natural jute sound absorbing material by the particle swarm optimization method. Applied Acoustics 112 (November):41–52. doi:10.1016/j.apacoust.2016.05.011.
- Bansod, P. V., and A. R. Mohanty. 2017. Inverse estimation of the Dunn and Davern Model coefficients for Jute material using the Particle Swarm Optimization method. Textile Research Journal 87 (17):2166–75. doi:10.1177/0040517516665264.
- Berardi, U., and G. Iannace. 2015. Acoustic characterization of natural fibers for sound absorption applications. Building and Environment 94 (December):840–52. doi:10.1016/j.buildenv.2015.05.029.
- Delany, M. E., and E. N. Bazley. 1970. Acoustical properties of fibrous absorbent materials. Applied Acoustics 3 (2):105–16. doi:10.1016/0003-682X(70)90031-9.
- Dunn, I. P., and W. A. Davern. 1986. Calculation of acoustic impedance of multi-layer absorbers. Applied Acoustics 19 (5):321–34. doi:10.1016/0003-682X(86)90044-7.
- Egab, L., X. Wang, and M. Fard. 2014. Acoustical characterisation of porous sound absorbing materials: a review. International Journal of Vehicle Noise and Vibration 10 (1/2):129. doi:10.1504/IJVNV.2014.059634.
- Fatima, S., and A. R. Mohanty. 2011. Acoustical and fire-retardant properties of jute composite materials. Applied Acoustics 72 (2):108–14. doi:10.1016/j.apacoust.2010.10.005.
- Garai, M., and F. Pompoli. 2005. A simple empirical model of polyester fibre materials for acoustical applications. Applied Acoustics 66 (12):1383–98. doi:10.1016/j.apacoust.2005.04.008.
- Ghanbarian, B., A. G. Hunt, P. Ewing, and M. Sahimi. 2013. Tortuosity in porous media: a critical review. Soil Science Society of America Journal 77 (5):1461–77. doi:10.2136/sssaj2012.0435.
- Kino, N., and T. Ueno. 2008. Comparisons between characteristic lengths and fibre equivalent diameters in glass fibre and melamine foam materials of similar flow resistivity. Applied Acoustics 69 (4):325–31. doi:10.1016/j.apacoust.2006.11.008.
- Lee, H. P., B. M. P. Ng, A. V. Rammohan, and L. Q. N. Tran. 2017. An investigation of the sound absorption properties of flax/epoxy composites compared with glass/epoxy composites. Journal of Natural Fibers 14 (1):71–77. doi:10.1080/15440478.2016.1146643.
- Lim, Z. Y., A. Putra, M. J. M. Nor, and M. Y. Yaakob. 2018. Sound absorption performance of natural kenaf fibres. Applied Acoustics 130 (January):107–14. doi:10.1016/j.apacoust.2017.09.012.
- Liu, X., X. Yan, and H. Zhang. 2016. Effects of pore structure on sound absorption of Kapok-based fiber nonwoven fabrics at low frequency. Textile Research Journal 86 (7):755–64. doi:10.1177/0040517515599742.
- Mamtaz, H., M. H. Fouladi, M. Al-Atabi, and S. N. Namasivayam. May 9, 2016. Acoustic absorption of natural fiber composites. Review article. Journal of Engineering 2016: 1–11. doi:https://doi.org/10.1155/2016/5836107.
- Miki, Y. 1990. Acoustical properties of porous materials-modifications of Delany-Bazley models-. Journal of the Acoustical Society of Japan (E) 11 (1):19–24. doi:10.1250/ast.11.19.
- Mwaikambo, L. Y., and M. P. Ansell. 2001. The determination of porosity and cellulose content of plant fibers by density methods. Journal of Materials Science Letters 20 (23):2095–96. doi:10.1023/A:1013703809964.
- Qunli, W. 1988. Empirical relations between acoustical properties and flow resistivity of porous plastic open-cell foam. Applied Acoustics 25 (3):141–48. doi:10.1016/0003-682X(88)90090-4.
- Sagartzazu, X., L. Hervella-Nieto, and J. M. Pagalday. 2008. Review in sound absorbing materials. Archives of Computational Methods in Engineering 15 (3):311–42. doi:10.1007/s11831-008-9022-1.
- Santoni, A., P. Bonfiglio, P. Fausti, C. Marescotti, V. Mazzanti, F. Mollica, and F. Pompoli. 2019. Improving the sound absorption performance of sustainable thermal insulation materials: Natural hemp fibres. Applied Acoustics 150 (July):279–89. doi:10.1016/j.apacoust.2019.02.022.
- Taban, E., P. Soltani, U. Berardi, A. Putra, S. Mohammad Mousavi, M. Faridan, S. Ehsan Samaei, and A. Khavanin. 2020. Measurement, modeling, and optimization of sound absorption performance of Kenaf fibers for building applications. Building and Environment 180 (August):107087. doi:10.1016/j.buildenv.2020.107087.
- Taban, E., A. Tajpoor, M. Faridan, S. E. Samaei, and M. H. Beheshti. 2019. Acoustic absorption characterization and prediction of natural coir fibers. Acoustics Australia 47 (1):67–77. doi:10.1007/s40857-019-00151-8.
- Xiang, H. F., D. Wang, H. C. Liua, N. Zhao, and J. Xu. 2013. Investigation on sound absorption properties of Kapok fibers. Chinese Journal of Polymer Science 31 (3):521–29. doi:10.1007/s10118-013-1241-8.
- Yang, T., R. Mishra, K. V. Horoshenkov, A. Hurrell, F. Saati, and X. Xiong. 2018. A study of some airflow resistivity models for multi-component polyester fiber assembly. Applied Acoustics 139 (October):75–81. doi:10.1016/j.apacoust.2018.04.023.
- Yilmaz, N., P. Banks-Lee, N. Powell, and S. Michielsen. 2011. Effects of porosity, fiber size, and layering sequence on sound absorption performance of needle-punched nonwovens. Journal of Applied Polymer Science 121 (September):3056–69. doi:10.1002/app.33312.