
 ?Mathematical formulae have been encoded as MathML and are displayed in this HTML version using MathJax in order to improve their display. Uncheck the box to turn MathJax off. This feature requires Javascript. Click on a formula to zoom.
ABSTRACT
With the more and more amelioration of our quality of life, our needs for clothing have altered from having clothes to wearing good-looking, among which the wrinkle resistance of clothing fabric owns a giant effect on the beauty of clothing. Nowadays, artificial subjective evaluation is mainly used to evaluate the wrinkle grade of garment fabrics in the textile industry. This evaluation method owns the shortcoming of poor accuracy, being time-consuming and poor objectivity. For solving this problem, it is very important to put forward an objective evaluation model of fabric wrinkle grade. In this paper, we proposed a fabric wrinkle objective evaluation model with the optimized random vector functional link. The model applies DarkNet19 deep neural network to abstract the high-order visual features of the wrinkled surface image of the fabric, uses the improved artificial hummingbird optimization algorithm to ameliorate the import bias and weight of the random vector function link’s hidden layer, and uses norm regularization computes output weights for random vector function links. The relative tests reveal that the objective evaluation model of fabric wrinkles put forward in this paper has excellent performance.
摘要
随着我们生活质量的日益提高,我们对服装的需求已经从有衣服变为穿得好看,其中服装面料的抗皱性对服装的美观有着巨大的影响. 目前,在纺织工业中,人工主观评价主要用于评价服装面料的褶皱等级. 这种评价方法具有准确性差、耗时长、客观性差的缺点. 为了解决这一问题,提出一个客观的织物褶皱等级评价模型是非常重要的。本文提出了一种基于优化随机向量函数链的织物褶皱客观评价模型. 该模型应用DarkNet19深度神经网络提取织物褶皱表面图像的高阶视觉特征,使用改进的人工蜂鸟优化算法改善随机向量函数链接隐藏层的输入偏差和权重,并使用L_2,1范数正则化计算随机向量函数链的输出权重. 相关试验表明,本文提出的织物褶皱客观评价模型具有良好的性能.
Introduction
The appearance of smoothness of fabric is an important indicator of wrinkle resistance. At present, the wrinkle grade of garment fabric is mainly evaluated by artificial subjective evaluation, which is easy to be affected by subjective evaluation and is time-consuming and laborious. In the wake of the fast advancement of computer vision and artificial intelligence, the realization of an objective automatic fabric wrinkle evaluation method has become the focus of this field. Among them, obtaining fabric appearance information is the primary problem of fabric wrinkle grade evaluation. Based on previous studies, fabric appearance information could be split into two-dimensional graphic features and three-dimensional graphic features, among which two-dimensional image traits could be split into time-dimension traits and frequency-dimension traits.
For the time dimension feature is used as the characteristic index of fabric image, Zao et al (Zaouali et al. Citation2007) proposed that wrinkle volume, wrinkle surface roughness, wrinkling density, and wrinkling density were used to define the basic characteristics of wrinkle, so as to grade wrinkles. Mori et al (Mori and Komiyama Citation2002) proposed to use statistics such as contrast, Angle second moment, correlation, and entropy extracted from gray cooccurrence matrix as visual feature parameters of fabrics. For the frequency domain feature as the feature index of fabric image, Sun et al (Sun et al. Citation2011). explored the effect of the quantity of wavelet decomposition layers on the smoothness characteristics of fabric appearance, determined this decomposition image of a specific frequency layer, extracted its sharpness, density, contrast, direction, and other features, as the fabric wrinkle grade’s assessment index. Choi et al (Choi et al. Citation2009) employed fast Fourier transform technology to extract relevant spectral information during fabric feature extraction and constructed an objective quantitative system for fabric wrinkle classification. For three-dimensional image features as feature indexes of fabric images, Turner et al (Turner et al. Citation2004) proposed a laser-based surface contour recognition system, which uses the camera to sense the three-dimensional shape of fabric samples, so as to quantitatively evaluate the smoothness of fabric. Mir et al (Hesarian Citation2010) studied the wrinkle resistance of fabrics by using projected contour ray technology and proposed that average deviation, absolute mean, surface area ratio, and other parameters were used as the characteristic indexes of the flatness of the three-dimensional depth map of fabrics. Because the 3d image feature extraction method has the problem of low real-time performance and high equipment cost, this paper adopts the 2d image feature extraction method to extract the fabric wrinkle image feature. Most researchers use low-order visual features of fabric images, but few use high-order visual features of fabric images. To resolve the issue, we put forward a fabric high-order trait abstraction approach with the DarkNet19 deep neural network.
After the feature of fabric appearance smoothness is extracted, a specific evaluation model should be adopted. Wang et al (Wang et al. Citation2020) employed the support vector machine (SVM) to evaluate the flatness of fabric appearance. Xiaobo Yang (Xiao Citation2011) proposed the adaptive network fuzzy inference system (ANFIS) based on subtractive clustering to objectively evaluate the textile fold gradation. Zhou et al (Zhou et al. Citation2022) proposed an improved Random Vector Functional Link (RVFL) (Igelnik and Pao Citation1995), which was used for the impersonal assessment of textile fold gradation. In this paper, an LR21-RVFL classifier is proposed based on (Preeti et al. Citation2021). Since the random generation of import offsets and weight of the RVFL hidden layer will affect the RVFL’s classification performance and steadiness, an ameliorated artificial hummingbird algorithm (AHA) (Zhao, Wang, and Mirjalili Citation2022) is proposed to ameliorate RVFL hidden layer’s offsets and import weight. Thus, the property of the fabric grade evaluation model can be improved.
In recent years, the Moth-flame optimization algorithm (MFO) (Mirjalili Citation2015), Sine Cosine Algorithm (SCA) (Mirjalili Citation2016), Whale Optimization Algorithm (WOA) (Mirjalili and Lewis Citation2016), Multi-verse Optimizer (MVO) (Mirjalili, Mirjalili, and Hatamlou Citation2016), Salp Swarm Algorithm (SSA) (Mirjalili et al. Citation2017), Artificial Hummingbird Algorithm (AHA) and other optimization algorithms, which are based on the idea of group optimization. The combination of optimization algorithms and machine learning can be applied to classification and regression in various fields (Amor et al. Citation2021, Citation2022, Citation2022; Chen et al. Citation2020; Huang et al. Citation2011; Li, Shi, and Yang Citation2021a, Citation2021b, Citation2021c; Moosavi and Bardsiri Citation2017). Chen et al (Chen et al. Citation2020). An improved Bacterial Foraging Optimization (BFO) was proposed and applied to optimize the parameters of the Kernel Extreme Learning Machine (KELM) (Huang et al. Citation2011). Li et al (Li, Shi, and Yang Citation2021a). A clothing image classification technology based on dragonfly algorithm (DA) optimization of online sequence extreme learning machine (OSELM) is proposed. Amor et al (Amor et al. Citation2022) proposed an evaluation model of an artificial neural network (ANN) combined with a Golden Eagle optimizer (GEO). The author used GEO to ameliorate all ANN’s thresholds and weights. The model takes the coating amount, fabric mass, and fabric thickness of ZnO NPs as the model’s input, and comfort performance evaluation as output. Samaresh et al (Moosavi and Bardsiri Citation2017) proposed a method combining the Satin bowerbird optimization algorithm (SBO) and ANFIS to estimate software development workload. This work uses the SBO algorithm to optimize the parameters used by ANFIS input and output member functions.
Inspired by the above literature, we proposed a fabric wrinkle rating model based on improved AHA optimization LR21-RVFL, and the major proffer in this paper are shown below:
In order to abstract the high-order visual features of the fabric image, we proposed using the DarkaNet19 neural network to abstract the traits of the textile fold image, and use the kernel principal component analysis (KPCA)approach to reduce these features to 128 dimensions. The final 128-dimensional features will be used as input to the classification model.
To ameliorate the quality of this initial population of the AHA optimization algorithm, the population initialization, which is based on quasi-reflection learning, is used to ameliorate this artificial hummingbird algorithm, based quasi-reflection learning can improve the level of the algorithm’s incipient search agent. To further ameliorate the exploration capability of the AHA optimization algorithm, we apply Gaussian mutation to the optimization algorithm, thereby improving the algorithm’s local hunting capacity and convergence velocity to a certain extent.
The output weights are calculated using
norm regularization, and the performance of RVFL using this approach is better than that of the original approach. In this paper, a DarkNet19-QGAHA- LR21RVFL fabric wrinkle rating model is proposed and experimentally proves that the wrinkle grade rating model owns nice robustness and accuracy.
The article’s remainder is arranged as follows. Section 2 briefly explains DarkNet19 neural networks, gaussian mutations, quasi-reflectance-based learning, artificial hummingbird algorithms, and RVFL classifiers. Section 3 presents the approach put forward in the paper. Section 4 narrates the preparation, process, and summary of the experimental outcomes. Section 5 is the conclusion of the paper.
Background
DarkNet19
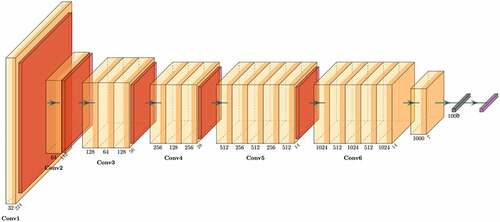
DarkNet19 (Redmon and Farhadi Citation2017) is a neural network model proposed by Joseph Redmon in 2016, which is the backbone network of YOLO v2 for extracting features. The network construction of DarkNet19 is revealed in . Darknet19 owns 19 convolutional layers, and the stride of these convolutional layers is 1. Among them, both Conv1 and Conv2 are convolution modules with a kernel size of 3 × 3. Both Conv and Conv4 are convolution modules with two convolutional layers with a kernel size of 3 × 3 sandwiching a convolutional layer with a kernel size of 1 × 1. Conv5, like Conv6, is a convolution module with three convolutional layers with a kernel size of 3 × 3 sandwiching two convolutional layers with a kernel size of 1 × 1. Except for Conv6, each convolution module has a maxpool layer that doubles the channels’ quantity. DarkNet19 draws on the idea of Network In Network (Lin, Chen, and Yan Citation2013) and uses global average pooling to make predictions. Feature compression is performed by placing a convolutional layer with kernel size 1 × 1 between two convolutional layers with kernel size 3 × 3. DarkNet19 absorbs the advantages of networks such as VGG16 (Simonyan and Zisserman Citation2015), which are small in structure but powerful in performance. DarkNet19 takes 5.58 billion calculations to process an image. DarkNet19 has an accuracy of 72.9% for the top 1 and 91.2% accuracy for the top 5 on the ImageNet dataset.
Figure 1. DarkNet19 network architecture.
Gaussian mutations
Gaussian variation is a variation operation method of genetic algorithms for local search performance of key search areas, which replaces the primary gene values by a casual quantity of a normal distribution, which owns an average of and variance of
. According to the characteristics of the normal distribution, the Gaussian mutation focus search location near the original individual, and the Gaussian mutation operator is shown in EquationEquation (1)
(1)
(1) . The local search ability of Gaussian variation is better, but the ability to guide individuals to jump out of local better solutions is weak, which is not conducive to global convergence.
Quasi-reflected based learning
The population initialization based on quasi-reflective learning put forward by us is to consider the incipient population , the opposing population
, the quasi-reverse population
, and the quasi-reflective population
, and take n of the more adaptable of these as the final initial population. Thus, theoretically, the method is superior to the opposite-based learning.
The basic idea based on opposite-based learning (OBL) (Tizhoosh Citation2005) is to evaluate the feasible solution and its contrary solutions simultaneously and choose the best one as the final candidate solution. The specific calculation equation of the opposite solution is as follows:
Quasi-opposite-based learning (QOBL) (Rahnamayan, Tizhoosh, and Salama Citation2007) is a variant of OBL. Studies have proved that it is more effective to use QOBL to initialize the population than OBL to find the global optimum key. The specific calculation equation of the quasi-opposite key is as follows:
Ewees et al (Fan, Chen, and Xia Citation2020) proposed a novel quasi-reflective based learning mechanism (QRBL) based on OBL and QOBL. The specific calculation equation of the quasi-reflective population is as follows:
Artificial hummingbird algorithm
AHA is a heuristic optimization algorithm put forward by Zhao et al. in 2021. The algorithm was inspired by the recall, predation strategy, and hummingbirds’ flight capacity, and simulated three predation strategies (Migration foraging strategy, territorial foraging strategy, and guided foraging strategy) and three flying capacities (omnidirectional flight, diagonal and axial). The algorithm has three main components: food source, hummingbird, and access table. The food source represents the optimal solution, the hummingbird represents the candidate solution, and the access table is used to record the track of the hummingbird.
Guided searching for food
In the process of searching for food, hummingbirds choose a mode of flight, in which axial flight allows hummingbirds to fly along any coordinate axis. Axial flying is shown as shown below:
Diagonal flying allows hummingbirds to fly along the diagonal of any rectangle, which is shown as shown below:
Omnidirectional flying means that flight in any direction can be mapped to three axes. Omnidirectional flying is shown as shown below:
where d is the dimension of the candidate solution, randi([1, d]) produces a casual integral number from 1 to d, randperm(k) produces a casual integer permutation from 1 to k, and represents a casual quantity in (0,1].
Hummingbirds can use these three flying skills to forage, simulating the mathematical equation that guides foraging behavior and the source of food candidates as shown below:
where represents the location of the i-th aliment origin at time t, and
is the location that the i-th hummingbird plan to interview at time T, Parameter a is a leading factor that follows a standard normal distribution. The mathematical equation for updating the location of the i-th aliment origin is as shown below:
where f represents the fitness function.
Territorial foraging
After visiting an already visited food source, the hummingbird will also look for another unvisited food source. It will look for another food source within its own territory. The math formula for imitating the seeking for another food source is as shown below:
where b represents the region element, which obeys the standard normal distribution.
Migration foraging
Because the territory where hummingbirds live is frequently visited, food sources in the territory become scarce, and thus hummingbirds choose to migrate to further territories for seeking food. The math equation of this migration seeking for food process is as shown below:
where was the worst food source for nectar replenishment rate. Migration foraging is triggered every 2
nPop, nPop indicates population size.
Random vector functional link network
RVFL is a single hidden layer feedforward network, which has a good nonlinear fitting ability. Therefore, RVFL is adopted in this paper as the classifier of the fabric wrinkle rating model, and its structure is shown in . Based on this model, the output of the RVFL model can be expressed as EquationEquation (12)(12)
(12) .
Figure 2. RVFL network architecture.
where is the n-dimensional vector, n represents the characteristic dimension of the input,
is the m-dimensional vector, m represents the categories’ quantity of the output, L indicates the nodes’ quantity at the hidden layer.
and
represent the hidden layer input weight and weight respectively. The two parameters
represent the output weight, and function h(x) is the activation function. We usually use the Sigmoid function as the activation function.
EquationEquation (12)(12)
(12) can be reduced to a multiplication of two matrices:
where H stands for the hidden layer’s output matrix, and the matrix form is shown in EquationEquation (14)(14)
(14) .
stands for output weight matrix in the form of EquationEquation (15)
(15)
(15) , and
represents the expected output in the form of EquationEquation (16)
(16)
(16) .
Proposed method
In this paper, DarkNet19 deep convolutional neural network was used to abstract traits from fabric wrinkle graphics, and the abstracted traits were reduced to 128 dimensions by KPCA. In this paper, an improved AHA algorithm using Gaussian variation and quasi-reflection learning is proposed to optimize the initial weight and bias of hidden layers in RVFL networks.
Image feature extraction method based on DarkNet19
DarkNet19 is used as our feature extraction method in this paper. See subsection 4.3.2 of the experiment. In this paper, the network structure of DarkNet19 is modified, a full connection layer with an outsize of 5 is added between the global average pooling layer and softmax layer, the iterations’ maximal quantity of network training is set up to 240, and 30% of data set is split as verification set. SGDM was selected as the learner, and the initial learning rate was set to 0.01, batch size to 128, and momentum to 0.9. This default loss function was a cross-entropy function, and all data would be normalized before training.
After repeated training, the features of dimension 10001
1 gotten by extracting this global average pooling layer. This 1000-dimensional feature will greatly increase the RVFL’s hidden layer nodes’ weight and bias, thus affecting the classification speed of the model. In this paper, the KPCA was applied to cut down the trait dimension to 128 dimensions, and the data after dimensionality reduction were saved locally as the input of the QGAHA-RVFL fabric wrinkle objective evaluation model.
Improved AHA optimization algorithm
In this paper, QRBL was introduced into the AHA optimization algorithm to ameliorate the quality of the incipient search agent. At the same time, in each iteration of the optimization algorithm, the gaussian mutation operation is performed on the optimal candidate solution to ameliorate the optimization algorithm’s local hunt ability. In this paper, the ameliorated AHA optimization algorithm is called QGAHA, and the improved AHA optimization algorithm’s pseudo-code is shown as Algorithm 1.
: The QGAHA algorithm is proposed in this paper.
RVFL textile fold rating model with ameliorated AHA
The original RVFL was randomly initialized with the hidden layer’s offset and input weight, which would bring a lot of uncertainty to the RVFL model’s property. Therefore, we proposed an improved AHA to ameliorate the RVFL hidden layer’s offset and input weight, so as to ameliorate the RVFL model’s steadiness and accuracy.
In this paper, the nodes’ quantity of the RVFL hidden layer is set to 80, and the characteristic dimension is 128, so the solution dimension of the optimization algorithm can be calculated as 12980, in which 1
80 is biased, 128
80 is the input weight, and the range of input weight and bias is [−1,1]. The optimization algorithm’s fitness function is set as the classification error rate of the test set of the RVFL classifier, and the fitness function is shown in EquationEquation (17)
(17)
(17) .
where indicates the test sets’ quantity and
indicates the quantity of classification errors in the test set.
In this paper, the population size is finally set as 20 and the loops’ maximum quantity is set as 50, based on subsection 4.3.1 of the experiment. At the end of the optimization iteration, the optimal solution was brought into RVFL again for classification to obtain the final classification accuracy. Fabric wrinkle objective evaluation model of concrete implementation steps as shown in . is the example diagram of each wrinkle level. First, we used the DarkNet19 feature extraction method and KPCA dimension reduction method to extract 128-dimensional higher-order visual features from fabric wrinkle images and split the samples into training samples and test samples in a 7:3 ratio. Secondly, we use the sample as the input of the QGAHA-RVFL textile fold objective evaluation model to train and optimize the RVFL hidden layer’s bias and input weight. Thirdly, we take the optimal solution after the specified number of iterations as the final RVFL parameter and then assess this wrinkle grade of the testing data set to calculate final accuracy.
Figure 3. The flow chart of the RVFL fabric wrinkle rating model based on improved AHA optimization.
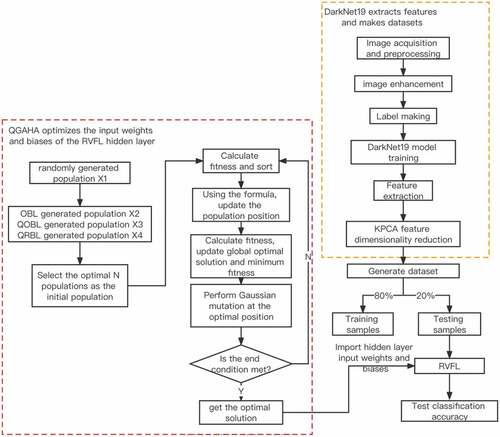
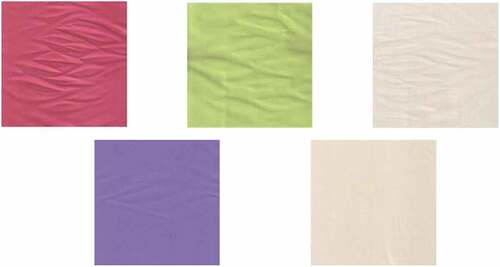
Figure 4. Example diagram of each wrinkle level.
In this paper, the norm regularization method is used to calculate the output weight β. Experiments show that the QGAHA-RVFL wrinkle objective evaluation model put forward in the paper owns better forecast accuracy by using the
norm regularization method to calculate output weight β. Therefore, except for the RVFL of the experiment in Section 4.3.4, the RVFL of other experiments uniformly uses the
norm regularization method to calculate the output weight. Finally, the model of fabric wrinkle rating proposed in this paper is called DarkNet19-QGAHA-RVFL.
Experiment outcomes and summary
Experiment setup
In this test, a variety of fabrics of different materials are used for image collection, which is different in fabric composition, warp, weft, surface density, thickness, and other indicators. Among them, the main components of these fabrics are woolen wool, cotton, hemp, wool, and cicada silk. The experiment was carried out at a room temperature of 155
and standard atmospheric pressure. The image scanning equipment was a Canon LiDE300 scanner. In this experiment, Matlab software was used for the experiment, and the Deep Network Designer was used for feature extraction of DarkNet19 deep convolutional network.
Collection of fabric wrinkle image
The steps of fabric wrinkle image collection are as follows: First, the fabric is cut to a 30 cm30 cm square. Second, fold the square fabric twice along the diagonal to form a right triangle. Third, fasten the two sharp angles of the fabric and twist the right ends of the fabric. This causes wrinkles to occur in the center of the fabric. Fourthly, restore the fabric after twisting, iron the fabric flat with an iron, and leave it on a flat surface for five minutes. Fifthly, an optical scanner was applied to sweep the fabric, and the obtained graphics were cut to the size of 2100
2100 picture elements by graphic compiling software, and then compressed to the size of 224
224 to facilitate deep learning to extract features. A total of 248 fabric wrinkle images were collected.
Evaluation of wrinkle grade of fabrics
The evaluation method of fabric wrinkle grade is based on the AATCC 124–2018 (American Association of Textile Chemists and Colorists AATCC AATCC Citation2018) fabric wrinkle evaluation standard, which suggests a method of fabric wrinkle grade evaluation. This method requires three professionals to grade the same fabric. If the evaluation results are inconsistent, they will be evaluated again until the evaluation results continue. The final consistent evaluation results will be used as the label of the wrinkle image of the fabric. In this experiment, the wrinkle grade is divided into 5 grades, grade 1 is the winkle’s highest level, and grade 5 is the lowest wrinkle’s level. The following are the sample figures for each grade of fabric wrinkle.
Image augmented
The number of fabric images collected is very limited, and the deep learning network needs a great number of data for training. To ameliorate the precision degree of this fabric wrinkling objective evaluation model, the fabric image is augmented in this experiment. Firstly, the fabric wrinkle images of the size of 224224 are grayed and median filtered. Then, the processed images are vertically flipped, horizontally flipped, vertically flipped, counterclockwise rotated 90°, and clockwise rotated 90° respectively. Finally, these 1488 images are used as the final fabric image dataset.
Benchmark function optimization experiment
In order to evaluate the search capability of the QGAHA algorithm, this subsection evaluates the proposed improved algorithm with five popular optimization algorithms and unimproved AHA algorithms on 10 classical benchmark functions, which are QAHA, GAHA, AHA, SCA, SSA, WOA, MFO, MVO. The parameters of the above optimization algorithm are set according to the parameter values of the original paper. The concrete argument settings are revealed in . Because of the large gap between benchmark functions, the maximal quantity of loops of optimization was customized in this experiment. Each benchmark function was independently repeated 10 times. After the experiment, the mean and variance of 10 independent experiments were calculated and recorded.
Table 1. The parameter setting of the method used.
Benchmark functions
The reference functions used by us are primarily delimited into two forms: single-mode function and multi-mode function. The single-mode function owns merely one global optimum solution and no part optimum solution, so it could be applied to evaluate the optimization algorithm’s part hunt capability. Multimodal functions have multiple locally optimal solutions, which brings it simple for the optimization algorithm to enter the part optimum so that the global search ability of the optimization algorithm can be evaluated by using this function. The specific functions are shown in , where ~
is a single-mode function,
~
is a multi-mode function, Dim represents the number of parameters to be optimized, Range represents the range of optimization parameters,
is the benchmark function’s optimum number, and
is the maximum number of user-defined iterations.
Table 2. 10 benchmark functions and corresponding parameter settings.
Optimization results and analysis
In this experiment, the optimal solution’s standard and average deviation are used as indicators to assess the optimization algorithm’s property. The evaluation results are revealed in , Std and Mean stand for the standard deviation and average solution of 10 independent tests separately. From the table, we could know that, in terms of average solution, the QGAHA algorithm proposed in this paper can outperform all other algorithms in the ,
,
,
,
,
, and
benchmark functions, indicating that QGAHA algorithm has excellent optimization performance, while in the
,
,
benchmark functions, The QGAHA optimization algorithm put forward by us is slightly inferior to a few other algorithms. In terms of standard deviation, the QGAHA algorithm proposed in this paper can outperform all other algorithms in
,
,
,
, and
benchmark functions, declaring that this QGAHA algorithm owns nice steadiness. The average ranking of the evaluation performance of each optimization algorithm is shown in . The outcomes display that QGAHA put forward by us owns the highest average ranking, and GAHA, AHA, and QAHA are the 2nd to 4th respectively. By comparing the evaluation results and average rankings of GAHA and AHA algorithms in 10 benchmark functions, the GAHA algorithm results are better than the AHA algorithm, the main reason is that the introduction of Gaussian mutation can further ameliorate the part exploration capacity of the AHA algorithm, thereby improving the performance of AHA Optimize performance (Zhou et al. Citation2022). By comparing the evaluation results of the QAHA and AHA algorithms in 10 benchmark functions, we found that the AHA algorithm did not achieve significant performance improvement after initializing the population with Quasi reflective based learning. We generally believe that Quasi reflective-based learning can provide a variety of excellent populations for the optimization algorithm (Nama Citation2022), and the contribution of a good initial population to the algorithm’s performance is going to reduce as the quantity of loops increases. Since the number of iterations specified in the benchmark function test exceeds 100, the population initialized using Quasi reflected-based learning cannot play a role in the later optimization.
Figure 5. Average ranking of performance evaluated by each optimization algorithm.
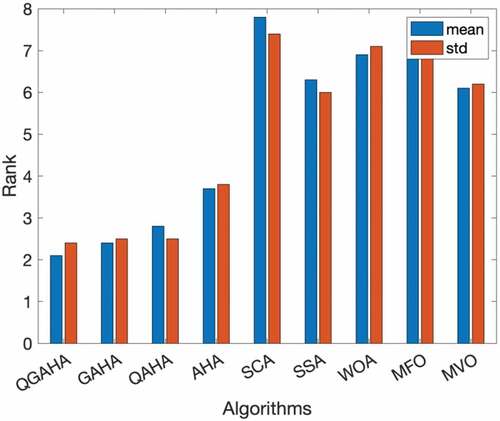
Figure 6. Iterative curves of each optimization algorithm in 10 benchmark functions.
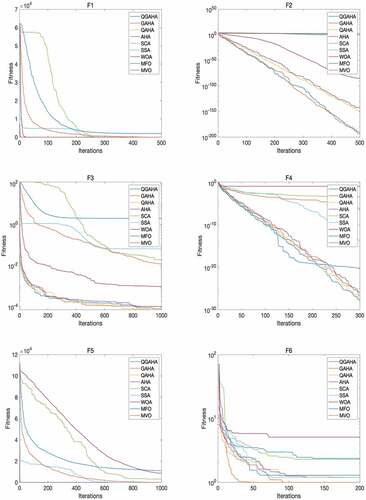
Figure 6. (Continued).
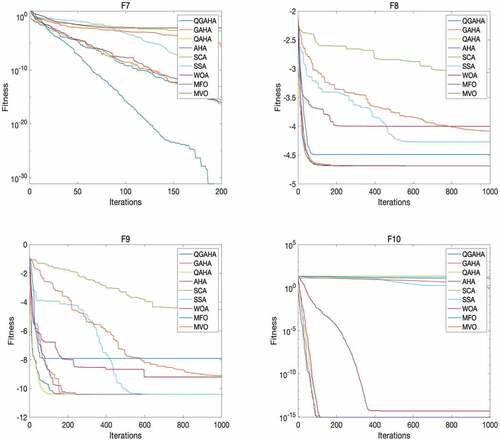
Table 3. Test results of optimization algorithms on different benchmark functions.
The iteration curves of each optimization algorithm in 10 benchmark functions are shown in , where the ordinate represents the average solution of the current iteration of ten experiments, and the abscissa represents the current iteration. From the figure, we could know that the put-forward QGAHA optimization algorithm has better convergence speed than other optimization algorithms on the five single-mode benchmark functions. It could be known from the convergence curves of benchmark functions F6 and F7 that QGAHA and QAHA algorithms have a better starting point than other algorithms.
Prediction experiment of DarkNet19-QGAHA-RVFL wrinkle rating model
Analysis of initial parameters of optimization algorithm
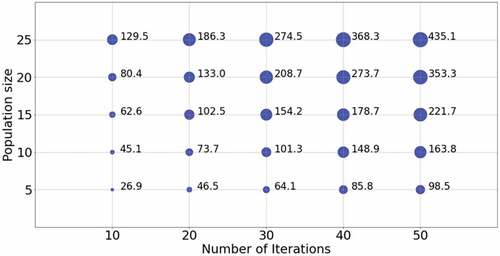
The optimization’s arguments setting algorithm will affect the performance of this fabric wrinkling grade evaluation model. Therefore, this subsection will study the effect of population quantity and maximum iteration number on the property of the fabric wrinkling rating model. In the experiment, the maximum iteration times were set as 10, 20, 30, 40, and 50, and the population number was set as 5, 10, 15, 20, and 25, with a total of 25 parameter combinations. In the experiment, features extracted by DarkNet19 were used as input, and 5-fold cross-validation was performed. Ten tests were independently run, and the mean accuracy of ten tests was computed as the average accuracy under this parameter combination. The experiment outcomes are shown in . The abscissa represents the maximum quantity of loops, the ordinate represents the population size, and the size of bubbles represents the model’s assortation degree of precision under this parameter combination. From the figure, we could know that when the maximum iteration quantity is 10 and the population size is 5, the model’s association degree of precision is the lowest, which is 0.96682. When the maximum iteration number is 50 and the population number is 20, the model’s assortation degree of precision is the best, which is 0.97252. The classification accuracy of the model is proportional to the population extent and the maximum quantity of iterations. In this paper, the classification time of each parameter combination is recorded, as shown in , where the bubble size represents the average time (in seconds) of ten independent 5-fold cross-validation experiments. After comprehensive consideration of the accuracy and time consumption of model classification, the parameter combination with a maximum iteration number of 50 and a population number of 20 was selected as the parameters of subsequent experiments.
Figure 7. Average accuracy under different combinations of the maximum number of iterations and population number.
Figure 8. Average optimization time under different combinations of maximum iteration number and population number.
Feature validation experiment
To prove the availability of features extracted by the DarkNet19 trait abstraction approach, this subsection compares the DarkNet19 feature extraction method with ResNet18 (He et al. Citation2016), VGG16 (Redmon and Farhadi Citation2017), GLCM feature extraction method (Wang and Yao Citation2000), and Gabor feature extraction method. Among them, we changed the network structure of ResNet18 and VGG16, adjusted the output vector dimension of the last fully connected layer of ResNet18 and VGG16 to 5, and the training parameters of the model were consistent with those of DarkNet19. The GLCM feature extraction method is to extract the standard and average deviation of correlation, an inertia’s moment, entropy, and energy as eigenvalues from the gray cooccurrence matrix under the direction of image 0,,
,
. Gabor feature extraction method uses the Gabor filter to filter, and take the entropy in the 0,
,
,
,
,
,
direction as a feature. The features extracted by these feature extraction methods were used as the input of the QGAHA-RVFL wrinkle objective evaluation model, and 5 independent repeated experiments were carried out using 5-fold cross-validation. The lowest accuracy, highest accuracy, standard deviation, and mean accuracy of 5 independent experiments were recorded as evaluation indexes.
The comparison results of extraction methods are revealed in . From the table, we could know that the put-forward method reached the best results in all four evaluation indicators, with an average accuracy of 0.9759, which is higher than that of the ResNet18-AHA-RVFL algorithm 0.0245, indicating that the DarkNet19 network is suitable for extracting image features of fabric wrinkles. At the same time, the proposed method achieves the lowest standard deviation, which indicates that the proposed method has good stability.
Table 4. Comparison results of different feature extraction methods.
Optimization method validation experiment
To verify the influence of the selection of optimization approaches on the assortation effect of the textile fold objective evaluation model, this subsection conducts a comparative experiment of optimization algorithms. The classification models for comparison are DarkNet19-GAHA-RVFL, DarkNet19-QAHA-RVFL, DarkNet19-AHA-RVFL, DarkNet19-SCA-RVFL, DarkNet19-SSA-RVFL, DarkNet19-WOA-RVFL, DarkNet19-MFO-RVFL, DarkNet19-MVO-RVFL. In this subsection, the 5-fold cross-validation was used to conduct 10 independent repeated tests, and the lowest classification accuracy, highest classification accuracy, standard deviation, and average classification accuracy were recorded as assessment indexes.
The experiment outcomes are revealed in . From the table, we could know that this paper proposes the QGAHA optimization algorithm to get the highest average assortation accuracy and the highest of the highest classification accuracy, the MVO optimization algorithm has the worst standard deviation but the best minimum classification accuracy and the experiment shows that QGAHA has better performance in optimizing input weight and bias of RVFL hidden layer than other optimization algorithms. By comparing the 2 to 4 columns of , it can be seen that the performance of the wrinkle grade evaluation model using the ameliorated AHA algorithm has been further ameliorated. Among them, the model’s accuracy has been ameliorated by 0.0005 by adding Gaussian mutation, and 0.0007 by adding Quasi reflected based learning. Both improved the AHA algorithm simultaneously to ameliorate the model accuracy by 0.0012. Moreover, by comparing the four algorithms’ standard deviation results, it is found that the distinctness between the outcomes is not heavy, which indicates the introduction of Gaussian mutation and Quasi reflected based learning has little impact on the stability of the evaluation model.
Table 5. Comparison results of different optimization algorithms.
Classifier validation experiment
To verify the effect of the selection of classifiers on the classification effect of this fabric wrinkle rating model, this subsection conducts a comparative experiment of classifiers, which include extreme learning machine (ELM) (Huang, Zhu, and Siew Citation2004), KELM, SVM, and ANN (Jang Citation1993). We used the QGAHA optimization algorithm to ameliorate the offset and import weight of ELM, the penalty argument C and argument γ of KELM, the penalty argument C and kernel function argument G of SVM, and the weights and biases of each layer of the ANN network. In this subsection, the 5-fold cross-validation was used to conduct five independent repeated tests. The experimental results in this subsection are shown in , wherein, the evaluation index acc-0 represents the error accuracy of level 0, acc-1 represents the error accuracy of level 1, opt-time represents the time spent on optimization parameters, and pre-time represents the time spent on prediction. The unit of time is seconds.
Table 6. Comparison results of different classifiers.
From the experimental results, we could know that the accuracy of LR21RVFL put forward by us is 0.9713 in the acc-0 evaluation index, which is the highest among all classifiers, but it is not as good as SVM in level 1 error accuracy, with a difference of 0.0007. However, since the SVM model solves the multi-classification problem, and we use a one-against-rest method (Weston and Watkins Citation1998) to splits the problem into multiple binary classification subproblems, the training time required is very long, reaching 1018.28 seconds. Since the weight and bias of the input layer of ELM are generated stochastically (Huang, Zhu, and Siew Citation2004), the training speed of the ELM model is improved. On the basis of ELM, KELM introduced kernel function to further improve the learning efficiency. From , we could know that the optimization parameters time and prediction time required by KELM rank first, while the prediction time and optimization parameters time asked by ELM rank second. However, the evaluation accuracy obtained by KELM and ELM differs greatly from the proposed method, with 0.0425 and 0.0335 respectively.
Comparative experiments with existing methods
To verify the performance of the DarkNet19-QGAHA-RVFL fabric crease rating model, we compared the proposed model with four existing models, they are GLCM-SVM (Wang and Yao Citation2000), GLCM-BP (Mori and Komiyama Citation2002), Gabor-SVM (Sun et al. Citation2011), SSA-RVFL (Zhou et al. Citation2022) and ANFIS (Xiao Citation2011). In this subsection, 5-fold cross-validation was used for 5 independent repeated tests. The experiment outcomes are revealed in .
Table 7. The results are compared with existing methods.
From , we could know that the DarkNet19-QGAHA-RVFL fabric wrinkle rating model put forward by us gets the highest error accuracy of level 0 (0.9722), with a difference of 0.0136 with the second place. The put-forward method by us achieves the second highest error accuracy of level 1 (0.9916), with a difference of 0.005 in the first place. It is found that the gap between the DarkNet19-QGAHA-RVFL and SSA-RVFL methods is huge by comparing their prediction time indicators of them, which is 0.1017 seconds and 0.0081 seconds respectively. After analysis, the major reason is that the put-forward approach requires to taking the predicted fabric images as the input of DarkNet19 and outputting the image features during prediction. In contrast, the image features of the SSA-RVFL method are obtained by calculating various parameters of the fabric image, such as GLGS entropy roughness, contrast, directivity, etc.
In order to verify that the fabric wrinkle rating model put forward by us owns the same classification effect for different crease grades, in this experiment, select one of the five 5-fold cross-validation datasets as the validation set, train the model once, and draw the confusion matrix, as revealed in . In the figure, the row represents the predicted category, the column is the actual kind, the green value in the rightmost column is the classification accuracy of the model put forward by us for this category, and the red value represents the recall rate for this category. The green value in the first five squares of the last row(column) indicates the accuracy of the model when the actual category of the fabric (predicted category) is a serial number of the column (row) in which the square is located. The red value is the failure rate.
Figure 9. DarkNet19-QGAHA-RVFL classification confusion matrix.
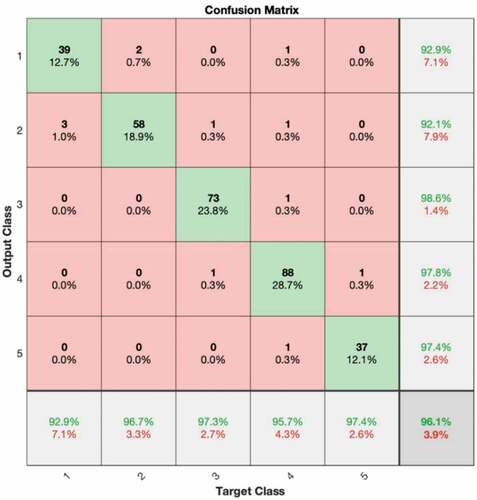
From the figure, we could know that the model put forward us has the lowest classification accuracy (92.1%) for wrinkle grade 2, and the highest classification accuracy (98.6%) for wrinkle grade 3, with a difference of 6.5%.
Conclusion
In this paper, a DarkNet19-QGAHA-RVFL textile fold rating model is proposed, which uses the DarkNet19 convolution model to extract features from fabric wrinkle images. In this paper, an ameliorated AHA optimization algorithm is put forward, which applies quasi-reflective-based learning to improve the incipient search agent quality of the AHA algorithm, and introduces Gaussian mutation to further ameliorate the local optimization capacity of the AHA algorithm. Finally, the improved AHA algorithm is applied to ameliorate the offset input weight and import weight of the RVFL hidden layer, and norm regularization is used to calculate the RVFL output weight. A large number of comparative experiments have been conducted in this paper, and the following conclusions have been drawn:
By comparing with other optimization algorithms in ten benchmark functions, it is verified that the improved AHA optimization algorithm put forward by us has better searching performance.
By comparing with other methods of fabric winkle feature extraction, it can be proved that DarkNet19 is applied to abstract higher-order visual traits of fabric winkle, and kernel principal component analysis is applied to cut down the dimension of traits,
Compared with the existing fabric wrinkle rating methods, the outcomes prove that the model put forward by us owns better evaluation accuracy and robustness.
Highlights
In order to abstract the high-order visual features of the fabric image, we proposed using the DarkaNet19 neural network to abstract the traits of the textile fold image, and use the kernel principal component analysis (KPCA)approach to reduce these features to 128 dimensions. The final 128-dimensional features will be used as input to the classification model
To ameliorate the quality of this initial population of the AHA optimization algorithm, the population initialization, which is based on quasi-reflection learning, is used to ameliorate this artificial hummingbird algorithm, based quasi-reflection learning can improve the level of the algorithm’s incipient search agent. To further ameliorate the exploration capability of the AHA optimization algorithm, we apply Gaussian mutation to the optimization algorithm, thereby improving the algorithm’s local hunting capacity and convergence velocity to a certain extent.
The output weights are calculated using
Disclosure statement
No potential conflict of interest was reported by the author(s).
Additional information
Funding
References
- American Association of Textile Chemists and Colorists (AATCC) AATCC 124-2018. 2018. Smoothness appearance of fabrics after repeated home laundering. Triangle Park, NC, USA: American.
- Amor, N., M. T. Noman, A. Ismail, M. Petru, and N. Sebastian. 2021. Neural networkcrowsearch model for the prediction of functional properties of nano TiO2 coated cotton composites. ScientificReports 11 (1):1–22. doi:10.1038/s41598-021-93108-9.
- Amor, N., M. T. Noman, A. Ismail, M. Petru, and N. Sebastian. 2022. Use of an artificial neural network for tensile strength prediction of nano titanium dioxide coated cotton. Polymers 14 (5):937. doi:10.3390/polym14050937.
- Amor, N., M. T. Noman, M. Petru, and N. Sebastian. 2022. Comfort evaluation of ZnO coated fabrics by artificial neural network assisted with golden eagle optimizer model. Scientific Reports 12 (1):6350. s41598-022-10406-6.
- Chen, H. L., Q. Zhang, J. Luo, Y. T. Xu, and X. Q. Zhang. 2020. An enhanced bacterial foraging optimization and its application for training kernel extreme learning machine. Applied Soft Computing 86:105884. doi:10.1016/j.asoc.2019.105884.
- Choi, C. J., H. J. Kim, Y. C. Jin, and H. S. Kim. 2009. Objective wrinkle evaluation system of fabrics based on 2d fft. Fibers and Polymers 10 (2):260–65. doi:10.1007/s12221-009-0260-0.
- Fan, Q., Z. J. Chen, and Z. H. Xia. 2020. A novel quasi-reflected Harris hawks optimization algorithm for global optimization problems. Soft Computing 24 (19):14825–43. doi:10.1007/s00500-020-04834-7.
- Hesarian, M. 2010. Evaluation of fabric wrinkle by projected profile light line method. The Journal of the Textile Institute 101 (5):463–70. doi:10.1080/13598130802528238.
- He, K. M., X. Y. Zhang, S. Q. Ren, and J. Sun. 2016. Deep residual learning for image recognition. In Proceedings of the IEEE conference on computer vision and pattern recognition, 770–78. https://arxiv.org/abs/1512.03385
- Huang, G. B., H. M. Zhou, X. J. Ding, and R. Zhang. 2011. Extreme learning machine for regression and multiclass classification. IEEE Transactions on Systems, Man, and Cybernetics, Part B (Cybernetics) 42 (2):513–29. doi:10.1109/TSMCB.2011.2168604.
- Huang, G. B., Q. Y. Zhu, and C. K. Siew. 2004. Extreme learning machine: A new learning scheme of feedforward neural networks. In 2004 IEEE international joint conference on neural networks (IEEE Cat. No. 04CH37541) 2:985–90.doi:10.1109/IJCNN.2004.1380068
- Igelnik, B., and Y. H. Pao. 1995. Stochastic choice of basis functions in adaptive function approximation and the functional-link net. IEEE Transactions on Neural Networks 6 (6):1320–29. doi:10.1109/72.471375.
- Jang, J. S. R. 1993. ANFIS: Adaptive-Network-Based Fuzzy Inference System. IEEE Transac-Tions on Systems 23 (3):665–85. doi:10.1109/21.256541.
- Lin, M., Q. Chen, and S. C. Yan. 2013. Network in network. arXiv preprint arXiv 1312:4400. https://arxiv.org/abs/1312.4400.
- Li, J. Q., W. M. Shi, and D. H. Yang. 2021a. Clothing image classification with a dragonfly algorithm optimised online sequential extreme learning machine. Fibres & Textiles in Eastern Europe 3 (147):91–96. doi:10.5604/01.3001.0014.7793.
- Li, J. Q., W. M. Shi, and D. H. Yang. 2021b. Color difference classification of dyed fabrics via a kernel extreme learning machine based on an improved grasshopper optimization algorithm. Color Research & Application 46 (2):388–401. doi:10.1002/col.22581.
- Li, J. Q., W. M. Shi, and D. H. Yang. 2021c. Fabric wrinkle evaluation model with regularized extreme learning machine based on improved Harris Hawks optimization. The Journal of the Textile Institute 113 (2):199–211. doi:10.1080/00405000.2020.1868672.
- Mirjalili, S. 2015. Moth-flame optimization algorithm: A novel nature-inspired heuristic paradigm. Knowledge-Based Systems 89:228–49. doi:10.1016/j.knosys.2015.07.006.
- Mirjalili, S. 2016. Sca: A sine cosine algorithm for solving optimization problems. Knowledge-Based Systems 96:120–33. doi:10.1016/j.knosys.2015.12.022.
- Mirjalili, S., A. H. Gandomi, S. Z. Mirjalili, S. Saremi, H. Faris, and S. M. Mirjalili. 2017. Salp swarm algorithm: A bio-inspired optimizer for engineering design problems. Advances in Engineering Software 114:163–91. doi:10.1016/j.advengsoft.2017.07.002.
- Mirjalili, S., and A. Lewis. 2016. The whale optimization algorithm. Advances in Engineering Software 95:51–67. doi:10.1016/j.advengsoft.2016.01.008.
- Mirjalili, S., S. M. Mirjalili, and A. Hatamlou. 2016. Multi-verse optimizer: A nature-inspired algorithm for global optimization. Neural Computing & Applications 27 (2):495–513. doi:10.1007/s00521-015-1870-7.
- Moosavi, S., and V. K. Bardsiri. 2017. Satin bowerbird optimizer: A new optimization Algo-rithm to optimize ANFIS for software development effort estimation. Engineering Applications of Art-Ificial Intelligence 60:1–15. doi:10.1016/j.engappai.2017.01.006.
- Mori, T., and J. Komiyama. 2002. Evaluating wrinkled fabrics with image analysis and neural networks. Textile Research Journal 72 (5):417–22. doi:10.1177/004051750207200508.
- Nama, S. 2022. A novel improved SMA with quasi reflection operator: Performance analysis, application to the image segmentation problem of Covid-19 chest X-ray images. Applied Soft Computing 118:108483. doi:10.1016/j.asoc.2022.108483.
- Preeti, P., R. Bala, A. Dagar, and R. P. Singh. 2021. A novel online sequential extreme learning machine with l2, 1-norm regularization for prediction problems. Applied Intelligence 51 (3):1669–89. doi:10.1007/s10489-020-01890-2.
- Rahnamayan, S., H. R. Tizhoosh, and M. M. A. Salama. 2007. Quasi-oppositional differential evolution. In 2007 IEEE congress on evolutionary computation, 2229–36. doi: 10.1109/CEC.2007.4424748
- Redmon, J., and A. Farhadi. 2017. Yolo9000: Better, faster, stronger. In Proceedings of the IEEE conference oncomputer vision and pattern recognition, 7263–71. doi:10.1109/CVPR.2017.690
- Simonyan, K., and A. Zisserman. 2015. Very deep convolutional networks for large-scale image recognition. 3rd International Conference on Learning Representations (ICLR 2015), 1–14. https://arxiv.org/abs/1409.1556
- Sun, J. J., M. Yao, B. G. Xu, and P. Bel. 2011. Fabric wrinkle characterization and classification using modified wavelet coefficients and support-vector-machine classifiers. Textile Research Journal 81 (9):902–13. doi:10.1177/0040517510391702.
- Tizhoosh, H. R. 2005. Opposition-based learning: A new scheme for machine intelligence. International conference on computational intelligence for modelling, control and automation and international conference on intelligent agents, web technologies and internet commerce (CIMCAIAWTIC’06) 1: 695–701.doi:10.1109/CIMCA.2005.1631345
- Turner, C., H. Sari-Sarraf, E. F. Hequet, N. Abidi, and S. Lee. 2004. Preliminary validation of a fabric smoothness assessment system. Journal of Electronic Imaging 13 (3):418–27. doi:10.1117/1.1760758.
- Wang, J. A., K. J. Shi, L. Wang, R. R. Pan, and W. D. Gao. 2020. A computer vision system for objective fabric smoothness appearance assessment with an ensemble classifier. Textile Research Journal 90 (3–4):333–43. doi:10.1177/0040517519866951.
- Wang, X. H., and M. Yao. 2000. Grading the crease recovery with twisting of fabric by using image identification technique. International Journal of Clothing Science and Technology 12 (2):114–23. doi:10.1108/09556220010324902.
- Weston, J., and C. Watkins.1998. Multi-class support vector machines. Technical Report CSD-TR-98-04
- Xiao, Y. 2011. Evaluate fabric wrinkle grade based on subtractive clustering adaptive network fuzzy inference systems. Advanced Materials Research 332-334:1505–10. doi:10.4028/scientific.net/AMR.332-334.1505.
- Zaouali, R., S. Msahli, B. El Abed, and F. Sakli. 2007. Objective evaluation of multidirectional fabric wrinkling using image analysis. The Journal of the Textile Institute 98 (5):443–51. doi:10.1080/00405000701489156.
- Zhao, W. G., L. Y. Wang, and S. Mirjalili. 2022. Artificial hummingbird algorithm: A new bio-inspired optimizer with its engineering applications. Computer Methods in Applied Mechanics and Engineering 388:114194. doi:10.1016/j.cma.2021.114194.
- Zhou, Z. Y., Z. J. Ma, Z. F. Zhu, and Y. M. Wang. 2022. Objective rating of fabric wrinkles via random vector functional link based on the improved salp swarm algorithm. Textile Research Journal 92 (1–2):70–90. doi:10.1177/00405175211025774.
- Zhou, W., P. J. Wang, A. A. Heidari, X. H. Zhao, and H. L. Chen. 2022. Spiral Gaussian mutation sine cosine algorithm: Framework and comprehensive performance optimization. Expert Systems with Applications 209:118372. doi:10.1016/j.eswa.2022.118372.