
 ?Mathematical formulae have been encoded as MathML and are displayed in this HTML version using MathJax in order to improve their display. Uncheck the box to turn MathJax off. This feature requires Javascript. Click on a formula to zoom.
ABSTRACT
Availability, simplicity of processing, biodegradability, sustainability, and compatibility with human skin in terms of moisture management and temperature regulation, cellulosic fibers are preferred for clothing. In this study four (04) different cellulosic yarns (cotton, bamboo, viscose, and tencel) and two weave designs (1/1 plain and 2/2 warp rib) were used to develop eight (08) woven fabrics with equal thread densities, and their volume porosity %, air permeability, thermal resistance, water vapor permeability index, and moisture management properties were compared. The results showed that tencel fabrics showed the highest water vapor permeability index and overall moisture management capability (OMMC) values, whereas cotton fabrics had the highest values of volume porosity %, air permeability, and thermal resistance. Furthermore, the 2/2 warp rib weave design showed higher values of volume porosity %, air permeability, and thermal resistance in comparison with 1/1 plain woven fabrics, while the water vapor permeability index and OMMC values were higher in 1/1 plain woven fabrics. Moreover, the statistical significance of both factors (cellulose material and weave design) on different results was also analyzed.
摘 要
在水分管理和温度调节方面,纤维素纤维的可用性、加工简单性、生物降解性、可持续性和与人体皮肤的兼容性是服装的首选. 在这项研究中,使用四(04)种不同的纤维素纱线(棉、竹、粘胶和天丝)和两种组织设计(1/1平纹和2/2经纹)开发了八(08)种具有相同线密度的机织物,并比较了它们的体积孔隙率%、透气性、耐热性、水蒸气渗透指数和水分管理性能. 结果表明,天丝织物的水蒸气渗透指数和整体水分管理能力(OMMC)值最高,而棉织物的体积孔隙率%、透气性和耐热性值最高. 此外,与1/1平纹织物相比,2/2经肋组织设计显示出更高的体积孔隙率%、透气性和热阻值,而1/1平纹机织物的水蒸气渗透指数和OMMC值更高. 此外,还分析了两个因素(纤维素材料和织物设计)对不同结果的统计意义.
Introduction
Cellulosic fibers e.g., cotton, coir, kapok, milkweed, flax, ramie, hemp, abaca, pina, etc. are obtained from plants, and most of them are used for clothing purposes. These cellulosic fibers have good comfort properties when they encounter the skin, furthermore, some regenerated fibers i.e., tencel, viscose, bamboo, etc. are capturing their share in the clothing market. Comfort is a major concern in textile and clothing industries and is generally called “the absence of unpleasantness.” Comfort has three different types i.e., psychological comfort (concerned with the mind), thermo-physiological comfort (concerned with air permeability, moisture, and heat balance), and sensorial (tactile) comfort (Bhatia and Malhotra Citation2016). Fiber and fabric structures have a foremost impact on the thermal balance of the body. Various factors determine the comfort performance of the fabric, including the fibers, yarn, weave, and finishes applied during their production. In addition, it refers to the comfort that a person is experiencing while running, walking, exercising, playing sports, and sleeping.
(AKGUN et al. Citation2020) made the Turkish Buldan woven fabric with 100% cotton fibers and cotton/tencel blends and investigated their thermo-physiological properties. The results showed that the comfort properties of both 100% cotton and cotton/tencel blend were comparable, except the lowest thermal absorptivity was shown by 100% cotton fabric. (Abro et al. Citation2018) studied the air permeability (AP) and thermal properties of plain-woven fabric produced by cotton and regenerated bamboo fibers. Seven different types of blended yarns were developed, and the results showed that the AP of 100% bamboo fiber-based fabric was higher than other blends, while 50:50 bamboo: cotton fabric showed the highest heat retention and thermal conductivity.
(Umair et al. Citation2016a) developed six different woven fabrics having two weave designs (1/1 plain and 3/1 twill), and three picking sequences i.e., single pick insertion (SPI), double pick insertion (DPI), and three pick insertion (3PI). Improved air permeability, a lower amount of wetting time as well as significant improvement in the spreading rate of the water and overall moisture management capability (OMMC) were observed in 3/1 twill woven fabrics with 3PI in comparison with 1/1 plain woven fabrics having SPI or DPI. (Maqsood et al. Citation2016) used three different weaves i.e., 3/1 twill, 2/1 twill, and 1/1 plain, and different thread densities to develop different woven fabrics, and compared their mechanical and comfort properties. Weave float has direct relation, while thread density has an inverse relation with the air permeability of woven fabrics. Also, shorter floats with higher thread densities is a better combination in woven fabrics to increase their water barrier effectiveness for the surgical gown.
(Atalie et al. Citation2021) developed the four woven fabrics with bleached cotton, different counts, twist/inch, neps, hairiness, thick and thin places, strength, and elongation, and compared their thermal and water vapor permeability properties. Statistical analysis revealed that thermal resistivity, absorptivity, and air permeability results were statistically significant, while water vapor permeability and thermal diffusivity results were statistically insignificant (Atalie and Kipchirchir Rotich Citation2020; Atalie et al. Citation2021; Desalegn and Rotich Citation2021). (Umair et al. Citation2017) studied the effect of yarn twist, yarn type (carded/combed), and weave designs (plain and twill) on different properties of woven fabrics, i.e., bending modulus, shrinkage, areal density, flexural rigidity, and thickness, and optimized these results using the principal component analysis. Yarn twist and weave design showed a statistically significant effect on different properties, while the yarn-type effect was statistically insignificant.
(Basit et al. Citation2019) compared the mechanical and thermo-physiological comfort properties of bamboo, lyocell, viscose, and modal fibers and their blends-based woven fabrics and tried to find an alternative to cotton fabrics. It was concluded that tencel blended fabrics showed improved mechanical and comfort properties in comparison with other fiber blends and cotton, and it would be a better replacement for 100% cotton yarn-based woven fabrics. (Bilen Citation2021) studied the performance and thermal comfort of cotton, linen, viscose, and lyocell blended yarn-based woven fabrics and revealed that with the increase in linen percentage air permeability, bending and shear ability of fabrics was improved.
(Ozdemir Citation2017) developed modal and lyocell-based woven fabrics with different weave designs (Plain, 2/2 twills, 1/3 twill, 2/2 matt) and yarn linear densities (18, 22, 26) and concluded that by increasing weft yarn density, porosity, air permeability, and wicking properties were reduced. Meanwhile, lyocell fabrics showed improved air permeability and wicking properties over modal fabrics. Also, polyester/cotton blended yarn-based fabrics were developed with different weave designs and fiber percentages and revealed that sateen and compound weave designs showed higher thermal resistance feasible for cold conditions.
(Shaker et al. Citation2015) used an orthogonal Taguchi design to optimize weaving parameters based on signal-to-noise ratios. A conclusion was made that by the usage of medium temple types as well as intense take-up pressing tensions at the lower warp tensions and a smaller working width of the loom, we can produce a maximum width of fabric. Based on the analysis of variance results, it was concluded that the size of the temple needle plays a statistically significant role as it has a major impact on the width of the fabric, whereas the least effect on fabric width was shown by pressing tension. (Nazir et al. Citation2017) studied the effect of weave design (2/2 and 3/1 twills) and four different materials (cotton, polyester, micro-polyester, and nylon) on the thermo-physiological comfort properties of bilayer woven fabrics. The results showed that cotton fabrics showed the highest air permeability while 3/1 twill showed the least value of thermal resistance as compared to the 2/2 twill in both layers.
Previously different studies reported on the thermo-physiological comfort properties of different cellulosic material-based woven fabrics with different weave designs, but as per the author’s knowledge, no specific work has been reported on the comparison of thermophysiological comfort properties of cotton, tencel, viscose, and bamboo fibers in warp rib and plain-woven fabrics. For this purpose, air permeability, thermal resistance, water vapor permeability index, and overall moisture management capability (OMMC) tests were performed. The objective of this study is to compare thermo-physiological comfort properties of cotton, tencel, viscose, and bamboo fibers-based woven fabric with different weave designs. The significance of the present work is to develop such fabrics for athletes, which will provide more comfort and enhance their performance.
Materials and methods
Cotton, tencel, viscose, and bamboo fibers with a fiber fineness of 4.75 micronaire, 1.20 denier, 1.20 denier, and 1.20 denier, respectively, were employed to generate their corresponding spun yarns with a linear density of 40/1 Ne (14.76 tex). Using the Ring spinning technique, four different cellulosic material-based combed compact yarns were developed. shows nominal and real yarn linear densities, twist per inch (TPI), and USTER Tester 5 testing results. These yarns were sized with Polyvinyl alcohol (PVA) to reduce breakage on the weaving machine during the development of woven fabric samples.
Table 1. Yarn testing results.
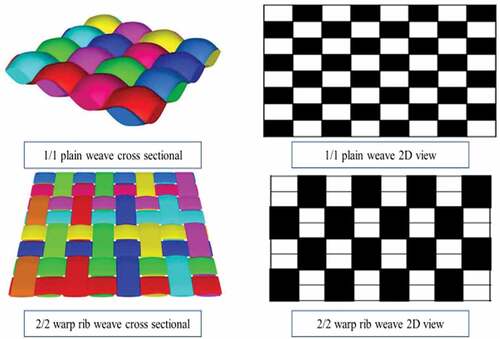
PVA was used to size the warp yarn using the single-end sizing machine (SS565, CCI Tech Inc.), followed by the preparation of the warping beam on the sectional warping machine (SW550, CCI Tech Inc.). Eight (08) woven fabric samples with two different weave designs i.e., 1/1/plain and 2/2 warp rib and four different yarns (cotton, viscose, bamboo, and tencel) were produced on the rapier dobby weaving machine (Evergreen, CCI Tech Inc.). Furthermore, ends/inch (80) and picks/inch (80) were finalized to weave different samples. Weave designs and schematic cross-sectional views (developed by using TexGen® software) of woven fabrics are provided in .
Figure 1. Cross sectional views and weave designs of woven fabrics.
Later on, enzymatic desizing of woven fabric samples was done using a Mini-Jet desizing machine. The temperature was maintained at 70°C for 45 min for the complete desizing of woven fabric samples. The desizing of a woven fabric is a necessary step before testing the fabric samples to remove the effect of size material during testing. Microscopic images of the desized fabric samples are given in . Sample codes, ends/inch, and picks/inch before and after desizing, and desized fabric areal density are given in .
Figure 2. Microscopic images of woven fabrics.
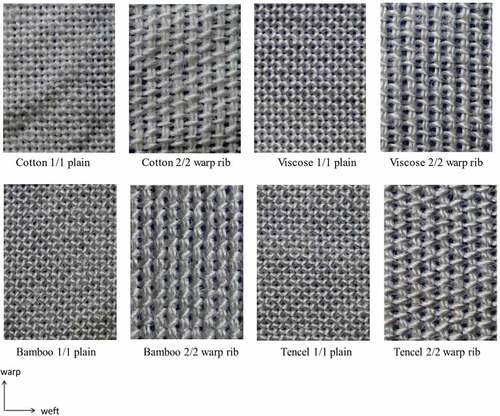
Table 2. Specifications of woven fabrics before and after desizing.
Five (05) different types of tests (volume porosity, air permeability (AP), thermal resistance, water vapor permeability index, and overall moisture management capability (OMMC)) were performed to assess the comfort properties of eight (08) woven fabric samples. First, the conditioning of these samples was done as per ASTM D1776 testing procedure. The volume porosity (porosity %) of the fabric samples is calculated using EquationEquation 1(1)
(1) .
Where, Wa represents the areal density (kg/m2), and t denotes the thickness of fabric (m), while ρf indicates the density of fiber (kg/m3).
The air permeability of the samples was determined using the AP tester SDL ATLAS M0201A, by following the (ASTM D Citation1996) standard method. A circular sample with an area of 20 cm2 was mounted on a circular sample holder, and a pressure of 100 Pa was used to pass air from the woven fabric sample to measure its air permeability. The thermal resistance of woven fabrics was determined using Permetest equipment by following (BS EN ISO Citation2014) test method. The water vapor permeability index was carried out on a water vapor permeability tester (TF165A) using the ISO BS 7209 standard test method. The overall moisture management capability (OMMC) of the samples was assessed by following (AATCC Citation2012) test method using Moisture Management Tester (MMT) M219. This tester contains two sets (upper and lower) of concentric pins and a sample of 8 × 8 cm2 was placed between these two sets. Minitab 18® software was used to conduct a statistical analysis of the testing results.
Results and discussions
Volume porosity (%)
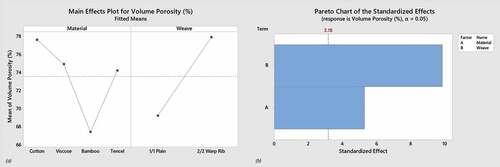
The porosity is a property used to check the void space volume within the boundaries of the material. The volume porosity of woven fabric depends upon the structure of the fiber, space within the fiber, space between the fibers, yarn-to-yarn spacing, and interlacement pattern. The calculations of volume porosity % for eight different cellulosic fabrics are given in . In four different cellulosic materials, cotton fabrics showed the highest values of volume porosity % followed by viscose, tencel, and bamboo woven fabrics. While within the two weave designs, the 2/2 warp rib showed a higher value of volume porosity % as compared to the 1/1 plain woven fabric. Furthermore, considering the combination of two factors, cotton fabric with 2/2 warp rib showed the highest value of porosity % followed by viscose, tencel, and bamboo fabrics with 2/2 warp rib weave design, respectively.
Table 3. Calculations and results of volume porosity % of woven fabric samples.
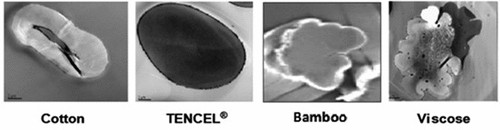
Shape factor, cross section and density of fiber, and areal density of fabric are the major reasons behind this trend of volume porosity results. Since cotton is a natural fiber while the other three are regenerated fibers, it has a more porous structure resulting in more inter-yarn spaces while bamboo fiber has the least spaces. The cross-sectional views of these fibers are shown in (Lewin Citation2007). Also, a higher shape factor means a higher surface area of the fabrics and a closer and more compact packing of the fibers resulting in lower inter-yarn spaces.
Figure 3. Cross-sectional views of fibers.
The results showed that the porosity % of cotton, viscose, bamboo, and tencel fabrics with 2/2 warp rib weave was 11%, 13%, 12%, and 8% higher with 1/1 plain fabrics, respectively. Furthermore, cotton fabrics showed 3% higher porosity % than viscose fabrics, while viscose fabrics showed 10% higher porosity % values than bamboo fabrics, but tencel and viscose have almost equal and comparable volume porosity %. Overall, in four different cellulosic materials, 1/1 plain weave showed less porosity % because 1/1 plain weave has less spaces between the yarns and its weave structure has shorter float length making it compact, while 2/2 warp rib showed higher porosity % due to higher float length and less compactness (Maqsood et al. Citation2015). Also, the areal densities of plain-woven fabrics were higher than warp rib fabrics, which justifies the lower volume porosity % of plain fabrics with different materials.
Statistical analysis
Statistical analysis results showed that the effect of different cellulosic materials (cotton, viscose, bamboo, and tencel) and weave designs (1/1 plain and 2/2 warp rib) on the volume porosity % was found to be statistically significant as the p-values for both factors i.e., material and weave designs were less than 0.05. P-values for material and weave design were 0.013 and 0.002, respectively, while R-square was 98.27%. The P-value of the weave design was less than the p-value of the material showing more statistical significance of weave designs on porosity %. Furthermore, the R-square (coefficient of determination) for the volume porosity % result was more than 98%. The higher the R-square percentage during statistical analysis, the higher will be the accuracy and dependencies of the model.
The main effect plot and Pareto chart for volume porosity % are shown in , respectively. The main effect plot displayed the effect of different types of cellulosic material and weave designs on volume porosity %. The Pareto chart endorsed the p-values of both factors. The weave design color line was far across the red/cutting line of significance as compared to the material color line. It showed that weave design has a more statistically significant effect on porosity % as compared to cellulosic material.
Figure 4. (a) Main effect plot and (b) Pareto chart for volume porosity %.
Air permeability
Air permeability (AP) is a complex property that depends upon the different factors of fabric. This may include fiber fineness, fiber length, fiber cross-section, weave design, and surface area. Air permeability results of different cellulosic fabrics are shown in . The results showed that the value of air permeability was maximum for cotton fabrics and the minimum for viscose fabrics. Furthermore, tencel and bamboo came at two and three, respectively. In a comparison of two weaves (1/1 plain and 2/2 warp rib), 2/2 warp rib showed higher values of AP due to a smaller number of intersections per unit area and longer float length as shown in . Cotton, viscose, bamboo, and tencel fabrics with 2/2 warp rib weave design showed 41%, 43%, 60%, and 52% higher values of air permeability as compared to the 1/1 plain weave design fabrics, respectively (AYGÜN Citation2022).
Figure 5. Air permeability results of woven fabric samples.
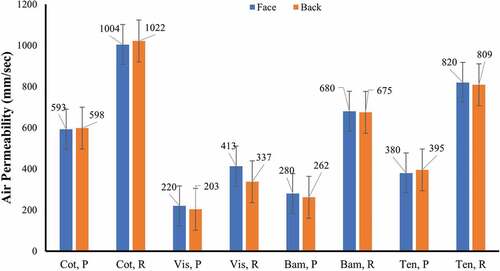
There are a number of logical reasons to prove this behavior of air permeability, but some of them are more accurately related to the results. Tencel, bamboo, and viscose are regenerated fibers, while cotton is a natural fiber. No doubt, the cotton properties vary a lot, but the tencel has similar properties to cotton. The cross-sectional views of these four different fibers are shown in . The shape factor of the fiber can be related to the cross-section of the specific fiber. The shape factor value will be equal to 1 if a certain fiber has an exactly circular cross-section and will increase as the cross-section becomes irregular. With the increase in the shape factor, the specific surface area of a fiber increases. This will make the fibers closer to each other by increasing the compactness of fibers within the yarn resulting in a decrease in inter-yarn spaces. The extremely irregular cross-section of the viscose fiber resulted in an increase in its specific surface area and tight packing of the fibers in a yarn structure, resulting in lower air permeability values in viscose-based woven fabrics. In comparison with the viscose fiber cross-section, bamboo fiber has a little bit fewer irregularities in its cross-section, which is why its value of AP is higher than viscose (Mevlut and Vaughn Citation2008). Tencel has the most regular cross-section within the three regenerated fibers. That is why it showed a higher value of AP than viscose and bamboo-based woven fabrics. Cotton has an almost uniform cross-section, which is why it showed the highest value of AP.
Statistical analysis
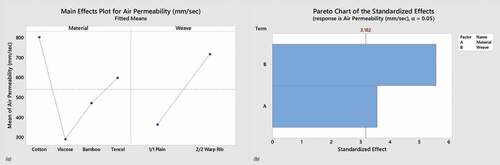
Statistical analysis results showed that both factors i.e., cellulosic material (cotton, viscose, bamboo, and tencel) and weave designs (1/1 plain and 2/2 warp rib) showed statistical significance on the AP values of fabrics as the p-values for both factors were less than 0.05. P-values for material and weave design were 0.038 and 0.011, respectively. The p-value of the weave design was much less than the p-value of the cellulose material, showing more statistical significance of weave designs on air permeability. Still, the p-value of cellulose material was less than 0.05 highlighting that it showed a statistically significant effect on AP results. Furthermore, the R-square (coefficient of determination) for AP results was 95.61%, which showed that the factors included in the study 95.61% satisfy the AP results. The higher the R-square percentage during statistical analysis, the higher will be the accuracy and dependencies of the model.
The main effect plot and Pareto chart for air permeability are shown in , respectively. The main effect plot displayed the effect of different types of cellulosic material and weave designs on air permeability. The Pareto chart endorsed the p-values of both factors. The weave design color line was far across the red/cutting line of significance while the material color line was near the significance red line. It showed that weave design shows a more statistically significant effect on AP than cellulosic material.
Figure 6. (a) Main effect plot and (b) Pareto chart for air permeability.
Thermal resistance
Thermal resistance results of the eight different woven fabric samples are provided in . Within the four different cellulosic fabrics, cotton fabric showed the highest value of thermal resistance followed by bamboo fabric, while viscose and tencel fabrics showed the least and equal values of thermal resistance. Also, 2/2 warp rib weave design-based fabrics showed a higher value of thermal resistance than the 1/1 plain woven fabrics. Thermal resistance results of woven fabric depending upon weave design can be explained by the volume porosity % and air permeability results of these fabrics. Since volume porosity % and air permeability of 2/2 warp rib woven fabrics were higher than 1/1 plain woven fabrics. The higher the porosity %, the higher will be the air permeability resulting in more air will be trapped in the structure within the fibers and yarns and their corresponding woven structure. That is why 2/2 warp rib showed higher thermal resistance than 1/1 plain woven fabrics.
Figure 7. Thermal resistance results of woven fabric samples.
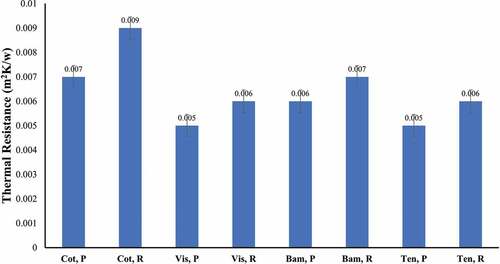
Cotton, viscose, bamboo, and tencel fabrics with 2/2 warp rib weave design showed 22%, 16%, 14%, and 16% higher values of thermal resistance than 1/1 plain weave design, respectively. This trend of results can be explained by moisture regain, fiber structure, and crystallinity in it (Nazir et al. Citation2022). The moisture regain values of the constituent fibers in this study are all different. Cotton has the lowest moisture regain (8.5%), while all other fibers have moisture regains between 11% and 16% (Gerard and Pott GT Citation2004). As a result, when cotton fibers were exposed to typical air conditions according to ASTM D 1776, they swelled the least. The existence of air between individual fibers was ensured by the least swelling of cotton fibers. Because air is a good heat insulator, thermal resistance is maintained at a high level. As a result, when air is trapped between intrafibers, the thermal resistance of these fibers increases (Chidambaram and Govindan Citation2012; Latif et al. Citation2018).
Secondly, cotton fibers have convolutions in their structure. When these convoluted fibers are converted into their corresponding yarns, the air is entrapped in these convolutions. Consequently, fabric produced from such yarns showed greater thermal resistance, which is the second explanation for the higher thermal resistance of cotton fibers in comparison with all others.
The amorphous and crystalline regions of the fibers also affect the thermal resistance of their corresponding fabrics. The lower the crystalline region of the fiber, the lower will be the alignment of the fibers, which will obstruct the efficient flow of heat and will take lead to the lower thermal resistance of fibers. Therefore, it can be presumed that a lower crystalline region will result in lower thermal resistance (Carrillo et al. Citation2004). Among these fibers, cotton showed a higher percentage of the crystalline region i.e., 64%. Thus, cotton has higher thermal resistance as compared to other cellulosic fibers. The crystallinity of viscose and bamboo fibers is 31% and 52%, respectively (Yueping Citation2010).
Statistical analysis
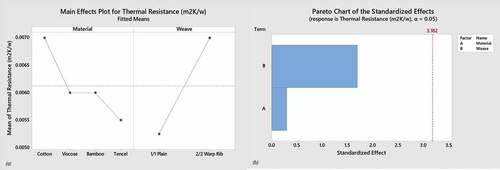
Based on the statistical analysis of thermal resistance results, the effect of different cellulosic materials (cotton, viscose, bamboo, and tencel) and weave designs (1/1 plain and 2/2 warp rib) on the thermal resistance was found to be statistically insignificant as the p-values for both factors i.e., material and weave designs were more than 0.05. P-values for material and weave design were 0.781 and 0.188, respectively. The p-value of the weave design was less than the p-value of the material showing that thermal resistance changes with the change of weave design but still this effect is statistically insignificant. Furthermore, the R-square (coefficient of determination) for the thermal resistance result was 57.14%, which showed the dependency of the model. Even if these results are statistically insignificant, they are justified for multiple reasons for moisture regain, convolutions, and amorphous/crystalline region of fibers.
The main effect plot and Pareto chart for thermal resistance results are shown in , respectively. The main effect plot displayed the effect of different types of cellulosic material and weave designs on thermal resistance. Thermal resistance changes with the change in weave design and cellulosic material, but their effect is not statistically significant. The Pareto chart endorsed the p-values of both factors. Weave design and material color lines were far behind the red/cutting line of significance. However, the material effect is more insignificant as compared to the weave design.
Figure 8. (a) Main effect plot and (b) Pareto chart for thermal resistance.
Water vapor permeability index (WVPI)
The water vapor permeability index results of the eight woven fabric samples are given in . Within the four different cellulosic fabrics, the tencel fabric showed the highest value of water vapor permeability index followed by cotton, bamboo, and viscose fabrics, respectively. Furthermore, 1/1 plain woven fabrics showed a higher water vapor permeability index than 2/2 warp rib weave designs in all fabric samples. Tencel, cotton, bamboo, and viscose fabrics with 1/1 plain weave design showed 3%, 3%, 3.6%, and 2% higher values of WVPI than design 2/2 warp rib weave design, respectively.
Figure 9. Water vapor permeability index results of woven fabric samples.
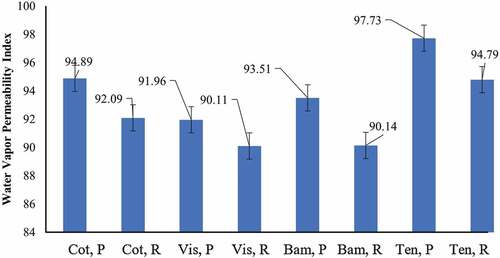
This trend of results can be related to the help of moisture regain of the fibers, volume porosity, and air permeability. Moisture regain % of cotton, viscose, tencel, and bamboo fibers is 8.5%, 11–12%, 13%, and 11–16%, respectively. The water vapor permeability index refers to the rate of water vapor transmission through the flat area of the fabric. The highest value of WVPI was shown by the tencel fabric followed by cotton, bamboo, and viscose fabrics, respectively. Tencel fabric showed a higher loss in total weight after the complete test followed by cotton, bamboo, and viscose fabrics. Furthermore, the wicking properties of individual fibers also affect the WVPI results.
Statistical analysis
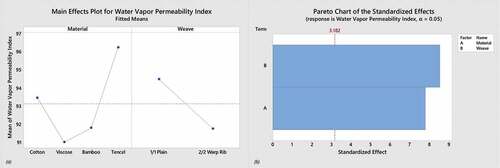
Statistical analysis results showed that the effect of different cellulosic materials (cotton, viscose, bamboo, and tencel) and weave designs (1/1 plain and 2/2 warp rib) on the water vapor permeability index was found to be statistically significant as the p-values for both factors i.e., material and weave designs were less than 0.05. p-values for material and weave design were 0.004 and 0.003, respectively, while R-square was 98.71%. The p-value of the weave design was less than the p-value of the material, showing more statistical significance of weave designs on WVPI. Furthermore, the R-square (coefficient of determination) for the WVPI result was more than 98%. The higher the R-square percentage during statistical analysis, the higher will be the accuracy and dependencies of the model.
The main effect plot and Pareto chart for the water vapor permeability index are shown in , respectively. The main effect plot displayed the effect of different types of cellulosic material and weave designs on WVPI, while the Pareto chart endorsed the p-values of both factors. The weave design color line was far across the red/cutting line of significance as compared to the material color line. It showed that weave design has a more statistically significant effect on WVPI results as compared to cellulosic material.
Figure 10. (a) Main effect plot and (b) Pareto chart for water vapor permeability index.
Moisture management test
Moisture management refers to the controlled passage of liquid through the fabric from the surface of the skin to the environment. Moisture management is vital in increasing performance and optimizing fabric comfort properties. It adjusts the body temperature to match the ambient temperature. Heat and moisture are used to raise the core temperature of the body to the highest potential level of comfort management. Moisture management of the fabric is influenced by several characteristics. Wetting time, absorption rate, spreading speed, and overall moisture management capability (OMMC) are some of these characteristics (Nazir et al. Citation2017, Citation2022; Umair et al. Citation2016b). Moisture management testing results of eight different fabric samples are given in .
Figure 11. (a) Wetting time (b) absorption rate (c) spreading speed (d) OMMC results of woven fabric samples.
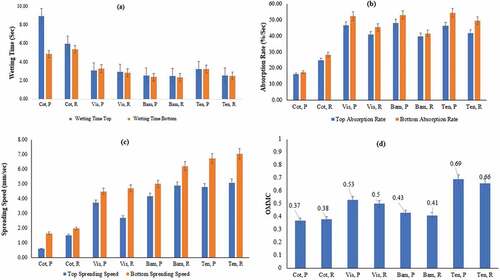
The ability of a fiber to absorb moisture is determined by two factors i.e., hydrogen bonding and the availability of open space to accommodate moisture. As a result, every fiber that absorbs moisture must possess these two characteristics. All the fibers included in this study have the ability to create hydrogen bonds, which equalizes them all. But then there is the question of which fiber has the most room to accommodate moisture. However, all these fibers have amorphous and crystalline sections. Cotton has the highest crystallinity in comparison with others. Fiber properties were significantly altered as a result of the high crystallinity. High crystallinity minimizes the amount of space available in a structure for moisture to enter. As a result, a fabric consisting of cotton fibers will take longer to get wet than other fabrics (Nazir et al. Citation2017, Citation2022). shows the wetting time at the top and bottom of various materials, demonstrating this pattern. As a result, higher crystallinity causes higher wetting time, demonstrating a clear relationship between the two.
Compared with other fibers, cotton fibers have shorter staple lengths. As a result, cotton required a higher twist per inch to produce a similar yarn to others, resulting in an increase in yarn compactness with better fiber orientation and alignment. The intra-yarn-free spaces and chances of moisture accommodation in the yarn structure will be reduced. As a result, the cotton yarn has the least absorption rate among the four different fibers. shows the trend of absorption rate results of different woven fabrics.
Cotton fiber has the lowest moisture regain of all fibers. Moisture regain demonstrates these fibers’ attraction toward moisture. As a result, fibers with higher moisture regain have a higher affinity for moisture and vice versa. This affinity influenced the qualities of the finished fabrics. Moisture spreads rapidly and quickly in fabrics with high moisture regain, and vice versa. shows the spreading speed results of the different fabrics. Cotton fabric has the lowest moisture regain resulting in the lowest value of spreading speed top and bottom, whereas tencel has the highest moisture regain and its corresponding spreading speed.
The spread of moisture can also be explained by a cross-section of the constituent fibers. Cotton fibers have convolutions in their structure, which trap the moisture in them, hindering capillary action throughout the structure. When such fabric is tested, the irregular capillaries cause the moisture to spread very slowly. Conversely, the tencel fiber has a regular cross-sectional view. This results in the formation of regular capillaries, which support moisture flow at maximum speed. Bamboo and viscose fibers have irregular cross-sectional views, which slow down their spreading speeds as compared to tencel. Cotton fibers have a shorter staple length than other fibers, thus a greater twist has been applied to create a yarn with equivalent properties. This greater twist caused a larger zig-zag route or capillaries to the cotton yarn structure, obstructing the smooth passage of moisture and lowering its spreading speed.
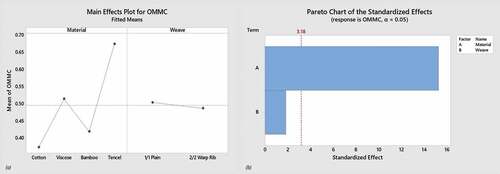
shows the overall moisture management capability results of woven fabric samples. The tencel, bamboo, and viscose with 1/1 plain fabric showed 4.3%, 4.6%, and 5.6% higher OMMC values than 2/2 warp rib woven fabric, respectively. OMMC values of cotton fabric were similar in both weave designs. Tencel has the highest moisture regulation characteristics, whereas cotton has the least moisture management.
Statistical analysis
provides the analysis of variance results of all evaluated parameters during the moisture management test. Results showed that cellulosic material had a statistically significant effect on moisture management properties with p-values less than 0.05 for each parameter except absorption rate bottom. Different weave designs showed a statistically insignificant effect on moisture management properties with a p-value of more than 0.05 for each parameter. Furthermore, the R-square (coefficient of determination) of moisture management results is given in . The higher the R-square percentage during statistical analysis, the higher will be the accuracy and dependencies of the model. Furthermore, the R-square (coefficient of determination) for the OMMC result was more than 95%.
Table 4. Analysis of variance results for moisture management test results.
Table 5. Model summaries for moisture management test results.
The main effect plots and Pareto charts for wetting time (top and bottom), absorption rate (top and bottom), spreading speed (top and bottom), and OMMC are shown in , respectively. The main effect plot displayed the effect of different types of cellulosic material and weave designs on moisture management test results. The Pareto chart endorsed the p-values of both factors.
Figure 12. (a) Main effect plot and (b) Pareto chart for wetting time top, and (c) Main effect plot and (d) Pareto chart for wetting time bottom.
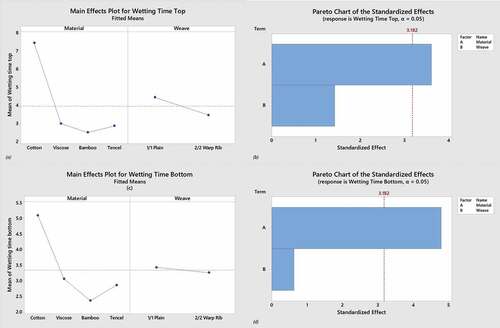
Figure 13. (a) Main effect plot and (b) Pareto chart for absorption rate (%) top, and (c) Main effect plot and (d) Pareto chart for absorption rate (%) bottom.
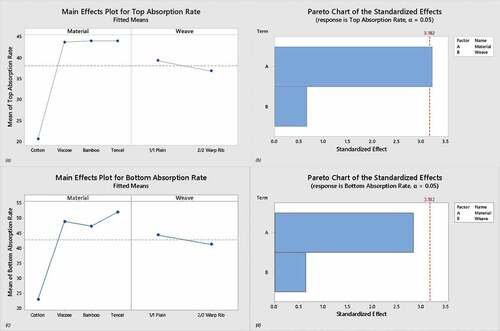
Figure 14. (a) Main effect plot and (b) Pareto chart for spreading speed top, and (c) Main effect plot and (d) Pareto chart for spreading speed bottom.
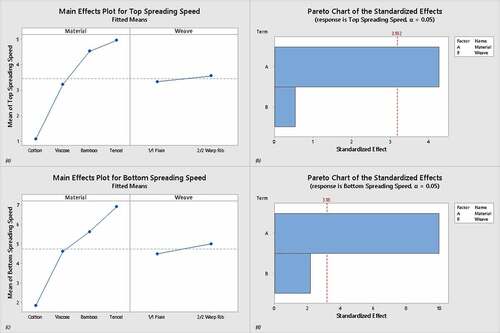
Figure 15. (a) Main effect plot and (b) Pareto chart for OMMC.
Conclusions
In this work eight (08) different woven fabrics were developed with four cellulosic yarns (cotton, viscose, bamboo, and tencel) and two weave designs (1/1 plain and 2/2 warp rib). Different tests i.e., volume porosity %, air permeability (AP), thermal resistance, water vapor permeability index (WVPI), and overall moisture management capability (OMMC) were performed to compare their thermophysiological comfort properties.
Cotton fabric showed the highest value of volume porosity % followed by the tencel, viscose, and bamboo fabrics, respectively, while 2/2 warp rib-based fabric showed the higher volume porosity % as compared to the 1/1 plain weave fabrics. The p-values of both factors (material and weave) were less than 0.05 which showed that both factors have a statistically significant effect on volume porosity %. Also, cotton fabric showed the highest air permeability value followed by tencel, bamboo, and viscose fabrics due to convolutions and regular cross-section of the cotton fiber. Weave design showed a similar trend of air permeability resulting in volume porosity %. The 2/2 warp rib showed higher AP values than the 1/1 plain woven fabric due to its longer float length. The p-value for the weave design was less than 0.05 which showed its statistical significance on air permeability results. Cotton fabrics also showed the highest value of thermal resistance followed by bamboo fabrics. Meanwhile, viscose and tencel fabrics showed equal and lowest values of thermal resistance.
Moreover, tencel and cotton showed the highest and most comparable values of the water vapor permeability index (WVPI). While bamboo and viscose showed the least comparable values of WVPI. Within two weave designs, 1/1 plain woven fabrics showed a higher value of WVPI in comparison with 2/2 warp rib. p-values showed that both factors (weave and cellulosic material) showed a statistically significant effect on WVPI results. Furthermore, the tencel fabric showed the highest value of OMMC during the moisture management test (MMT) followed by the viscose, bamboo, and cotton fabrics, respectively. The 1/1 plain woven fabric showed a higher value of OMMC in comparison with the 2/2 warp rib. Convolutions, irregular cross-sections, and moisture regain of cotton fabrics were the major reasons for their lower OMMC values. Therefore, it can be concluded that tencel fiber is a better choice due to its improved moisture management and comfort properties.
Highlights
Four different cellulosic yarns (cotton, bamboo, viscose, and tencel) and two weave designs (1/1 plain and 2/2 warp rib) were used to develop eight (8) woven fabrics with equal thread densities.
Volume porosity %, air permeability, thermal resistance, water vapor permeability index, and moisture management properties of the developed woven fabrics were analyzed.
Tencel fabrics showed the highest water vapor permeability index and overall moisture management capability (OMMC) values as compared to other cellulosic materials. Cotton fabrics showed the highest values of volume porosity %, air permeability, and thermal resistance as compared to the other materials.
Also, within the two weave designs, the 2/2 warp rib weave design showed higher values of volume porosity %, air permeability and thermal resistance in comparison with 1/1 plain woven fabrics. Water vapor permeability index and OMMC values were higher in 1/1 plain woven fabrics.
The full factorial statistical design of the experiment was used to check the statistical significance of both factors (cellulose material and weave design) on volume porosity %, air permeability, thermal resistance, water vapor permeability index, and moisture management results.
From this study, it is concluded that the tencel fabrics can be used in hot summer season, while cotton fabrics can be preferred in the winter season with different weave designs.
Acknowledgement
The authors are thankful to Mr. Ali Hamza for helping in practical work.
Disclosure statement
No potential conflict of interest was reported by the authors.
Additional information
Funding
References
- AATCC 195. 2012. Liquid moisture management properties of textile fabrics.
- Abro, Z. A., N. Chen, Z. Yifan, H. Cheng-Yu, A. Malik Rehan Abassi, A. Ahmed Simair, R. Ahmed, and A. Hussain. 2018. Investigation on thermal comfort characteristics of regenerated bamboo and cotton woven structured fabrics. AUTEX Research Journal 18 (4):323–18. doi:10.1515/aut-2018-0017.
- AKGUN, M. I. N. E., G. K. GUNAYDIN, A. Y. Ç. A. GÜRARDA, and E. K. ÇEVEN. 2020. Investigation of the comfort properties of traditional woven fabrics with different structural parameters. Industria Textila 71 (04):302–08. doi:10.35530/it.071.04.1701.
- ASTM D737. 1996. Standard method of test for air permeability of textile fabrics.
- Atalie, D., R. Gideon, G. Melesse, E. Ferede, F. Getnet, and A. Nibret. 2021. Thermo-physiological comfort of half bleached woven fabrics made from different cotton yarns parameters. Journal of Natural Fibers 19 (13):1–16. Taylor & Francis. doi:10.1080/15440478.2021.1875351.
- Atalie, D., and G. Kipchirchir Rotich. 2020. Impact of cotton parameters on sensorial comfort of woven fabrics. Research Journal of Textile and Apparel 24 (3):281–302. doi:10.1108/RJTA-01-2020-0004.
- AYGÜN, H. H. 2022. Effect of pattern on air permeability, mechanical resistance and thickness of wovens. International Advanced Researches and Engineering Journal 6 (1):26–33. doi:10.35860/iarej.997843.
- Basit, A., W. Latif, M. Ashraf, A. Rehman, K. Iqbal, H. Shahzad Maqsood, A. Jabbar, and S. Ahmad Baig. 2019. Comparison of mechanical and thermal comfort properties of tencel blended with regenerated fibers and cotton woven fabrics. AUTEX Research Journal 19 (1):80–85. doi:10.1515/aut-2018-0035.
- Bhatia, D., and U. Malhotra. 2016. Thermophysiological wear comfort of clothing: An overview. Journal of Textile Science & Engineering 06 (02):250. doi:10.4172/2165-8064.1000250.
- Bilen, U. 2021. The effect of linen and linen blends on the comfort properties of bedding fabrics. Journal of Natural Fibers 18 (3):430–41. Taylor & Francis. doi:10.1080/15440478.2019.1624997.
- BS EN ISO 11092. 2014. Textiles – physiological effects – measurement of thermal and water-vapour resistance under steady-state conditions (sweating guarded-hotplate test).
- Carrillo, F., X. Colom, J. J. Su, and J. Saurina. 2004. EUROPEAN POLYMER structural FTIR analysis and thermal characterisation of Lyocell and Viscose-type fibres. European Polymer Journal 40 (9):2229–34. doi:10.1016/j.eurpolymj.2004.05.003.
- Chidambaram, P., and R. Govindan. 2012. Influence of blend ratio on thermal properties of bamboo/cotton blended woven fabrics. Science, Engineering and Health Studies 6 (2):49–55.
- Desalegn, A., and G. K. Rotich. 2021. The influence of yarn parameters on thermo-physiological comfort of cotton woven fabrics. Journal of Thermal Analysis and Calorimetry 146 (5):2035–47. Springer International Publishing. doi:10.1007/s10973-020-10454-y.
- Gerard, T. P. 2004. Natural fibers with low moisture sensitivity. In Natural fibers, plastics and composites, ed. Pott GT. Boston, MA:: Kluwer Academic Publishers.
- Latif, W., A. Basit, S. Ahmad Baig, Z. Ali, Z. Ali, S. Ahmad Baig, W. Latif, and A. Basit. 2018. Woven fabrics the mechanical and comfort properties of cotton and regenerated fibers blended woven fabrics. International Journal of Clothing Science and Technology 30 (1):112–21. doi:10.1108/IJCST-07-2017-0101.
- Lewin, M. 2007. Handbook of fiber chemistry. 3rd ed. CRC Press Taylor & Francis Group. doi:10.1017/CBO9781107415324.004.
- Maqsood, M., Y. Nawab, K. Shaker, M. Umair, M. Ashraf, D. Mahmood Baitab, S. Talha Ali Hamdani, and S. Shahid. 2016. Modelling the effect of weave structure and fabric thread density on mechanical and comfort properties of woven fabrics. AUTEX Research Journal 16 (3):160–64. doi:10.1515/aut-2015-0032.
- Maqsood, M., Y. Nawab, S. Talha, A. Hamdani, M. Umair, and W. Ashraf. 2015. Modeling the effect of weave structure and fabric thread density on the barrier effectiveness of woven surgical gowns 5000 (December). The Journal of the Textile Institute 107(7):873–78. doi: 10.1080/00405000.2015.1070027.
- Mevlut, T., and E. A. Vaughn. 2008. Effects of fiber denier, fiber cross-sectional shape and fabric density on acoustical behavior of vertically lapped nonwoven fabrics. Journal of Engineered Fibers and Fabrics 3 (2):155892500800300. doi:10.1177/155892500800300206.
- Nazir, M. U., K. Shaker, Y. Nawab, S. Talha Ali Hamdani, H. Muhammad Abdullah, and M. Umair. 2022. Thermo-physiological comfort of woven fabrics made from different cellulosic yarns. Journal of Natural Fibers 19 (11):4050–62. Taylor & Francis. doi:10.1080/15440478.2020.1852997.
- Nazir, M. U., K. Shaker, Y. Nawab, M. Zohaib Fazal, M. Imran Khan, and M. Umair. 2017. Investigating the effect of material and weave design on comfort properties of bilayer-woven fabrics. The Journal of the Textile Institute 108 (8):1319–26. doi:10.1080/00405000.2016.1247616.
- Ozdemir, H. 2017. Permeability and wicking properties of modal and lyocell woven fabrics used for clothing. Journal of Engineered Fibers and Fabrics 12 (1):12–21. doi:10.1177/155892501701200102.
- Shaker, K., M. Umair, M. Maqsood, Y. Nawab, S. Ahmad, A. Rasheed, M. Ashraf, and A. Basit. 2015. A statistical approach for obtaining the controlled woven fabric width. AUTEX Research Journal 15 (4):275–79. doi:10.1515/aut-2015-0008.
- Umair, M., T. Hussain, K. Shaker, Y. Nawab, M. Maqsood, and M. Jabbar. 2016a. Effect of woven fabric structure on the air permeability and moisture management properties. The Journal of the Textile Institute 107 (5):596–605. doi:10.1080/00405000.2015.1054124.
- Umair, M., T. Hussain, K. Shaker, Y. Nawab, M. Maqsood, and M. Jabbar. 2016b. Effect of woven fabric structure on the air permeability and moisture management properties. The Journal of the Textile Institute 107 (5):596–605. doi:10.1080/00405000.2015.1054124.
- Umair, M., K. Shaker, N. Ahmad, M. Hussain, M. Jabbar, and Y. Nawab. 2017. Simultaneous optimization of woven fabric properties using principal component analysis. Journal of Natural Fibers 14 (6):846–57. Taylor & Francis. doi:10.1080/15440478.2017.1279994.
- Yueping, W. 2010. Structures of bamboo fiber for textiles abstract. Textile Research Journal 80 (4):334–343 . doi:10.1177/0040517509337633.