
 ?Mathematical formulae have been encoded as MathML and are displayed in this HTML version using MathJax in order to improve their display. Uncheck the box to turn MathJax off. This feature requires Javascript. Click on a formula to zoom.
ABSTRACT
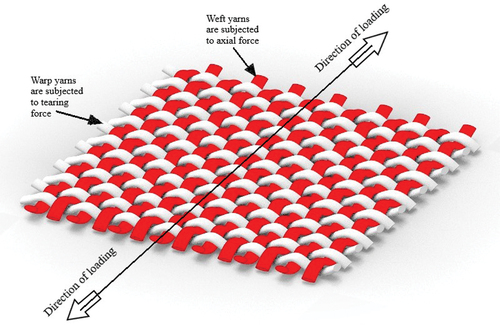
The use of plant fibers as a reinforcement in composites has increased daily owing to their favorable environmental considerations. Fabric properties play a significant role in alignment during composites processing, enhancing the composite properties. However, the fabric structures are formed by warp and weft yarns. These yarns are subjected to axial and shear loads, respectively. However, very limited work has been carried out on the study involving the tearing strength of the fabric. So it is necessary to study the effect of the tearing load of fabrics before converting them into composites. This paper focuses on the tearing strength of the sisal woven fabrics in both warp and weft directions. Two plain and one weftrib fabrics are prepared using sisal fibers, and their physical properties were characterized as per textile testing standards. Tear strength has been determined by Elmendorf Tear and Single Rip Tear Method by varying crosshead speeds. The result shows that woven patterns and number yarns significantly impact tearing strength. In the case of the weft rib pattern, the warp direction exhibits the highest tearing strength compared to the weft direction. Also, in the case of weftrib fabrics, the weft direction indicates better-tearing strength than another woven pattern.
摘要
由于其有利的环境因素,植物纤维在复合材料中作为增强材料的使用日益增加. 织物性能在复合材料加工过程中对排列起着重要作用,从而提高了复合材料的性能. 然而,织物结构由经纱和纬纱形成。这些纱线分别承受轴向和剪切载荷. 然而,关于织物撕裂强度的研究工作非常有限. 因此,在将织物转化为复合材料之前,有必要研究织物撕裂载荷的影响. 本文着重研究剑麻机织物在经向和纬向上的撕裂强度. 使用剑麻纤维制备了两种平纹织物和一种纬纱织物,并根据纺织品测试标准对其物理性能进行了表征. 撕裂强度已通过Elmendorf撕裂法和单撕裂法通过改变十字头速度来确定. 结果表明,编织图案和号码纱线显著影响撕裂强度. 在纬纱罗纹图案的情况下,与纬纱方向相比,经纱方向表现出最高的撕裂强度. 此外,在纬纱织物的情况下,纬纱方向表示比另一种编织图案更好的撕裂强度.
GRAPHICAL ABSTRACT
Introduction
In recent years, researchers have been making use of advancements in textile engineering for many industrial applications. This consists of garb, safety belts, and nets, airbags, seat covers, textile-strengthened concrete, fiber, and textiles are occupying in bridge connection between electric line and other systems, wearing down and avalanche safety elements, fabric reinforcements in barrier, channels, ditch, and other life/land framework systems. Further, in programs like long-lasting piping for canalization, balloons, and parachutes, plane wing and frame systems, boat rumps product of fabric-primarily depends on composites, unflappable parts of satellites, and different spacecraft in which textile composites are utilized in several transportation fields (Barasa, Njoroge, and Mbuya Citation2021; Bridgens and Birchall Citation2012; Buitrago, Jaramillo, and Gómez Citation2015; Canavan Citation2015; Colman et al. Citation2014; Gunge et al. Citation2019; Fabrics are subjected to axial, tearing, wear, and bursting loading conditions in these applications. Beata et al. studied the tearing strength of cotton blends with synthetic fibers under static and dynamic loading conditions and observed that the weft direction had better tear strength than warp shown in and many researchers also mentioned that woven pattern is influencing (Hanife Eryuruk and Kalaoğlu Citation2015; Jafrey Daniel James et al. Citation2020; Jaiprakash and Nagamadhu Citation2020; Karthikeyan et al., Citation2020; Kivade et al. Citation2021; Mahadevappa et al., Citation2020; Nagamadhu et al. Citation2019; Richard Horrocks Subhash and Anand Citation2017; Roberto et al. Citation2014; Teklu Citation2021; Trianoski et al. Citation2021; William Kithiia, David Munyasi, and Stephen Mutuli Citation2020; Witkowska and Frydrych Citation2005). The tearing strength of the fabrics also depends on the mobility of the yarns within the fabric structure, processing, and coating (Dar, Gessesse, and Zinabu Citation2020; Thanikai Vimal, Prakash, and Jebastin Rajwin Citation2020). Arunangshu et al. studied the tensile and tearing strength behavior of military khaki fabric and found that tearing strength was very much influenced by process variation, whereas fabric tensile strength was less sensitive (Dhamija and Chopra Citation2007; Mukhopadhyay, Ghosh, and Bhaumik Citation2006 Dhamija et al. studied the tear behavior of cotton fabrics and found that compact-spun weft yarns have more tearing strength ().
Figure 1. Fabric subjected to various forces in composites.
Further, it was observed that tearing behavior improved in the weft direction with the increase in weft yarn linear density and yarn twist factor. Barasa et al. observed the effect of extraction and brushing variables on the properties of hedge sisal fibers using a raspador and found that high correlation coefficients between fiber properties and the processing variables, but brushing process, mostly ignored in many cases, improved the properties of the sisal fibers (Barasa, Njoroge, and Mbuya Citation2021). Eman observed that the tearing strength of fabrics is influenced by the floating length of the yarn and the number of intersections and observed that tearing strength is enhanced by providing a degree of mobility for the fibers and yarns within the structure. Similarly many researchers have studied on tearing properties of fabrics and observed that tearing properties are very much essential for tents applications, due to applications of transfers loads (Eltahan Citation2018), (Dhamija and Chopra Citation2007; (Harrison Citation2008; Taylor Citation2008), (A, Platt, and Hamburger Citation1955; Pibo et al. observed the mechanical properties of the co-woven-knitted fabric and found that tensile and tearing properties depend on direction loading (Bilisik and Yolacan Citation2011; Furthermore, the abrasion cycle increases the tensile and tearing strength decreases. Witkowska et al. studied the tearing strength of different methods and found a lack of linear correlation between static and dynamic methods (Pibo et al. Citation2014; Bilisik et al. studied the stretch and tearing behavior of denim cloths, and found that the weft direction tearing strength of the small structure pattern was more significant than that of the traditional and large structural pattern (Witkowska and Frydrych Citation2004). Zhang et al. studied the tearing behavior of Polyvinyl Alcohol coated fabrics with an initial notch and observed that fabric strength depends on notch length (Yingying et al. Citation2019).
Spiridon investigated the compaction and bending variability of the 3D textile composite and observed that fabrics are subjected to maximum shearing loads at 90° during bending (Koutsonas Citation2017; Jin et al. studied the effect of reinforcement of natural fiber in nonwoven mat form on the mechanical behavior of bio-composites and observed that tearing of fiber mat plays a significant role (Zhang et al. Citation2019). Sathishkumar et al. studied the mechanical properties of snake grass fiber composite and reported that fibers fail due to tear loading (Sathishkumar et al. Citation2013; Özdemir et al. worked on mechanical properties of plain and plain derivative woven fabrics reinforced composites and observed that matt woven fabric reinforced composite absorbs more energy for perforation than the others (Özdemir and B M Citation2018). Özdemir et al. studied on tensile and impact properties of the twill and twill derivative woven fabric reinforced composites and observed that twill woven fabric reinforced composite showed the best performance in tensile tests along warp and weft directions (Özdemir, İ̇çten, and Doğan Citation2018).
Panayiotis et al. studied the flexural behavior of flax fiber-reinforced unidirectional composites and found that unidirectional composites are subjected to tearing loads during the failure (Georgiopoulos, Kontou, and Georgousis Citation2018 Amaresh et al. studied the mechanical properties of banana fabric reinforced biodegradable composites and found that failure of woven fabric reinforced composites occurs when the yarns are subjected to tearing load. Mode I fracture toughness of interlaminar interfaces which are analyzed by various ply angles influenced by transfers strength of the fiber/yarns in the composites (Liu et al. Citation2020). In case of carbon fiber reinforcement and particles reinforcement, plastic deformation of the matrix materials influenced by transfers directional strength of the yarns/fiber, which is identified during Mode I and Mode II interlaminar fracture analyses (Huang et al. Citation2020). Also, identified that nanomaterials and interface fiber angle are greatly influenced on Mode I fracture toughness of woven carbon fiber-reinforced polymer (CFRP) composites Toai Truong, Van Tran, and Kyu Choi (Citation2020). Many researchers also observed that warp direction yarns are subjected to axial loading while weft direction yarns are subjected to tearing loading. These studies clearly show a need for determining the tearing properties of fabrics before reinforcing them into composites.
The tearing behavior of fabric is mainly established on fiber, yarn, and fabric characteristics. Over the years, the research has been directed to investigate the influence of yarn and fabrics on the tensile and tearing strength of synthetic and cotton fabrics. However, no literatures are available on the tearing behavior of the sisal weaved fabric. This article focused on the preparation of three sisal woven fabrics and analyzing their physical properties. Further tearing strength were analyzed using a falling pendulum method and Single rip tear method in both warp and weft directions. The results are also used to understand the significance of three woven and loading rates in warp and weft directions.
Materials and methods
Materials
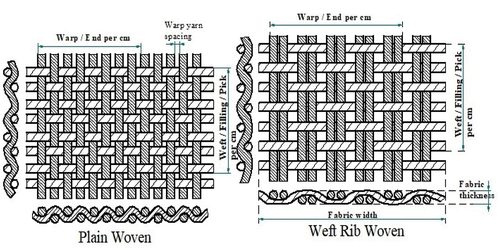
Sisal fibers extracted from plants in the southern part of Karnataka state, India. These sisal fibers are used to prepare three types of plain woven fabrics (two plain and one weft rib). The sisal fibers are extracted from the leaves in the same plantation to get similar properties of all fibers. The extracted fibers are converted into yarn, and these yarns are then converted into fabric by the hand-weaving process. However, weft rib is also considered under the categories of plain-woven patterns; however, there are two weft yarns interlaced with one warp yarns. Three sisal woven fabrics are assigned short names as Plain 1 (P1), Plain 2 (P2), and weft rib (WR). The Schematic diagram of plain and weft rib woven fabrics and cross-section views is shown in .
Figure 2. Schematic diagram of plain and weft rib woven fabrics and cross-section views.
Woven sisal fabrics are characterized through physical properties like mass per unit area, thickness, fabric density, or fabric count. The sisal yarns were characterized for its yarn size (linear density) and crimp (for warp and weft). All tests have been conducted employing several textile material standard methods. shows the standards used to characterize all the three woven sisal fabrics.
Table 1. Standard methods used to determine fabric properties.
Characterization of sisal yarn and fabric
Ten samples are cut at different locations of a 10 meter fabric and tested for different yarn, and fabric properties and average values are reported in .
Table 2. Physical properties of different fabrics.
Tearing strength fabrics
Elmendorf tearing test method
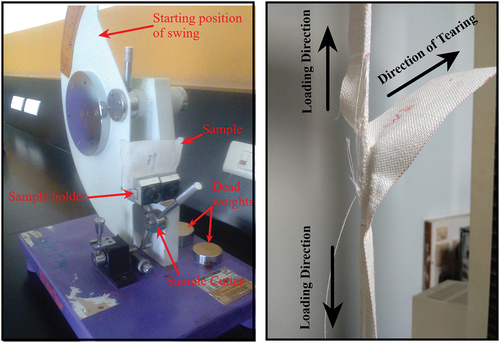
The force is in grams required to generate tear along the line of action for force over a fabric sample is measured according to ASTM D1424 (Painter, Chu, and Morgan Citation1950 both in warp and weft using Elmendorf Method, which is also known as the impact testing method shown in (a). Four adjustable weights are used to determine the tearing strength of fabric using EquationEquation 1(1)
(1) , and an average of five trials is noted. The sample is cut randomly from a 3 meter length of fabric and 0.2 meter away from the sleeve edges in the fabric. Two sets of the sample were obtained. One is warp sample, and the other is weft sample. (c) shows the size of the samples. The specimen is held between two clamps shown in (b), one side by the pendulum and on the other side by a stationary member. The pendulum swings through an arc, tearing the specimen from a precut slit. A pointer indicates the loss in energy by the pendulum. The scale indication is a function of the force required to tear the specimen. The width and height of sample 100 mm and 75 mm, and a slit of 20 mm deep has been made at the center of the edge perpendicular to the direction to be tested when the specimen is cut out. The average value of five trials of tear strength in warp and weft direction, respectively, is calculated using Equationequation 1
(1)
(1) .
Figure 3. Dynamic impact tearing testing (a) Elmendorf tear tester (b) fabric mounted by fixing both the ends of the fabrics (c) tearing testing template placed on P1 types of sisal fabric (d) dimensions of sample.
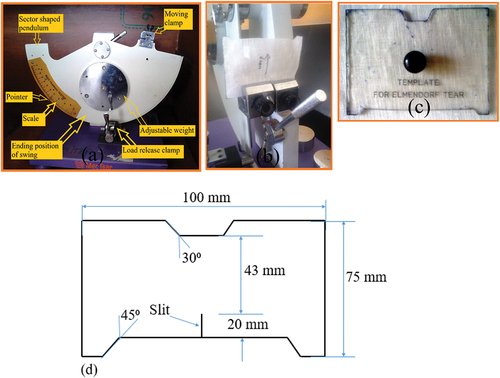
Where K is four weight constants, i.e., A = 16, B = 32, C = 64, D = 128
Single rip tear test method
Further tearing strength was analyzed using the single rip static tear method, also called Tongue tear. The samples are cut according to ASTM D 2261. One end of the sample clamped to the lower jaw (fixed jaw), another end of tear sample connected to the upper jaw (movable jaw). The crosshead speed varied from 50 mm/min to 300 mm/min at a 50 mm/min interval in both warp and weft directions.
Results and discussion
Tearing characterization of fabrics
Elmendorf tearing test method
shows the dynamic impact tearing of all three fabrics in warp and weft directions. The average dynamic impact tearing value of Plain 1 clearly indicates that warp direction exhibit 1.18 times better resistance comparing the weft directions. That is because of the higher yarn linear densities of weft yarn and followed with the higher cover factor. In the case of Plain 2, warp direction is 1.13 times better than weft direction. P2 type of fabric exhibits better-tearing properties than P1; this is due to the influence of linear yarn density. The number of yarns is less in P2 (12 No) as compared to P1 (18 No). However, the linear yarn density (yarn size) is higher (182.3 tex) in plain 2, but it is 85.1 tex in plain 1. In the case of weft rib warp direction, exhibit better (1.93 times) tearing resistance than weft direction. This is due to the effect of the number of yarns and their cover factor. The weft direction of the weft rib pattern exhibits the lowest tearing strength due to the number of yarns and yarn linear density.
Table 3. Dynamic Impact tearing strength (gram force) of three fabrics in warp and weft directions, respectively.
Analysis of variance (ANOVA)
It’s very difficult to control the input variable and its variations in natural fiber and fabric materials due to many of the limitations. Warps and wefts directions of all three materials are collectively made as a separate group to analyze the significance of Elmendorf tearing strength. ANOVA analysis is used to study the significant analytical variables that dominate the output response. The P-value (probability of significance) is then determined from the F-value. The hypothesis assumed that if P-value is equal to or smaller than 0.05 (confidence level 95%), it suggests that the factor’s contribution is significant. shows the dynamic impact testing variance between each fabric group, and shows the significance test of fabric between the groups. The P-value is less than 0.05 the date is significant. This means warp and weft direction, and P1, P2, and WR fabrics impact tearing properties. Also, F-value is more remarkable than F critical, indicating that the data is significant.
Table 4. Variance for dynamic impact testing of fabric.
Table 5. ANOVA for dynamic impact testing of fabric.
Single rip tear test method
show all three woven fabrics’ single rip tearing results in warp and weft directions. shows the tearing load-carrying capacity of Plain 1 fabric in the weft direction at various crosshead speeds of 50, 100, 150, and 200 mm/min. The single tear test described in shows each cross-section of yarn is subjected to progressively increasing tension. So it is essential to determine tear strength. The yarn fails individually in tension, and for this reason, the fabric tear strength is much lower than its breaking strength, where all yarns fail at the same time. The mechanism/process of tear effect in woven structure broadly includes four main stages: in the first stage, the stretching and slippage of yarns closest to the tip of the crack; In the second stage, the crowding of these yarns on the edges of a Del zone and the transfer of the load to the yarns held in tension in the so-formed Del zone; In the third stage, the stretching and alignment/jamming of these yarns; and in the last stage finally the rupture of the outer transverse yarn as shown in . These stages/steps proceed cyclically until the tearing direction reaches the endpoint of loading. A typical tear test load–extension plot has a saw-tooth shape, as shown in , respectively. The peaks in the force-displacement curve correspond to the failure of each successive transverse yarn as the tearing progresses, and the same trend continues till the endpoint of loading, that is, 180 mm. The cross yarn fails one by one, twice, or even in a group of multiple yarns depending on the woven physical properties of fabric like yarn strength, elongation of yarn, cover factor, crimp, and woven pattern.
Figure 4. Tearing failure of fabric under single rip tear test method.
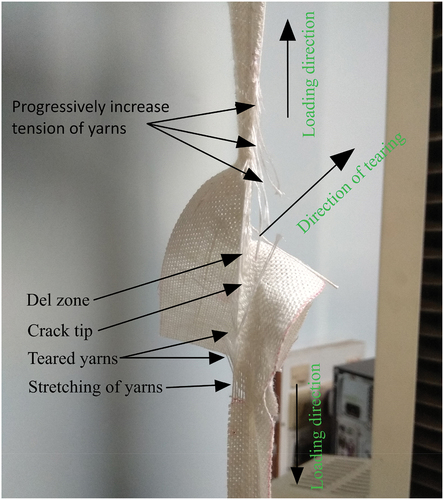
Figure 5. Tearing of Plain 1 type of fabric in weft direction.
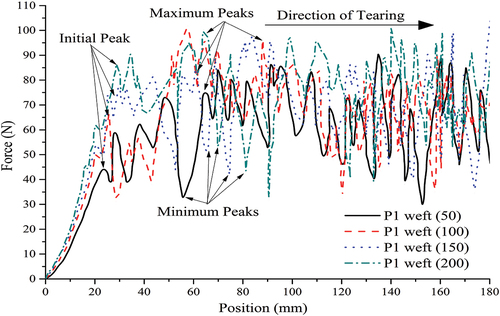
Figure 6. Tearing of plain 1 type of fabric in warp direction .
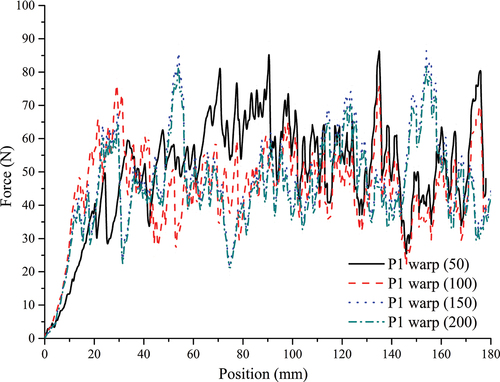
Figure 7. Tearing of plain 2 type of fabric in warp direction.
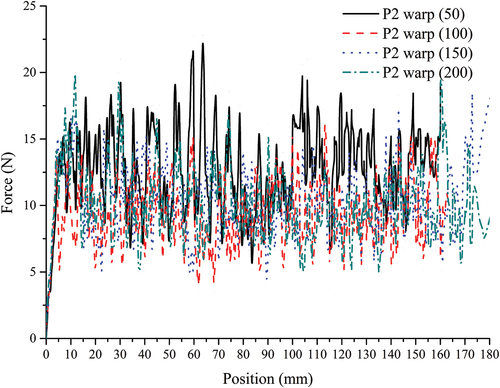
Figure 8. Tearing of plain 2 type of fabric in weft direction.
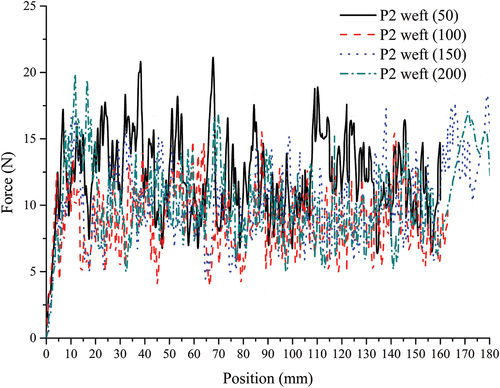
Figure 9. Tearing of weft rib type of fabric in warp direction.
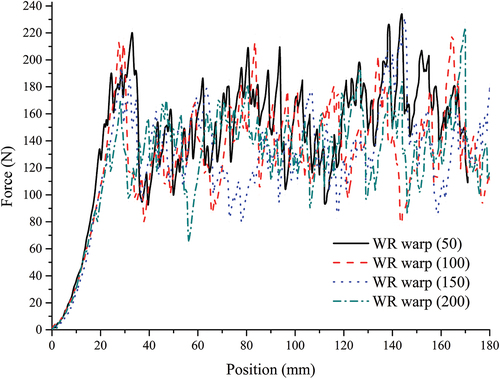
Figure 10. Tearing of weft rib type of fabric in weft direction.
, respectively, show the tearing load-position (displacement) diagram of P1 fabric in both weft and warp direction. It clearly shows that up to initial peak values, resistance against load increases as compared to tearing length. The increase in the value of resistance against load is due to the first yarn, which results in the stretching of the crack tip, which slips closely with the neighboring yarn and forms Del zone. The nature of this initial region of the curve is due to the effect of crimp and yarn strength associated with the cover factor. After this, the initial peak crack propagation and continues along the direction of tearing. The crosshead speed varied from 50 to 200 mm/min, and at lower crosshead speeds, the rate at which load increases was found to decrease. It clearly shows that higher the crosshead speeds, initial peaks are at lower tearing length with a higher magnitude of tearing strength(force). The same natures of curves were observed in both warp and weft directions. However, initial peaks were found to be at lower tearing length in the warp as compared to the weft direction. This may be due to the effect of the yarn crimp. The yarn crimp is more in weft directions as compared to warp directions.
Further, it clearly shows the progressive failure of single and multiple yarns along the tearing direction. The tearing force varies cyclically until the tearing direction reaches the endpoint of the tear. However, the gap between two cyclic pecks was found to be higher, and many small pecks were found throughout the tearing length. This gap between pecks of cyclic curves because of the effect of fabrics cover factor and as linear yarn density is 80.1 tex and 85.1 tex in warp and weft direction. The small peaks represent the failure of one or two yarns as there is more resistance for the mobility of yarn under tearing load. However, the tearing strength of woven fabric by a single rip tear test method is very low as compared to Elmendorf tearing test method. This is due to the effect of clamping during testing. In the Elmendorf tearing test method, both the sides of the fabric were held rigidly, and impact load was applied. However, in the case of a single rip tear test, two ends are connected; two jaws and weft yarns are exhorting tearing force on warp yarns. The yarns slip each other and form saw-teeth profile curves throughout the tearing length. & respectively, show the tearing load-position (displacement) diagram of P2 fabric in both warp and weft direction. The nature of the tearing curve of P2 is similar to P1. While the crosshead speed rises, the tearing effort values also increase. However, the gaps between the peaks of the force-tearing length curve were closer, and variations of force value throughout the tearing length were found to be cyclic with closer bandwidth. This clearly shows the number of yarns are 12 in both warp and weft direction, which leads to slipping of yarns and the formation of a Del zone. In the case of P2, the initial peaks were found at lower tearing length as compared to P1. This may be due to the influence of the cover factor. In the case of P1, the number of yarns in both warp and weft directions was higher than P2. As the cover factor was less in P2, many loose yarns in both warp and weft directions lead to slip of yarn from fabric. The mobility of these yarns leads to lower tearing resistance and is observed like a zigzag pattern of failure as compared to P1. In other words, the number of cyclic curves is higher in P2 as compared to P1. Similar to P1, in the P2 weft direction of fabric exhibited very good tearing strength than the warp direction. As compared to P2, the tear strength values of P1 fabric are better. Since P2 has a loose fabric structure as compared to P1, it allows greater yarn mobility as compared to P1. P1 fabric has a higher cover factor compared to P2. The decrease in yarns movability leads to an increased crowding of the yarn in the Del zone.
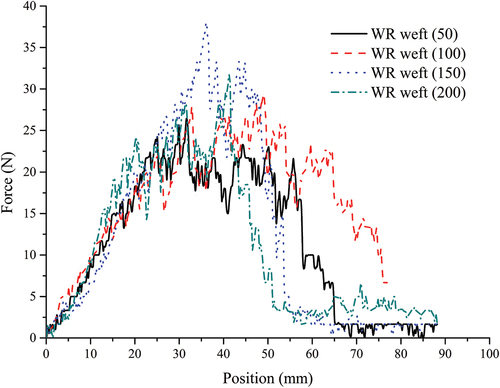
, respectively, show the tearing load-position diagram of WR fabric in both warp and weft direction. The nature of the force-position curve of the weft rib warp direction is similar to P1 and P2. However, the magnitude of tearing value has been found to be very high as compared to another pattern. The increase in tearing value is due to two weft yarns interlaced with one warp yarn. The two weft yarns resist higher tearing load in warp direction as comparedto plain-woven P2, which has the same gram per square meter. During the initial part of the load-position curve, as the crosshead speed increase, the rate of resistance decreases with respect to load. This is because of the presence of two yarns in warp directions and lesser cover factors in weft directions, which leads to the slipping of yarns at a slower crosshead speed. clearly shows the nature of curve changes and failure of fabric after two three peaks. The tearing force value was observed that, better in wefts directions also as compared to another plain woven. This clearly signifies that the weft rib pattern exhibits better-tearing strength in both warp and weft directions compared to the other two plain woven fabrics. During the weft direction loading of weft rib pattern, tearing of yarn start near the crack tip, and crack propagates perpendicular to the loading direction. The nature of failure along the weft direction of the fabric is similar to tensile loading.
Analysis of variance (ANOVA)
In single rip tear test method fabrics, the yarns are dislocated along the direction of force and stretching yarns to the maximum extent; during this stage, yarns resist external tearing force and increase load-carrying capacity. At the end of this stage, yarn stretch to maximum extents, and the beginning of the thread breakage refers to maximum peaks in . Further, once thread (yarn) fails, the load-carrying capacity decreases with increasing dislocation of the next yarn leads to minimum peaks (bottom peaks). The same trend (many peaks) was observed throughout the tearing length of the fabric in all types of fabrics in both warp and weft directions.
It’s necessary to consider all points throughout the tearing length of the fabrics to understand the significance between fabrics and their directions. shows the average and variance of P1 fabric both in warp and weft directions. Both average and variance values increase with an increased rate of loading in the weft direction, and this clearly shows that as the crosshead speed increases, the amount of energy observed by the material also increases. In warp direction, variations on average and variance was observed with an increase in the crosshead speed. This is as a result of lower crimp value, yarn’s linear densities, and the number of yarns per unit length. These parameters have a significant influence on controlling the gap between maximum and minimum peaks.
Table 6. The variance of P1 between warp and weft groups static tearing for various crosshead speed.
ANOVA analysis was used to study the significance between fabrics and the rate of loading. The P-value (Anticipation of importance) is then decided in distinction to the F-value. The hypothesis assumed If P-value is equal to or lower than 0.05 (confidence level 95%), it suggests that the contributions of the variables are significant. shows the significance test of fabrics between the warp and weft directions for the various rate of loading. The P-value is less than 0.05 the date is significant. Which means direction and rate of loading in the case of P1 fabric have a significant impact on tearing properties. Also, F-value is greater than F critical, indicating that the data is significant.
Table 7. ANOVA for P1 fabric.
shows the average and variance of P2 fabric both in warp and weft directions. Both in warp and weft direction, variations in the average value were observed with an increase in the crosshead speed. That is because of the linear yarn densities and the number of yarns per unit length. In P2, the linear yarn densities is more than that of P1; the yarns don’t break at a lower amount of force. These yarn slips from the fabric and leads to variations in maximum and minimum peak values.
Table 8. The variance of P2 between warp and weft groups static tearing for various crosshead speed.
shows the significance test of P2 fabric between the warp and weft directions for various rates of loading. The P-value is less than 0.05 the date is significant. Which means direction and rate of loading in the case of P2 fabric have a significant impact on tearing properties. Also, F-value is greater than F critical, indicating that the data is significant.
Table 9. ANOVA for P2 fabric.
shows the average and variance values of WR fabric over a range of crosshead speed in both warp and weft directions. This clearly shows that the weft direction of the fabrics fails at smaller tearing length due to the presence of fewer number yarns as compared to other directions. Warp direction of the fabric exhibit better-tearing strength than the weft directions. This shows a woven pattern also has a significant effect on tearing the fabric’s strength.
Table 10. The variance of WR between warp and weft groups static tearing for various crosshead speed.
shows the significance test of WR fabric between the warp and weft directions for the various rate of loading. The P-value is less than 0.05 the date is significant. Which means direction and rate of loading in the case of WR fabric significantly impact tearing properties. Also, F-value is greater than F critical, indicating that the data is significant.
Table 11. ANOVA for WR fabric.
Findings and conclusion
The sisal fiber used to prepare three different woven patterns to study the effect of various textile properties on tearing. To study the effect of GSM, two plan woven pattern was used and study the effect of woven pattern one plain and one weft rib was used by maintaining same GSM. As tearing properties of fabric influence a lot on mechanical properties of the various applications, the tearing strength were analyzed using a falling pendulum method and Single rip tear method in both warp and weft directions. Further, statistical methods were used to study the significance level and its influence. The paper shows a detailed characterization of woven sisal fabrics and many of the findings, some of which were very important in predicting and interpreting the properties of sisal fabric reinforced composites. However, it is necessary to understand basic textile properties’ influence on fabric tearing. The following are the findings and conclusions of this research work.
Three fabrics were tested and found that warp direction exhibit better properties than weft directions.
The yarn crimp influenced on fabric initial tearing peak of the fabric. Further, the cyclic behavior and gap between cyclic peaks depend on cover factor and number yarns subjected to tearing. As the cover factor and number of yarns are higher the tearing peak value increases with a larger gap between two cyclic peaks. As the yarns are finer with a higher cover factor, many smaller peaks were observed throughout the tearing length and good tearing resistance throughout the entire tearing length. The same nature was observed in Plain 1 type of fabric both in warp and weft directions. A number of yarn lesser with higher yarn linear density, many peaks was found, and peak cycles are fully reversible. This increases yarn mobility and leads closer to the cyclic gaps with larger yarn mobility. The same was observed in Plain 2 fabrics in both warp and weft directions. As the number of yarns and yarn linear density is lesser along with the lower cover factor, the tearing direction is perpendicular to the applied load and fails by a lesser number of peaks. The same behavior was observed in the Weft Rib fabric along the weft direction.
The pendulum tear test values are very high as compared to single rip tear test values of the same fabric. In the case of pendulum tear, both the ends of the yarns are rigidly clamped and apply impact load perpendicular to the direction of the yarn. So yarns are subjected to direct tearing load no mobility of yarns was found.
In single rip tear, the yarns are transferring tearing load on to tear the other set of yarns, greater mobility as compared to pendulum method. Analysis of variance shows that the tearing data are significant in all fabric cases both in warp and weft direction. Fabric with a high value of cover factor with optimum yarn crimp exhibit better-tearing strength with both warp and weft direction and the average of tearing value increases with increasing crosshead speed.
Highlights
Sisal fibers are extracted and converted into various plain-woven patterns of sisal fabrics are prepared.
Textile properties are analyzed using various textile standards.
The tearing properties of sisal woven fabric were analyzed using Single Rip Tear Test Method and pendulum-type Elmendorf Tear Method.
Statistical software used to analyze tearing test data.
Analysis of Variance used to understand the significant effect of tearing properties.
Ethical approval
We confirm that all the research meets ethical guidelines and adheres to the legal requirements of the study country. The research does not involve any human or animal-welfare-related issues.
Acknowledgment
The authors are thankful for the financial support to carryout research work by the Third phase of Technical Education Quality Improvement Programme (referred to as TEQIP-III) is fully integrated with the Twelfth Five-year Plan and Visvesvaraya Technological University (VTU), Belgaum, Karnataka, India. Grant number VTU/TEQIP 3/2019/21 approved dated 10 December 2019 under Competitive Research Grant titled “Influence of Textile Properties on Fatigue and Thermo-Mechanical Analysis of Woven Natural Reinforced Bio-Degradable Polymer Composites”.
Disclosure statement
No potential conflict of interest was reported by the author(s).
Data availability statement
The datasets associated with figures and tables in the current study are available from the corresponding author on request.
Additional information
Funding
References
- A, T. N., M. M. Platt, and W. J. Hamburger. 1955. Mechanics of elastic performance of textile materials: Part xii: Relation of certain geometric factors to the tear strength of woven fabrics. Textile Research Journal 25 (10):838–19. doi:10.10.1177/004051755502501.
- Barasa, N. W., K. D. Njoroge, and T. O. Mbuya. 2021. An investigation of the effects of extraction and brushing variables on the properties of hedge sisal fibers using a raspador. Journal of Natural Fibers 19 (13):1–20. doi:https://doi.org/10.1080/15440478.2020.1870641.
- Bilisik, K., and G. Yolacan. 2011. Tensile and tearing properties of newly developed structural denim fabrics after abrasion. Fibers & Textiles in Eastern Europe 19 (88):54–59. 2. http://www.fibtex.lodz.pl/article576.html.
- Bridgens, B., and M. Birchall. 2012. Form and function: The significance of material properties in the design of tensile fabric structures. Engineering Structures 44:1–12. doi:10.1016/j.engstruct.2012.05.044.
- Buitrago, B., F. Jaramillo, and M. Gómez. 2015. Some properties of natural fibers (sisal, pineapple, and banana) in comparison to man-made technical fibers (aramide, glass, carbon). Journal of Natural Fibers 12 (4):357–67. doi:10.1080/15440478.2014.929555.
- Canavan, K. 2015. Chapter 21 - applications of textile products, textiles and fashion, materials, design and technology. Woodhead Publishing Series in Textiles 531–45.
- Colman, A. G., B. N. Bridgens, P. D. Gosling, G. T. Jou, and X. Y. Hsu. 2014. Shear behaviour of architectural fabrics subjected to biaxial tensile loads. Composites Part A Applied Science and Manufacturing 66:163–74. doi:10.1016/j.compositesa.2014.07.015.
- Dar, B., N. Gessesse, and N. Zinabu. 2020. Effect of loom tension on mechanical properties of plain woven cotton fabric. Journal of Natural Fibers. doi:10.1080/15440478.2020.1776663.
- Dhamija, S., and M. Chopra. 2007. Tearing strength of cotton fabrics in relation to certain process and loom parameters. Indian Journal of Fiber & Textile Research 32:439–45. http://nopr.niscair.res.in/handle/123456789/331.
- Eltahan, E. 2018. Structural parameters affecting tear strength of the fabrics tents. Alexandria Engineering Journal 57 (1):97–105. doi:https://doi.org/10.1016/j.aej.2016.12.005.
- Georgiopoulos, P., E. Kontou, and G. Georgousis. 2018. Effect of silane treatment loading on the flexural properties of PLA/flax unidirectional composites. Composite Communication 10:6–10. doi:10.1016/j.coco.2018.05.002.
- Gunge, A., G. K. Praveennath, M. Nagamadhu, S. B. Kivade, and K. V. Shivananda Murthy. 2019. Study on mechanical properties of alkali treated plain woven banana fabric reinforced biodegradable composites. Composites Communications 13:47–51. doi:10.1016/j.coco.2019.02.006.
- Hanife Eryuruk, S., and F. Kalaoğlu. 2015. The effect of weave constriction on tear strength of woven fabric. AUTEX Research Journal 15 (3):207–14. doi:10.1515/aut-2015-0004.
- Harrison, P. W. 2008. The tearing strength of fabrics: I. a review of the literature. Journal of the Textile Institute Transactions 51 (3):91–131. doi:10.1080/19447026008662676.
- Huang, Y., W. Liu, Q. Jiang, Y. Wei, and Y. Qiu. 2020. Interlaminar fracture toughness of carbon-fiber-reinforced epoxy composites toughened by poly(phenylene oxide) particles. ACS Applied Polymer Materials 2 (8):3114–21. doi:10.1021/acsapm.0c00285.
- Influence of textile properties on dynamic mechanical behavior of epoxy composite reinforced with woven sisal fabrics. Sādhanā 45 (1). doi:10.1007/s12046-019-1249-z.
- Jafrey Daniel James, D., S. Manoharan, G. Saikrishnan, and S. Arjun. 2020. Influence of bagasse/sisal fibre stacking sequence on the mechanical characteristics of hybrid-epoxy composites. Journal of Natural Fibers 17 (10):1497–507. doi:10.1080/15440478.2019.1581119.
- Jaiprakash, M., M. nagamadhu, K. Karthikeyan, M. S. Kiran, and G. C. Mohan Kumar. 2020. effect of drilling parameters on neem wood veneer epoxy composites using grey relational analysis. Materials Today: Proceedings 24 (4):2163–73. doi:10.1016/j.matpr.2020.03.674.
- Karthikeyan, K., M. Nagamadhu, M. Jaiprakash, and M. S. Kiran. 2020. Effect of drilling parameters on natural fiber reinforced with chaired epoxy poly urethane foam composites using grey relational analysis. Materials Today: Proceedings 24 (4):2193–203. doi:10.1016/j.matpr.2020.03.677.
- Kivade, S. B., M. N. Amaresh Gunge, and S. Rajole. 2021. Mechanical and dynamic mechanical behavior of acetylation-treated plain woven banana reinforced biodegradable composites. Advanced Composites and Hybrid Materials 1–15.
- Koutsonas, S. 2017. Compaction and bending variability measurements of a novel geometry 3D woven layer to layer interlock composite textile around a 90° curve plate 3.2 mm radius. Composite Communication 5:40–45. doi:10.1016/j.coco.2017.06.004.
- Liu, C., R. Bai, Z. Lei, JianyuDi, D. Dong, T. Gao, H. Jiang, and C. Yan. 2020. Study on mode-I fracture toughness of composite laminates with curved plies applied by automated fiber placement. Materials & Design 195:108963. doi:10.1016/j.matdes.2020.108963.
- Mahadevappa, N., V. K. Shankar, S. Sehgal, and R. Upadhya. 2020. Study the impact of drilling process parameters on natural fiber reinforced herringbone epoxy composites. Annales de Chimie - Science des Matériaux 44 (5):339–45. doi:10.18280/acsm.440506.
- Mukhopadhyay, A., S. Ghosh, and S. Bhaumik. 2006. Tearing and tensile strength behaviour of military khaki fabrics from grey to finished process. International Journal of Clothing Science and Technology 18 (4):247–64. doi:10.1108/09556220610668482.
- Nagamadhu, M., M. Jaiprakash, and K. Karthikeyan. 2020. Effect of drilling process parameters on natural fiber reinforced basket epoxy composites using grey relational analysis. Materials today Proceedings 24 (4):2255–64. doi:10.1016/j.matpr.2020.03.753.
- Nagamadhu, K. M., K. Jaiprakash, M. Karthikeyan, and M. Shariff. 2020. Study the impact of drilling process parameters on natural fiber reinforced chaired epoxy composites. Materials Today: Proceedings 24 (4):2204–18. doi:10.1016/j.matpr.2020.03.678.
- Nagamadhu, M., P. Jeyaraj, and G. C. M. Kumar. 2019. Characterization and mechanical properties of sisal fabric reinforced polyvinyl alcohol green composites: Effect of composition and loading direction. Materials Research Express 6 (12):6 125320. doi:10.1088/2053-1591/ab56b3.
- Özdemir, H., and İ. B M. 2018. The mechanical performance of plain and plain derivative woven fabrics reinforced composites: Tensile and impact properties. The Journal of the Textile Institute 109 (1):133–45. doi:10.1080/00405000.2017.1333719.
- Özdemir, H., B. M. İçten, and A. Doğan. 2018. Experimental investigation of the tensile and impact behavior of twill and twill derivative woven fabric reinforced composites. Tekstil ve Konfeksiyon 28 (4):258–72. doi:10.32710/tekstilvekonfeksiyon.482873.
- Painter, E. V., C. C. Chu, and H. M. Morgan. 1950. Testing textiles on the Elmendorf tear tester. Textile Research Journal 20 (6):410–17. doi:10.1177/004051755002000606.
- Pibo, M., G. Jiang, Z. Gao, Q. Zhang, and D. Xia. 2014. Tension and tear behaviors of co-woven-knitted fabric with photograph investigation. Fibers and Polymers 15 (2):382–89. doi:10.1007/s12221-014-0382-x.
- Richard Horrocks Subhash, C., and Anand. 2017. Handbook of technical textilesVol. 2. Technical Textile Applications, woodhead Publishing Series in Textiles. 2nd 452.
- Roberto, C., F. M. S. A. Dante, L. Huerta, P. Ablo Martín Ramos, M. N. G. Luis, and J. Martín Gil. 2014. Composite fiber based on sisal fiber and calcium carbonate. Journal of Natural Fibers 11 (2):121–35. doi:10.1080/15440478.2013.849644.
- Sathishkumar, T. P., P. Navaneethakrishnan, S. Shankar, and R. Rajasekar. 2013. Investigation of chemically treated longitudinally oriented snake grass fiber-reinforced isophthalic polyester composites. Journal of Reinforced Plastics and Composites 32 (22):1698–714. doi:10.1177/0731684413495321.
- Taylor, H. M. 2008. Tensile and tearing strength of cotton cloths. Journal of the Textile Institute Transactions 50 (1):161–88. doi:10.1080/19447025908662490.
- Teklu, T. 2021. Characterization of physico-chemical, thermal and mechanical properties of Ethiopian sisal fibers. Journal of Natural Fibers. doi:10.1080/15440478.2020.1848730.
- Thanikai Vimal, J., C. Prakash, and A. Jebastin Rajwin. 2020. Effect of weave parameters on the tear strength of woven fabrics. Journal of Natural Fibers 17 (9):1239–48. doi:10.1080/15440478.2018.1558155.
- Toai Truong, G., H. Van Tran, and K. Kyu Choi. 2020. Investigation on mode i fracture toughness of woven carbon fiber-reinforced polymer composites incorporating nanomaterials. Polymers 12 (11):2512. 28. doi:10.3390/polym12112512.
- Trianoski, C., R. P. de Paula, R. Trianoski, and E. Azevedo. 2021. Development and characterization of sawdust and sisal fiber reinforced vegetable based polyurethane foam hybrid composites. Journal of Natural Fibers 19 (9):3265–74. doi:10.1080/15440478.2020.1841067.
- William Kithiia, M., M. David Munyasi, and M. Stephen Mutuli. 2020. Strength properties of surface modified Kenyan sisal fibres. Journal of Natural Fibers 19 (6):2277–87. doi:10.1080/15440478.2020.1807446.
- Witkowska, B., and I. Frydrych. 2004. A comparative analysis of tear strength methods. Fibers & Textiles in Eastern Europe 12 (2):42–47. http://www.fibtex.lodz.pl/46_13_42.pdf.
- Witkowska, B., and I. Frydrych. 2005. Protective clothing – test methods and criteria of tear resistance assessment. International Journal of Clothing Science and Technology 17 (3/4):242–52. doi:10.1108/09556220510590948.
- Yingying, Z., X. Junhao, Y. Zhou, Z. Qilin, and W. Fuyin. 2019. Central tearing behaviors of PVC coated fabrics with initial notch. Composite Structures 208:618–33. doi:10.1016/j.compstruct.2018.09.104.
- Zhang, J., A. Afaghi Khatibi, E. Castanet, T. Baum, Z. Komeily Nia, P. Vroman, and X. Wang. 2019. Effect of natural fibre reinforcement on the sound and vibration damping properties of bio-composites compression moulded by nonwoven mats. Composites Communications 13:12–17. doi:10.1016/j.coco.2019.02.002.