
ABSTRACT
Ramie (Boehmeria nivea L.), belonging to Urticaceae, is principally used for fabric production. It is a well-known natural fiber material for ancient clothing. Despite its important position and application value, the understanding on genetic regulation mechanism of fiber quality is limited. Here, we generate a chromosome-scale, high-quality reference genome of ramie, in which, approximately 90.2% of the assembled sequences have been anchored to 14 pseudochromosomes. Totally 27,664 protein-coding genes are predicted which cover 268.24 Mb region of the genome. Comparative genomic analysis reveals that 2,047 and 796 gene clusters expand and contract, respectively, underlying significant genes in plant hormone signal transduction and cellulose/lignin biosynthesis pathways. An integrative analysis combining quantitative trait loci (QTL), comparative transcriptomic data, and cytological experiments unravels the molecular regulatory mechanism of ramie fiber fineness, especially the critical regulating role of ethylene. This study would lay a solid foundation for the research of molecular biology in ramie and provide valuable reference for the improvement of high-quality fiber varieties.
摘要
苎麻(Boehmeria nivea L.)属于荨麻科,主要用于织物生产. 它是一种著名的用于古代服装的天然纤维材料. 尽管它具有重要的地位和应用价值,但对纤维品质的遗传调控机制的理解仍然有限. 在这里,我们生成了一个染色体规模、高质量的苎麻参考基因组,其中约90.2%的组装序列锚定在14个假染色体上. 共预测27664个蛋白质编码基因,覆盖基因组268.24Mb区域. 比较基因组分析表明,2047和796个基因簇分别扩增和收缩,这是植物激素信号转导和纤维素/木质素生物合成途径中的重要基因. 结合数量性状基因座(QTL)、比较转录组数据和细胞学实验的综合分析揭示了苎麻纤维细度的分子调控机制,特别是乙烯的关键调控作用. 本研究将为苎麻分子生物学研究奠定坚实基础,为优质纤维品种的改良提供有价值的参考.
Introduction
Bast fiber, the earliest textile used by the ancients for making clothes, is a symbol of civilization. Ramie (Boehmeria nivea L.), also called China grass, is one of the oldest and most important natural fiber crops worldwide. The superior fiber obtained from ramie stem is long and highly durable, pure white in color, silky in texture, and has a high degree of hygroscopicity and superior heat dissipation properties, which makes ramie being a highly versatile and useful natural raw textile material. The products of bast fiber are affected by its quantitative characteristics including length, strength, and fineness. At present, the ramie fiber fineness, which might be affected by multiple QTL (Topdar et al. Citation2013; Zeng et al. Citation2019) and numerous genes (Xie et al. Citation2020; Zhang et al. Citation2020), can’t meet the requirements of high-quality textiles. It is well known that ramie fiber fineness is inversely proportional to fiber yield, which hinders the improvement of fiber fineness by traditional breeding technology. For a long time, only a small number of genetic markers and one genetic map of ramie have been published. The molecular mechanism of ramie fiber fineness regulatory is still to be revealed.
Previously, we have assembled a ramie genome of about 341 Mb, while another publication showed another version of ramie genome with about 266 ~ 270 Mb (Luan et al. Citation2018; Wang et al. Citation2021). More precise genome sequence assembly is conducive to the functional analysis of ramie genes. Here, we present a high-quality chromosome-scale genome assembly of B. nivea using a combination of short-read sequencing, single-molecule real-time sequencing, and a high-density genetic map. The detailed information of the ramie genome would be helpful for understanding the molecular basis of its fiber fineness development. We further performed a comparative transcriptomic analysis with high and low fiber fineness ramie varieties to investigate the molecular regulatory mechanism of fiber fineness.
Materials and methods
Plant materials and growth conditions
The ramie variety (Zhongzhu No. 1) used for the earlier draft assembly was used for whole-genome sequencing in this study (Luan et al. Citation2018). Two ramie varieties with high (H) and low (L) fiber fineness were used for transcriptomic analysis. In the stage of 14 (T1), 24 (T2), 34 (T3), 44 (T4), 54 (T5) days after germination, the bast of middle plant stem was picked for transcriptome sequencing. Three independent biological replicates were set for each variety. Each replicate was collected from the same ramie plant at each sampled stage.
Genome sequencing, assembly, quality assessment, and annotation
In total, approximately 10 mg high-quality genomic DNA was extracted from young leaves of Zhongzhu No. 1. Two 20 Kb independent PacBio single-molecule real-time (SMRT) bell libraries were sequenced by the PacBio RSII sequencer (Pacific Biosciences, CA, USA) and 75.5 Gb of previous short insert size paired-end Illumina clean data (under BioProject ID: RJNA417329) was incorporated into this genome assembly for error correction. The PacBio long subreads was assembled by using FALCON (version 0.5.0) (Chin et al. Citation2016). The assembled consensus sequences were polished with Quiver algorithm using PacBio reads. Pilon (version: 1.21) was then adopted for genome correction with the published short paired-end reads generated from Illumina HiSeq Platforms (Luan et al. Citation2018). Reads mapping, Benchmarking Universal Single-Copy Orthologs (BUSCO V5) evaluation, transcripts alignment, and LTR assembly index (LAI) were used to evaluate the quality of the genome assembly, respectively. The gene sets of the genome were annotated combined using denovo, homology and RNA assisted approaches by the Maker pipeline. The predicted genes were functionally annotated through BLAST searches against seven public protein databases, including NCBI non-redundant, Swissprot, KEGG, KOG, TrEMBL, Interpro, and GO databases.
Phylogenetic analysis
We used 1,155 single-copy identified gene families for phylogenetic analysis. Protein sequences of single-copy gene families were performed with multi-alignment using MUSCLE (Edgar Citation2004). Supergenes of each species were produced by concatenating multi-alignment gene families. Oryza sativa was the out-group, supergenes were fed into RAXml with parameters (-m PROTCATJTT) for phylogenetic tree construction. We then used MCMC module of the Phylogenetic Analysis by Maximum Likelihood (PAML) package to estimate the divergence time of species. MCMC runs were conducted for 1,000,000 generations (1 sample/100 generations) and the first 250 samples were burned in. Calibration times were marked by the data from the TimeTree database.
Expansion and contraction of gene families
We evaluated the changes of gene families based on phylogenetic tree and gene families using CAFÉ (version 2.1) (De Bie et al. Citation2006). Expanded genes were then functional annotated by KEGG enrichment.
Genetic mapping and QTL mapping
A ramie F1 hybrid progeny population (253 lines) and its parents Zhongzhu No. 1 and Hejiangqingma were used for QTL analysis. The extracted DNA from leaf samples was digested with EcoR I (New England Biolabs, USA), and then sequenced on an Illumina Hiseq 4000 platform (Illumina, San Diego, CA, USA) using paired-end reads (150 bp) sequencing strategy in BGI-Shenzhen, China. After filtering the low-quality reads and adapters, the first (left) paired-reads with a length of 136 nt were clustered and genotyped by the software package of Stacks (version: 1.23). The double pseudo-test cross strategy was used for genetic map construction using LepMap2 software. The RAD markers were mapped to the ramie genome sequence using Blat v.35 with E value <1e × 10 −10. After filtering with parameters: identity ≥95% and aligning rate >95%, markers with more than one best hit in different contigs were eliminated. The remained markers were used to anchor the contigs to the consensus genetic linkage map with the ALLMAPS software. The Multiple QTL Mapping (MQM) algorithm in MapQTL6.0 software was used for QTL analysis. The QTLs were identified according to genome-wide logarithm of the odds (LOD) scores, and a significant level was marked at a level of p < .05 with the threshold values calculated using 1,000 permutations.
Plant height, stem diameter, bark thickness, fiber fineness, and ramet number were measured in two harvest seasons (October 2017 and June 2018). Fifteen ramets per plot were selected randomly to record the phenotypic data using band tape or vernier caliper. Fiber fineness was measured using the following method. The fiber is derived from the bast stripped, degummed, and fiber fineness was examined with optical fiber diameter analyzer systems (OFDA 100 and OFDA 2000; Wald, Switzerland) according to methods described by Brims and Hornik (Citation2000).
Ethylene treatment experiment
Zhongzhu No. 1 was used in an ethylene treatment experiment. Ramie shoots of 15 cm in length were planted in a hydroponic device and cultured in 1/2 Hoagland solution under the following conditions: 500 μmol m−2 s−1 light; 12 h light/12 h dark period; 30°C in the day and 25°C during the night; 70% relative humidity. When roots of the seedlings grew to 8 cm, ethylene treatment (treated with 0, 50, 100, 200, 300, and 400 mg L−1 ethephon, respectively) was performed. Ethylene solution was sprayed on leaves and stems of ramie seedlings, once every one day, for three consecutive times. Three replicates were set for each treatment concentration, and each replicate contained 15 individual plants. After 7, 13, 23, 33, 43 days of treatment (counted from the first spray of ethephon), stems were collected for making slices. Paraffin sections methods according to Cai and Lashbrook (Citation2006), and fibrocyte measurement followed as: five different regions of each splice were chosen to capture pictures using OLYMPUS DP73. Length and width of fiber cells were measured using ImageJ software.
Transcriptome analysis
Total RNA was isolated from the phloem tissue in different developmental stages. The cDNA libraries were constructed with an Illumina Paired End Sample Prep kit (Illumina, San Diego, CA, USA), quantified by TBS380 (Picogreen, Invitrogen, Carlsbad, CA, USA) and sequenced by BGISEQ-500 platform (MGI, Shenzhen, China). Paired-end reads with 100 bp length were obtained. Then reads that contained a high proportion of N, low-quality and contaminated by adaptors were filtered. Clean reads were mapped against gene models using Bowtie2 (version: v2.2.5). RSEM (v1.2.12) was used to evaluate and calculate expression quantity with default parameters. We detected differentially expressed genes using DEGseq with Fold Change > = 2 and Adjusted P value < = 0.001 among different groups. Differentially expressed genes were performed function enrichment and metabolic pathway analysis. In addition, expression patterns of differential expression groups were clustered by pheatmap, a package of R.
Results and discussion
Genome sequencing, assembly, and annotation
We obtained a total of 30.6 Gb (~90-fold coverage with the estimated genome size) single-molecule real-time sequences from 22 Pacbio RS II cells (Supplemental Table S1). The final assembly of ramie genome yielded 268.24 Mb contigs and contained 522 contigs (N50: 1.36 Mb) () with the largest contig length of about 6.14 Mb, a 47-fold improvement (Luan et al. Citation2018). To anchor and orient the contigs, we constructed a linkage map, with 253 F1 mapping population and two parents using RAD sequencing (Supplemental Figures S1–2, Supplemental Table S2), which contains 13149 RAD-based DNA markers consisting of 5,796 loci covering 2,934.3 cM on 14 consensus genetic linkage groups (, Supplemental Table S3). A total of 11289 markers were used to anchor the contigs to a consensus genetic linkage map. In total, 305 contigs with 241.85 Mb length were anchored to 14 chromosomes with Pearson’s correlation coefficients ranging from 0.942 to 0.997, illustrating the high congruence between genome assembled sequences and genetic map data (; Supplemental Table S3, Supplemental Figure S3-9).
Figure 1. Features of ramie genome and differentially expressed genes distributions. Intra-genome syntenic blocks (a), gene expression between high fiber fineness and low fiber fineness in different stages (T1-T5 respectively represent b-f), GC content (g), repeat content (h), LTR density (i), gene density (j), and the chromosomes (k).
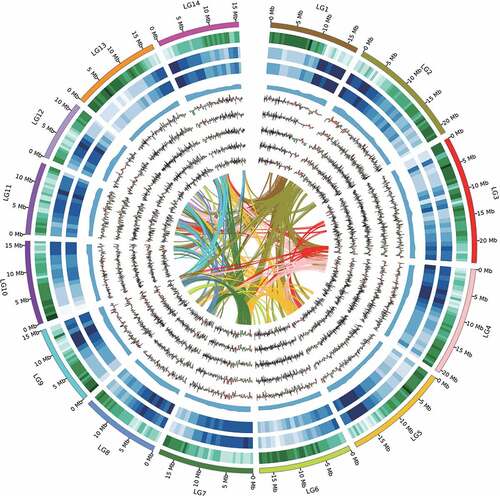
Table 1. Summary statistics of ramie assembly genome compared with that of published draft genomes.
To evaluate the genome assembly quality, the assembled transcript sequences were aligned against the assembled genome. A total of 97.57% of transcripts were covered by genome and the mapping rates were 93.42% and 99.13% with >90% and >50% identity in one scaffold, respectively (Supplemental Table 4). The BUSCO evaluation showed high quality of genome assembly with 98.1% completeness of the 1,614 genes in the Plantae BUSCO dataset (Simao et al. Citation2015) (Supplemental Table 5), which was more complete than that of 96.0% in previously reported genomes (Wang et al. Citation2021). In addition, the LAI score of ramie genome is 14.47 (Supplemental Figure 10), which also proved the high quality of this updated genome.
A total of 27,664 protein-coding genes (Supplemental Table 6) were predicted. On average, the genes encode transcripts of 1,233.8 bp with 5.09 exons and exon length is 242.15 bp, which is longer than the C. capsularis, C. olitorius, and M. notabilis genome (Supplemental Table 7). Among these predicted genes, 88.99% could be functionally annotated (Supplemental Table 8) and 94 miRNA, 578 tRNA, 197 rRNA were identified (Supplemental Table 9).
Genome evolution and gene family expansion
Comparative genomic and evolutionary analysis was performed between ramie and 14 other sequenced plant genomes, including representatives from the Monocots (Oryza sativa), Asterids (Solanum tuberosum), Rosids (Vitis vinifera, Linum uitatissimum and so on) (Supplemental Figure 11). The phylogenetic analysis was applied to 450 genes including single-copy and one-to-one orthologous genes, the results supported the placement of ramie with mulberry and cannabis in the Urticales and showed that B. nivea diverged withM. notabilis ~48.2 million years ago (Mya) and C. sativa (the nearest family species), ~64.0 Mya (Supplemental Figure 12). The gene families were identified as unique, shared, and expansion among the 15 plants (Supplemental Figures 11–12). We found 2,047 and 795 gene families that, respectively, expanded and contracted in the B. nivea genome compared with other 14 plant genomes (Supplemental Figure 12). Among these gene families, 69 gene families exhibited significant (p-value ≤.01) expansions, which are mainly enriched in physiological processes, such as biosynthesis of secondary metabolites and so on (Supplemental Figure 13, Supplemental Table 10).
QTL analysis of fiber fineness and fiber yield related traits
Fiber fineness is one of the key factors to evaluate the quality of ramie fiber, but it is inversely proportional to fiber yield (including plant height, ramet number, stem diameter, and bark thickness), which is the bottleneck in the breeding of high-quality fiber ramie varieties. Based on the high-density linkages mentioned above and the phenotypic data (Supplemental Figure 14), QTLs of fiber fineness and fiber yield-related traits were analyzed. In total, 58 QTLs of fiber fineness were identified with LOD value >3.0, which explained more than an average of 10% phenotype variance (Supplemental Figure 15, Supplemental Table 11). There were four QTLs that simultaneously controlled fiber fineness and ramet number, while two QTLs that simultaneously controlled fiber fineness and bark thickness (Supplemental Figure 15). Ten QTLs that controlled plant height and seven QTLs that controlled stem diameter, were found to simultaneously control fiber fineness. The linked QTLs synchronously controlled fiber quality and fiber yield in ramie identified in our study may explain why ramie fiber fineness is inversely proportional to fiber yield, which provided valuable reference information for the breeding of fiber quality improvement varieties in ramie.
Identification of key pathways and related genes regulating ramie fiber fineness
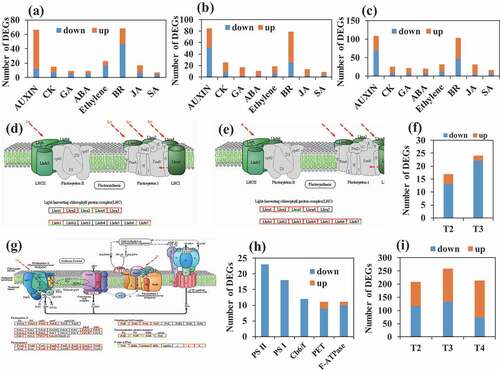
To reveal the molecular mechanism of fiber fineness regulatory, we did RNA-seq for 30 samples of ramie phloem fibers from two ramie varieties with high fiber fineness (H) and low fiber fineness (L) at 5 developmental stages (T1, T2, T3, T4, and T5) (, Supplemental Table 12). Differentially expressed genes (DEGs) were identified (Supplemental Figure 17A-D) and KEGG analysis was performed to investigate the detailed function of DEGs (Supplemental Figures 18–22). The plant hormone signal transduction pathway was specific in T1, T2, and T3, which mainly included auxin, brassinosteroid, ethylene, and cytokinine signal transduction (, Supplemental Figures 18–20). Auxin was more active in H at the early stage of fiber development judging by its higher number of up-regulated genes. Surprisingly, many genes in photosystem I, photosystem II, cytochrome b6/f complex, photosynthetic electron transport, and F-type ATPase were down-regulated in T2 and T3 (), suggesting that there was a weak photosynthetic system in H, which may also lead to a weak photosynthesis. Previously, there was evidence showing that photosynthetic rate was inversely proportional to fiber fineness in ramie (Peng and Yang Citation1986), and our study underlies the molecular regulatory mechanisms at the transcriptomic level for the first time.
Figure 2. Qtls of fiber fineness and fiber fineness related genes. (a) phenotype of the high (h) and low (l) fiber fineness ramie varieties. (a) stems of H and L. (b) and (c) transverse section of phloem fiber cell observed by optical microscope. The cells pointed by the red arrows are the bast fiber cells. The red bar indicates a scale of 50 μm. (d) fiber fineness of H and L. Data were means ± standard deviation (SD) of three replicates. Each replicate included 10 individual plant. (e) length and width of fiber cell of H and L. Each replicate included 250 cells from five areas of one slice. ** denotes significantly different from L at P < .01. (B), (c) and (d) QTLs of fiber fineness, the related genes mapped on the corresponding chromosomes, and gene expression. The values of gene expression were determined by the log2 fold change (H/L) values. T1-T5 denote the five stages of ramie fiber development. The genes in red color were differentially expressed in the two varieties.
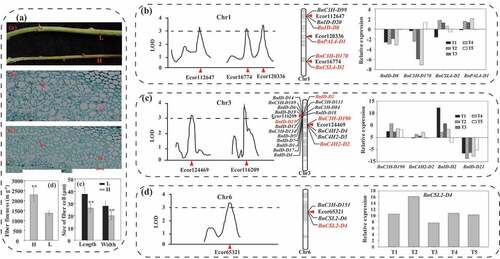
Figure 3. Degrees of significant pathways identified by transcriptome analysis of the high (H) and low (L) fiber fineness ramie varieties during fiber development. (a), (b) and (c) number of DEGs in the pathway of plant hormone signal transduction at the first (T1), second (T2) and third (T3) stage of ramie fiber development, respectively. (d), (e) and (f) DEGs in the pathway of photosynthesis-antenna proteins at the T2 (d) and the fourth (T3) stage (e). The red and green box denotes down- and up-regulated genes, respectively. (g) and (h) DEGs in the pathway of photosynthesis at the T3 stage. The red and green box denotes down- and up-regulated genes, respectively. (l) number of DEGs in the pathway of starch and sucrose metabolism at the T2, T3, and T4 stage.
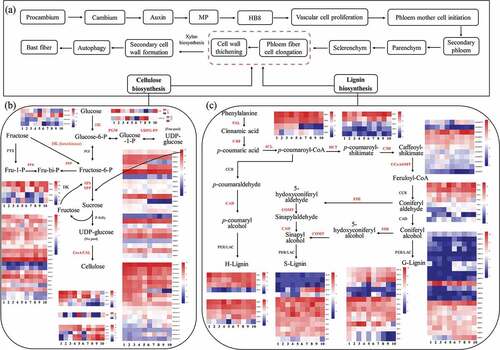
The pathway of starch and sucrose metabolism was specifically enriched in T2, T3, and T4 (, Supplemental Figures 18–20), including glucose, fructose, and cellulose biosynthesis, and metabolism. Cellulose is the main component of plant fiber, according to the pathway of fiber formation in other plants (Taylor-Teeples et al. Citation2015; Zhao and Dixon Citation2011). Here, we proposed a model of ramie fiber formation, containing the pathways of cellulose and lignin synthesis (). We identified 102 and 236 cellulose and lignin synthesis-related genes, and found CesA1.1, CesA2.1, CesA2.2, CesA2.4, CesA6.1, CesA6.3, CesA6.4, BnCSL4-D2, BnCSL2-D4, BnID-D8, BnC3H-D170,0 and BnPAL-D1 were significantly differentially expressed between H and L (; ; Supplemental Table 13), suggesting the major role of these genes in regulating ramie fiber fineness. We also predicted 18 cellulase genes in ramie genome, which might be an important factor in degradation of ramie fiber. Among these genes, cellulase.7, and cellulase.9 were reduced expressed in H, while cellulase.13, cellulase.15, and cellulase.17 were induced, underlying the main role of these genes in regulating ramie fiber fineness.
Figure 4. Effects of ethylene on fiber fineness of ramie. (a) overview of ethylene biosynthesis pathway. SAMS, S-adenosyl-L-methionine synthase. ACS, 1-aminocyclopropane-1-carboxylic acid synthase. ACO, 1-aminocyclopropane-1-carboxylic acid oxidase. (b) expression patterns of SAMS, ACS and ACO family genes in ramie bast fiber of H and L at different fiber development stages. (c) overview of ethylene signal transduction pathway. (d) expression patterns of ETR, CTR, EIN2, EIN3, EBF and ERF family genes in ramie bast fiber of H and L at different fiber development stages. T1-T5 denotes five stages of fiber development, respectively. (e) mapping of ethylene biosynthesis and signal transduction associated genes on the region of fiber fineness QTLs. (f) growth of ramie plants under ethylene treatment and optical microscopic observation of the transverse section of phloem fibers. 0–400 mg·L−1 denote the concentrations of ethephon treatment. 7–43 d denote treatment time with ethephon. The red bar indicates a scale of 50 μm. (g), (h) length and width of transverse section of phloem fiber cells. Data are means ± standard deviation (SD) of three replicates. Each replicate consisted of cells from five different regions of the same slice. Fifty cells were measured in each region.
Lignin is also a main component of the fiber cell wall, which determines the size of the fiber cell so as to determine the fiber fineness. Compared with L, C3 H, HCT.8 and HCT.9 were silence expressed in H (). Differently, 4CL.13, 4CL.14, 4CL.9, F5 H.6, COMT.16, COMT.17, COMT20, and COMT.9 were dominantly expressed in H, highlighting possible high-lignin bast fiber in ramie which may suppress the expansion of fiber cells and result in high fiber fineness. There were 20 lignin-related genes could map on chromosome 3 distributed near the fiber fineness QTLs Ecor116209 and Ecor124469, but only four genes (BnID-D21, BnID-D2, BnC3 H-D190, and BnC4H2-D2) exhibited differential expression between H and L (), indicating that these lignin-related genes showed functional redundance in ramie fiber development. BnC3 H-D190 and BnID-D21 was, respectively, up- and down-regulated in H at the five stages, while BnC4H2-D2 was up-regulated at T2-T4 and BnID-D2 was up-regulated at T1-T4, indicating gene functional division in ramie fiber development.
Ethylene involves in the regulating of ramie fiber fineness
Previous studies have suggested the critical regulating role of ethylene in cotton fiber cell elongation (Qin et al. Citation2007; Qin, Hu, and Zhu Citation2008; Shi et al. Citation2006), and there is also evidence that ethylene can increase ramie fiber fineness (Ouyang Citation2016; Wang et al. Citation2012). The core synthases in ethylene biosynthesis include S-adenosyl-L-methionine synthase (SAMS), 1-aminocyclopropane-1-carboxylic acid synthase (ACS), and 1-aminocyclopropane-1-carboxylic acid oxidase (ACO) (). We identified two SAMS, seven ACSs, and four ACO genes in the ramie genome (Supplemental Table 14, ). The conversion of SAM to 1-aminocyclopropane-1-carboxylic acid (ACC) by ACS is generally considered to be the first committed step (Yang and Hoffman Citation1984) and also regarded as a rate-limiting step in the ethylene biosynthetic pathway (Prescott and John Citation1996). The dominant expression of BnACS1, BnACO2, BnACO1, BnACO2, BnACO3, and BnACO4 in H suggested the higher ethylene biosynthesis capacity in H, which resulted in high fiber fineness (, Supplemental Figure 23A, B). The result of the ethylene treatment experiment showed that the size of fiber cell was inhibited under ethylene treatments (, Supplemental Figure 24). These results confirmed that ethylene played a role in regulating the fineness of ramie phloem fiber.
Figure 5. A proposed model of ramie fiber formation. (a) overview of ramie fiber formation. (b) and (c) pathway of cellulose and lignin biosynthesis, respectively. The heatmap showed the FPKM of each corresponding gene. The number 1–5 under the heatmaps denotes the T1, T2, T3, T4, and T5 of the low fiber fineness ramie variety (L), respectively, and 6–10 denotes the T1, T2, T3, T4, and T5 of the high fiber fineness ramie variety (H), respectively.
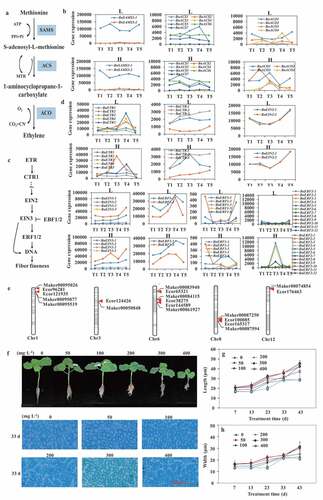
After ethylene synthesis, it is perceived by receptors located in the membrane and its signal transduced through transduction machinery to trigger specific biological responses (Wang, Li, and Ecker Citation2002). The main nodes and related genes of the ethylene signal transduction pathway have been well characterized (). We identified 5 ETR, 3 CTR, 2 EIN2, 6 EIN3, 2 EBF1, 2 EBF2, 7 ERF1, and 12 ERF2 genes in the ramie genome (Supplemental Table 14, ). BnETR2, BnCTR1, BnEIN3-3, BnEIN3-5, BnERF1-1, BnERF1-2, BnERF1-3 was significantly higher expressed in H (; Supplemental Figure 23C, D). As important ethylene receptors, ETR gene family members showed similar expression models with the BnACO1, BnACO3, and BnACO4 genes. CTR1 is a negative regulator and became inactivated after it activated the downstream components including EIN2, EIN3, and ERF (Shakeel et al. Citation2013), thus the reduced expression of BnEIN2-1 and BnEIN2-2 in H may be resulted from the high expression of BnCTR-3. However, our data suggested that some of the EIN3 and ERF gene family members may present different regulatory mechanisms in H, as the transcripts of BnEIN3-2, BnERF2-1, BnERF2-4, BnERF2-11 in this study accumulated rapidly at T3, which may activate the downstream genes to regulate ramie fiber fineness. Overall, our data suggested that transcripts of ethylene biosynthetic genes specifically accumulated at the elongation and thickening stage of ramie fiber, and then stimulated ethylene signaling-related genes to trigger downstream genes, which may finally regulate ramie fiber fineness.
Conclusions
In conclusion, we presented a high-quality genome assembly of ramie at chromosome level, revealed the molecular mechanism of fiber fineness regulation at transcriptome level, and found that ethylene plays a critical role in regulating of ramie fiber fineness. Our study will facilitate the molecular biology research in ramie and provide valuable reference for the improvement of high-quality fiber varieties as well.
Highlights
This study presented a high-quality genome assembly of ramie at chromosome level, which was more complete in gene content than that of the previous assembly.
This study identified linked QTLs simultaneous controlling fiber quality and fiber yield in ramie, which explain why ramie fiber fineness is inversely proportional to fiber yield.
This study revealed the molecular mechanism of fiber fineness regulation at transcriptome level for the first time, and confirmed that ethylene plays a critical role in regulating of ramie fiber fineness.
Supplemental Material
Download Zip (14.4 MB)Supplemental Material
Download Zip (14.4 MB)Acknowledgements
We thank the Science and Technology Innovation Project of the Chinese Academy of Agricultural Sciences (CAAS-ASTIP-2018-IBFC04), the Ramie Breeding Station of the National Fiber Industry Technology System (CARS-19-E02), the National Natural Science Foundation of China (31801413), Innovative Provinces Building Program 745 of Hunan Province (2019Nk2061), the National Breeding Center of Bast Fiber Crops, and the Key Laboratory of Genetic Breeding and Microbial Processing for Bast Fiber Crop Product of Hunan Province.
Disclosure statement
No potential conflict of interest was reported by the author(s).
Supplementary material
Supplemental data for this article can be accessed online at https://doi.org/10.1080/15440478.2023.2168819
Additional information
Funding
References
- Brims, M., and H. Hornik. 2000. Rapid image processing for measuring fiber characteristics. International Fiber Journal 15 (5):63–12.
- Cai, S., and C. C. Lashbrook. 2006. Laser capture microdissection of plant cells from tape-transferred paraffin sections promotes recovery of structurally intact RNA for global gene profiling. The Plant Journal 48 (4):628–37. doi:10.1111/j.1365-313X.2006.02886.x.
- Chin, C. S., P. Peluso, F. J. Sedlazeck, M. Nattestad, G. T. Concepcion, A. Clum, C. Dunn, R. O’Malley, R. Figueroa-Balderas, A. Morales-Cruz, et al. 2016. Phased diploid genome assembly with single-molecule real-time sequencing. Nature Methods 13 (12):1050–54. doi:10.1038/nmeth.4035.
- De Bie, T., N. Cristianini, J. P. Demuth, and M. W. Hahn. 2006. CAFE: A computational tool for the study of gene family evolution. Bioinformatics 22 (10):1269–71. doi:10.1093/bioinformatics/btl097.
- Edgar, R. C. 2004. MUSCLE: Multiple sequence alignment with high accuracy and high throughput. Nucleic acids research 32 (5):1792–97. doi:10.1093/nar/gkh340.
- Liu, C., L. B. Zeng, S. Y. Zhu, L. Q. Wu, Y. Z. Wang, S. W. Tang, H. W. Wang, et al. 2018. Draft genome analysis provides insights into the fiber yield, crude protein biosynthesis, and vegetative growth of domesticated ramie (Boehmeria nivea L. Gaud). DNA Research 25 (2):173–81. doi:10.1093/dnares/dsx047.
- Luan, M. B., J. B. Jian, P. Chen, J. H. Chen, J. H. Chen, Q. Gao, G. Gao, J. H. Zhou, K. M. Chen, X. M. Guang, et al. 2018. Draft genome sequence of ramie, Boehmeria nivea (L.) gaudich. Molecular Ecology Resources 18 (3):639–45. doi:10.1111/1755-0998.12766.
- Ouyang, Y. 2016. Effects of ethephon and paclobutrazol applications on ramie yield and fiber quality. Dissertation of Huazhong Agricultural University, Wuhan, China 2:1–62.
- Peng, D. X., and Z. S. Yang. 1986. Studies of photosynthetic characteristics in relation to yield and fiber properties in ramie. Journal of Huazhong Agricultural University 5 (1):56–61.
- Prescott, A., and P. John. 1996. DIOXYGENASES: Molecular structure and role in plant metabolism. Annual Review Plant Physiology Plant Molecular Biology 47 (1):245–71. doi:10.1146/annurev.arplant.47.1.245.
- Qin, Y. M., C. Y. Hu, Y. Pang, A. J. Kastaniotis, J. K. Hiltunen, and Y. X. Zhu. 2007. Saturated very-long-chain fatty acids promote cotton fiber and Arabidopsis cell elongation by activating ethylene biosynthesis. The Plant Cell 19 (11):3692–704. doi:10.1105/tpc.107.054437.
- Qin, Y. M., C. Y. Hu, and Y. X. Zhu. 2008. The ascorbate peroxidase regulated by H2O2 and ethylene is involved in cotton fiber cell elongation by modulating ROS homeostasis. Plant Signaling Behavior 3 (3):194–96. doi:10.4161/psb.3.3.5208.
- Shakeel, S. N., X. M. Wang, B. M. Binder, and G. E. Schaller. 2013. Mechanisms of signal transduction by ethylene: Overlapping and non-overlapping signalling roles in a receptor family. AoB Plants 5 (0):lt010. doi:10.1093/aobpla/plt010.
- Shi, Y. H., S. W. Zhu, X. Z. Mao, J. X. Feng, Y. M. Qin, L. Zhang, J. Cheng, L. P. Wei, Z. Y. Wang, and Y. X. Zhu. 2006. Transcriptome profiling, molecular biological, and physiological studies reveal a major role for ethylene in cotton fiber cell elongation. The Plant Cell 18 (3):651–64. doi:10.1105/tpc.105.040303.
- Simao, F. A., R. M. Waterhouse, P. Ioannidis, E. V. Kriventseva, and E. M. Zdobnov. 2015. BUSCO: Assessing genome assembly and annotation completeness with single-copy orthologs. Bioinformatics 31 (19):3210–12. doi:10.1093/bioinformatics/btv351.
- Taylor-Teeples, M., L. Lin, M. de Lucas, G. Turco, T. W. Toal, A. Gaudinier, N. F. Young, G. M. Trabucco, M. T. Veling, R. Lamothe, et al. 2015. An Arabidopsis gene regulatory network for secondary cell wall synthesis. Nature 517 (7536):571–75. doi:10.1038/nature14099.
- Topdar, N., A. Kundu, M. K. Sinha, D. Sarkar, M. Das, S. Banerjee, C. S. Kar, P. Satya, H. S. Balyan, B. S. Mahapatra, et al. 2013. A complete genetic linkage map and QTL analyses for bast fibre quality traits, yield and yield components in jute (Corchorus olitorius L.). Cytology & Genetics 47 (3):129–37. doi:10.3103/S0095452713030092.
- Wang, K. L., H. Li, and J. R. Ecker. 2002. Ethylene biosynthesis and signaling networks. The Plant Cell 14 (Suppl 1):S131–151. doi:10.1105/tpc.001768.
- Wang, Y. Z., F. Li, Q. Y. He, Z. G. Bao, Z. Zeng, D. An, T. Zhang, L. Yan, H. Wang, S. Zhu, et al. 2021. Genomic analyses provide comprehensive insights into the domestication of bast fiber crop ramie (Boehmeria nivea). The Plant Journal 107 (3):787–800. doi:10.1111/tpj.15346.
- Wang, L., J. H. Zhou, H. C. Xing, S. S. Bai, and J. Li. 2012. Effect of gibberellin and ethephon on the character yield and quality of different gender ramie. Crop Research 26 (1):20–24.
- Xie, J. R., J. Q. Li, Y. C. Jie, D. Y. Xie, D. Yang, H. Z. Shi, and Y. L. Zhong. 2020. Comparative transcriptomics of stem bark reveals genes associated with bast fiber development in Boehmeria nivea L. gaud (ramie). BMC Genomics 21 (1):40. doi:10.1186/s12864-020-6457-8.
- Yang, S. F., and N. E. Hoffman. 1984. Ethylene biosynthesis and its regulation in higher plants. Annual Review Plant Physiology 35 (1):155–89. doi:10.1146/annurev.pp.35.060184.001103.
- Zeng, Z., Y. Z. Wang, C. Liu, X. F. Yang, H. Y. Wang, F. Li, and T. M. Liu. 2019. Linkage mapping of quantitative trait loci for fiber yield and its related traits in the population derived from cultivated ramie and wild B. nivea var. tenacissima. Scientific Reports 9 (1):16855. doi:10.1038/s41598-019-53399-5.
- Zhang, L. W., Y. Xu, X. T. Zhang, X. K. Ma, L. L. Zhang, Z. Y. Liao, Q. Zhang, X. Wan, Y. Cheng, J. Zhang, et al. 2020. The genome of kenaf (Hibiscus cannabinus L.) provides insights into bast fibre and leaf shape biogenesis. Plant Biotechnology Journal 18 (8):1796–809. doi:10.1111/pbi.13341.
- Zhao, Q., and R. A. Dixon. 2011. Transcriptional networks for lignin biosynthesis: More complex than we thought? Trends in plant science 16 (4):227–33. doi:10.1038/nature14099.