
 ?Mathematical formulae have been encoded as MathML and are displayed in this HTML version using MathJax in order to improve their display. Uncheck the box to turn MathJax off. This feature requires Javascript. Click on a formula to zoom.
ABSTRACT
Banana stem is a known alternative to wood for the production of pulp and paper. During the production of paper, it is extremely important to save costs and time while at the same time enhancing quality of produced paper. In the present study, paper was developed from banana stem fiber by optimizing its density. Response surface methodology (RSM) using Box-Behnken design (BBD) was used to determine optimum blending parameters of the developed papers. The influence of banana stem fiber amount (250-1000 g), water amount (1-2liters) and blending time (5-10 min) on paper density was analyzed using software Stat-Ease 360, Version 13. The optimum conditions of banana stem fiber amount, water amount and blending time to achieve a density of 675.75 g/m3 were determined as 461.83 g, 1.31liters, and 8.53 min, respectively. ANOVA results revealed that the quadratic model best fits the density response, with blending time and banana stem fiber amount as the most significant model terms. Linear effects were more predominant than quadratic and interaction effects. The developed density model was in close agreement with experimental findings with an R2 value of 0.9748. Developed paper had cellulosic contents, with volatiles as high as 82.11%wb and 2.11%wb ash composition. Future works on thermal properties of paper are encouraged.
摘要
香蕉茎是用于纸浆和纸张生产的木材的已知替代品. 在纸张生产过程中,节约成本和时间,同时提高生产纸张的质量是极其重要的. 在本研究中,以香蕉茎纤维为原料,通过优化其密度来开发纸张. 使用BBD的RSM来确定所开发纸张的最佳共混参数. 使用Stat Ease 360 13版软件分析了香蕉茎纤维量(250-1000 g)、水量(1-2升)和混合时间(5-10分钟)对纸张密度的影响. 确定了香蕉茎纤维量、水量和混合时间达到675.75 g/m3密度的最佳条件分别为461.83 g、1.31liters和8.53 min. 方差分析结果表明,二次模型最适合密度响应,混合时间和香蕉茎纤维量是最显著的模型项. 线性效应比二次效应和相互作用效应更为显著. 所开发的密度模型与实验结果非常一致,R2值为0.9748. 开发的纸张含有纤维素,挥发物的wb含量高达82.11%,灰分含量高达2.11%. 鼓励进一步研究纸张的热财产.
Introduction
Paper products have continued to be extremely essential items in everyday life (Wen et al. Citation2017). Approximately 90% of the paper available worldwide is produced from wood, which is dependent on forest resources (Megra et al. Citation2022). As a result, deforestation has risen in order to meet the supply of wood fiber (Ramdhonee and Jeetah Citation2017). Recent studies have projected that Uganda´s wood demand would increase from 48 million tonnes in 2015 to 105 million tonnes by 2040, translating to an increased wood demand of more than twofold. Moreover, with such increase in wood demand, all the sustainable wood supply, both inside and outside forests, would be depleted by 2035 (Citationundefined). This worrying trend has led to an increase in environmental awareness and pressure on researchers to find potential alternative raw materials for papermaking from non-wood resources (Jirukkakul Citation2019; Mahale and Goswami-Giri Citation2015; Ramdhonee and Jeetah Citation2017). Agricultural residues are some of the alternative materials which can be utilized to make paper due to their numerous economic, environmental and technological advantages (Rashid et al. Citation2014).
Uganda is a pre-dominant agricultural country with the sector employing nearly 80% of Ugandans either directly or indirectly (Call, Gray, and Jagger Citation2019; Yiga, Lubwama, and Olupot Citation2021b). Banana fruits (matooke) are a majorly grown and a leading staple food in the country. In fact, Uganda is the second largest global producer of bananas after India and remains the leading producer in Africa, with annual production estimated at 9.77 million tonnes (Gumisiriza et al. Citation2017). Over 70% of the farmers in major producing districts within the Lake Victoria basin grow bananas as a primary crop and over 50% depend on banana for food and income security (Tumutegyereize Citation2011). Agricultural by-processing of matooke is associated with a number of residues which are often left to rot in gardens after harvesting matooke, due to fungi attack (Hussain and Tarar Citation2014; Padam et al. Citation2014). In fact, over 3 million tonnes of banana stem waste are generated annually in Uganda (Rietveld et al. Citation2013). Degradation of banana stems significantly contributes to greenhouse gas (GHG) emission, as well as contributes to breeding places for disease vectors which enhances proliferation of pests (Hussain and Tarar Citation2014). Banana stems contain high amount of cellulose (≈67.34%) of the total weight, with tensile strength of 550 MPa, tensile modulus of 3.5MPa and density of 1.35 g/cc, which make them suitable raw materials for the paper and pulp industry (Sakare et al., Citation2021; Basak et al. Citation2015; Bhatnagar, Gupta, and Yadav Citation2015; Senthilkumar et al. Citation2018). Cellulose, which is primarily present in the secondary cell wall of plant fiber, plays a major role in providing strength (Abdul Razab et al. Citation2021). Banana stems are underutilized in Uganda and many other developing nations, due to limitations in methods necessary to convert them into useful products. Meanwhile, banana stems can be sustainably and suitably used as raw material to produce paper with required mechanical properties like thickness, density and tensile strength (Karlsson Citation2010; Mohamad and Jai Citation2022; Ramdhonee and Jeetah Citation2017). Density is a very important mechanical property for utilization in real-life applications like packaging because it is directly related to the bond strength of materials used to make the paper (Jung et al. Citation2018; Karlsson Citation2010; Khan et al. Citation2014). Moreover, future works on thermal properties of paper are encouraged for their use in flame retardant packaging solutions.
A traditional approach to experimental work for developing paper from banana stem fiber can be to vary one factor at a time, holding other factors fixed but this is extremely time consuming and unable to produce satisfactory results in a wide range of experimental settings (Tharazi et al. Citation2017). Response surface methodology (RSM) is the best way to solve the complexity of developing banana stem fiber paper with the required mechanical properties. Previous studies such as Menya et al. (Citation2020) found that RSM is effective in optimizing response variables against independent factors. RSM is an effective tool for optimizing the density of paper developed from banana stem fiber. One such RSM design is the Box-Behnken design (BBD). BBD is more efficient than designs because Box-Behnken Designs are fast, economically convergent, rotatable and do not contain combinations for which all factors are simultaneously at their highest or lowest levels (Yiga et al. Citation2021a; Zhao et al. Citation2016). Therefore, the aim of this work was the use of a Box-Behnken design for the characterization of different factors on the density of paper developed from banana stem fiber. These factors included banana stem fiber amount, water amount, and blending time.
Materials and methods
Materials
Banana stem fibers were obtained from Kampala district, Central Uganda. Sodium hydroxide (NaOH) (CAS number 1310-73-2) with a molecular weight of 40 g/mol was supplied by Lab Access Uganda Ltd, Kampala, Uganda. Distilled water was also obtained from Lab Access Uganda Ltd, Kampala, Uganda.
Methods
Design of experiments
Density was optimized using a standard RSM design called Box-Behnken design (BBD). Such design is highly efficient because it is rotatable and does not contain combinations for which all factors are simultaneously at their highest or lowest levels (Yiga, Lubwama, and Olupot Citation2021a). Banana stem fiber amount, water amount, and blending time were employed as the three input numeric factors in this study in ranges of 250–1000 g, 1–2 liters, and 5–10 min, respectively (see ).
Table 1. Actual and coded factors for the Box-Behnken design.
Using Stat-Ease 360 software (version 13, Stat-Ease Inc., Minneapolis, USA), 17 runs were planned using Equation 1 in a randomized order to minimize the effects of the uncontrolled factors. The runs for the numeric factors consisted three level factors () and five replicated central points (
) at the central points (0,0,0).
The influence of the three numeric factors on the density of developed paper samples was modeled using a second-order polynomial shown in Equation 2.
where is the predicted response value (density),
is the model constant,
is the linear coefficient,
is the interaction coefficient,
is the quadratic coefficients,
is the independent factors in coded values,
is the number of factors studied and optimized in the experiment, and
is the experimental error.
Paper production
Banana stem was washed using distilled water and chopped into several thin pieces≤1 inch long to increase surface area. The chopped pieces were then sun dried for 2 days to remove all moisture. Chopped pieces (250–1000 g) were then added into boiling water of about 1–2 liters for 30 mins. 25 ml of sodium hydroxide were added to the mixture. The boiled pieces were then strained and washed with distilled water. The pieces were then blended for 5–10 min in a Kenwood blender (1.5 liters capacity with 8 blades, running at 18,000 rev/min at 2000 watts) with 500 ml water to form pulp. The pulp was placed in a container of water and strained using a screen to get interlocked fibers which were dried to form paper.
Density determination
The density of the samples of paper developed from banana stem fiber were determined from the ratio of mass of developed paper sample to volume of the paper using Equation 3.
Optimized paper characterizations
Paper developed at optimized conditions for banana stem fiber amount, water amount, and blending time was characterized using proximate analysis, Scanning electron microscopy and Fourier Transform Infrared spectroscopy.
Proximate analysis
An Eltra Thermostep non-isothermal thermogravimetric analyzer, Haan, was used to determine the proximate analysis (moisture content, ash content, fixed carbon and volatile matter) of the developed banana stem papers on wet basis (%wb). Samples were heated from room temperature to about 920°C at a heating rate of 16°C/min. High-purity compressed air (Oxygen: Nitrogen = 21:79, > 99.99%) was used for cleaning the crucibles and chamber prior to experimentation. Nitrogen was used as the purge gas for pyrolysis. The flow rate was maintained at 1 L/min and the sample masses averaged 1.2 g (Lubwama et al. Citation2020).
Scanning Electron microscopy (SEM)
SEM was used to observe banana stem paper networks. Samples of paper developed from banana stem fiber were observed under a Tescan Vega 3 scanning electron microscope, Pleasanton, USA. Samples were fixed on double sided adhesive carbon tape, vacuum dried and scanned at an acceleration voltage of 10 kV (Basak et al. Citation2015).
Fourier Transform Infrared (FTIR) spectroscopy
The FTIR spectra of the samples of paper developed from banana stem fiber were collected in the range of 4000 to 400 cm−1 using a Jasco FT/IR-6600 type A machine, Cremella, Italy. The resolution was 4 cm−1, the scanning speed was 2 mm/sec. The paper samples were ground to obtain very fine powders using a mortar and pestle. The presence of free functional groups in the paper samples was determined based on the FTIR spectra (Abdul Razab et al. Citation2021).
Results and discussion
Model fitting
The model of density of the developed banana stem fiber papers was obtained using the Box-Behnken design (BBD). shows the experimental design, together with corresponding experimental values for the response (density) of the developed papers.
Table 2. BBD and the experimental results.
Runs 6, 7, 12, 13 and 17 at the center point were employed to determine the experimental error for reproducibility of the data. In order to obtain the best fit for density of the developed papers, the sequential model sum of squares values were considered. From each of these, the highest order polynomial, where the additional terms are significant, and the model is not aliased, was chosen. By applying multiple regression analysis to the response, the quadratic model was found to be the best fit of density. Analysis of Variance (ANOVA) was used to ascertain significant interaction between the three numeric factors and obtained densities based on their p values. In statistics, p values less than 0.05000 are considered significant while p values greater than 0.1000 were non-significant (Samson et al. Citation2016; Yiga et al. Citation2021b). The density () response surface reduced quadratic model is given in Equation 4.
where is Banana stem fiber amount (g),
is water content (liters) and
is blending time (min).
Analysis of variance (ANOVA)
ANOVA was used to determine statistically significant factors in the fitted model for density of the developed banana stem fiber paper (see ). Additionally, the model’s statistical significance of model coefficients was obtained. The F value (38.61) corresponding to the reduced quadratic model for density of the developed banana stem fiber paper implies that the developed model is significant with a p value<0.05 (Mehraz and Nouri Citation2020). There was only a 0.01% chance that model F values this large could occur due to noise (Lubwama, Yiga, and Lubwama Citation2020). Among the linear terms, blending time, with an F value of 275.29, was found to be the most significant influencing factor, followed by banana stem fiber amount (F value 17.64). The reduced quadratic model had significant quadratic effects between factors, based on the p values of 0.035 and 0.043 for banana stem fiber amount and water content respectively.
Table 3. Analysis of Variance results for response surface reduced quadratic model.
also lists the statistical data for density variance analysis. Coefficient of regression value (R2) of 0.9748 suggested that the model competently represented the relationship between significant model terms. This result signaled higher reliability of empirical model data due to the closeness of the R2 value to 1 (Pavani et al., Citation2016). Similarly, the observation for the model´s adjusted R2 value was close to 1 (0.9495), which showed that R2 and adjusted R2 values were in good agreement, with an approximately 95% confidence level (Mehraz and Nouri Citation2020; Senthilkumar et al. Citation2018). Moreover, the predicted R2 value (0.7571) was in reasonable agreement with adjusted R2 values because the difference was less than 0.2 (Menya et al. Citation2020). The low Coefficient of Variation (C.V.) value (1.82%) showed preciseness of the estimate between the actual and predicted model. The adequate precision ratio of 21.8583 indicated adequate signal and suggested that the respective models can be used to navigate the design space defined by the BBD because (Lubwama, Yiga, and Lubwama Citation2020).
In order to obtain the factorial weight or variance part of each factor, the sum of squares (SS) was taken from ANOVA data in (Chaker et al., Citation2021). As such, the total percentage contributions (TPC) of model terms in the reduced quadratic model were computed using Equations 5–7 for the linear, interaction, and quadratic terms respectively.
The linear effect is more predominant than the quadratic and interaction effects for density of the developed papers (see ). Furthermore, for linear effects (basing on sum of squares), blending time can generally be considered as the most important factor, followed by banana stem fiber amount and water amount. Respective sum of squares for these factors are 39,340.12, 2520.50 and 465.13.
Figure 1. Model term TPC for density of banana stem fiber paper.
Diagnostics and adequacy of residual plots
In order to verify if the suggested model provided a sufficient approximation of actual systems, adequacy of the fitted model was inspected. Normal probability plots of the externally studentized residuals were verified with the assumption of ANOVA values so as to check validity. shows the relationship for normal probability distribution and externally studentized residuals for the model of density of the developed papers. Almost all residual points were very close to the line of fit apart from Run 15 (740 g/m3). Similar findings have been reported by Omulo et al., (Citation2019). The correlation between externally studentized residuals and experimental runs for density of the developed papers is shown in . Almost all the data points fell inconstantly close to “0,” demonstrating constant variance in experimental observations. The highest value of residuals (4.781) was obtained with Run 15. This outlier effect explains why the obtained model´s R2 value could not reach 1.
Figure 2. (a) Normal probability-residual (b) residual-run (c) externally studentized residuals-predicted response (d) predicted-actual values for density of developed papers.
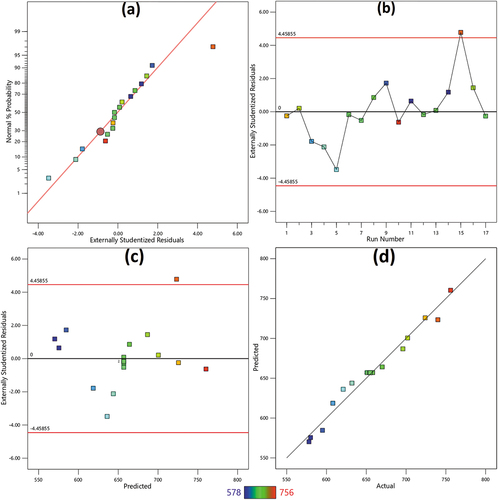
shows the relationship between externally studentized residuals and predicted density of the developed papers. Studentized residuals were randomly scattered in a constant range across plot “0.” These plots were randomly distributed, which validated the initial assumption of constant variance (Menya et al. Citation2020). Additionally, all residual data points apart from run 15 fell between+4.45855 and−4.45855, proving the adequacy of the reduced quadratic model. In order to obtain the standard deviation between experimental and predicted values, a linear plot for predicted verses actual values was used (see ). High degrees of correlation between the experimental and predicted values were noted because all scatter points were distributed close to the 45° line. This confirmed that the model can accurately be used to represent the relationships between the experimental factors and density of the developed papers.
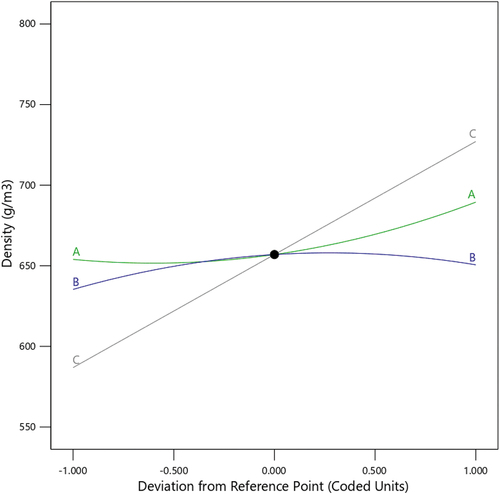
For a better understanding of the results, a perturbation plot was employed to provide correlations for process parameters (see ). The reference point was set in the center of the design space, which was the zero-coded level of each factor (635 g for banana stem fiber amount, 1.5 liters for water amount and 7.5 min for blending time). It was seen that density of the developed papers increased with increasing banana stem fiber amount and blending time. This is because blending banana stem fibers for longer times increases surface adhesion between the fibers which enhances their compactness. For water amount, density increased between low and center points and started decreasing thereafter. The reason for this is that adding chopped stem fibers to water contents above 1.5 liters rendered the pulp less thick (Muñoz et al. Citation2020). The curve curvatures for banana stem fiber amount and water amount are much sharper than that for blending time, indicating that the density was more sensitive to banana stem fiber amount and water amount. The high sensitivity is due to the quadratic effects of banana stem fiber amount and water amount (see EquationEquation 2(2)
(2) ).
Figure 3. Main effect perturbation plots for density of developed paper.
Response surfaces
shows the three-dimensional (3D) response and two-dimensional (2D) contour effects of the process factors on density of the developed papers. shows the interaction effect of water content and banana stem amount on density of the developed papers. It can be observed from the 3D surface plot that at both low and high water contents, increase in banana stem fiber amount led to increasing densities with 696 g/m3 at maximum banana stem fiber amount and maximum water content. This was possibly due to increasing thickness of fiber particles with increasing banana stem fiber amount. This effect is clearly seen in the 2D contour plot, where the density was lowest at 250 g of banana stem fiber amount (621 g/m3) and increased steadily up to 670 g/m3 at 1000 g of banana stem fiber amount.
Figure 4. 3D and 2D plots of (a) water content vs banana stem amount (b) blending time vs banana stem amount (c) blending time vs water content on density of developed papers.
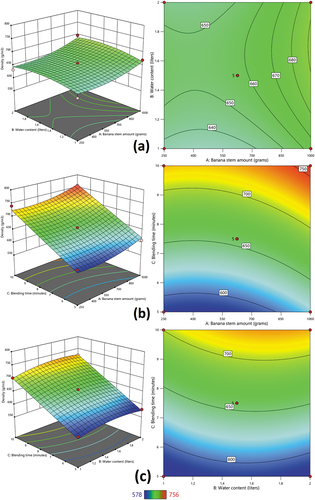
shows a silhouette view for all blending time vs banana stem fiber amount on paper density. The 3D response surface plot confirms that irrespective of the banana stem fiber amount, density of the developed papers increases with increase in blending time. The 2D contour plot illustrates that the highest density of 756 g/m3 was obtained at the highest banana stem fiber amount (1000 g) and the highest blending time (10 min). Similarly, the lowest paper density (595 g/m3) was obtained at the lowest banana stem fiber amount (250 g) and the lowest blending time (5 min).
The interaction effect for the response surface plot of blending time vs water content on density of the developed papers 4c. The 3D response surface plot confirms that irrespective of the water content, density of the developed papers increases with increase in blending time. The 2D contour plot illustrates that the highest density of 724 g/m3 was obtained at the highest water amount (2 liters) and the highest blending time (10 min). Similarly, the lowest paper density (578 g/m3) was obtained at the lowest water amount (1 liters) and the lowest blending time (5 min).
Process optimization
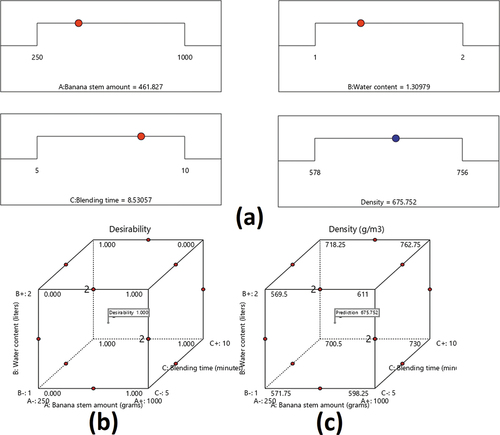
Numerical optimization method of the Design-Expert software was employed to arrive at the optimum conditions for development of paper with maximum density. shows the typical ramps (a), desirability cube (b) and density cube (c) for optimization of banana stem fiber amount, water content and blending time for the papers. As observed from , maximum density was obtained when the amount of banana stem fiber, water content, and blending time were kept in range. Moreover, the value for density was also kept in range from 578 to 756 g/m3. Typical ramp and cube for optimization of paper density are shown in . Optimal operating conditions for attaining maximum density included banana stem fiber amount of 461.83 g, water content of 1.31 liters and a blending time of 8.53 min. According to the BBD results, the predicted density was 675.75 g/m3 which was a 1.46% deviation from the experimental result at the optimal operating conditions. shows the individual and overall desirability as well as accruing densities for developed papers respectively. The obtained desirability was 1, for obtaining a density of 685.62 g/m3 which signaled effective response between the factors and the response (density) of this study.
Figure 5. Typical (a) ramp (b) desirability cube (c) density cube for optimization of banana stem amount, water content and blending time.
Paper characterization
Proximate composition
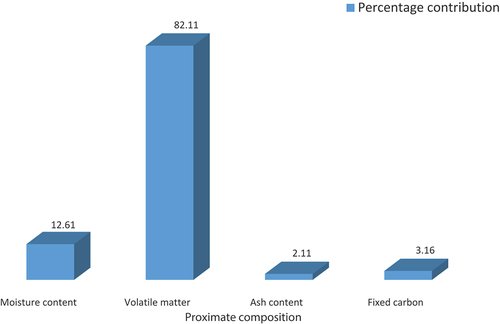
Proximate composition (moisture content, volatile matter ash content, and fixed carbon) of the developed papers on web basis is presented in . Moisture content and volatile matter in the developed paper were found to be 12.61%wb and 82.11%wb respectively. Similar results for moisture were obtained by Jirukkakul (Citation2019). The available moisture is due to the fact that banana stem fiber is inherently hydrophilic and naturally absorbs moisture from the atmosphere (Mochane et al. Citation2019). These high volatile matter compositions signify that it is easier to ignite these samples with proportionate increases in flame length in case of disposal by combustion or incineration (Tessema et al. Citation2019). Fixed carbon was 3.16%wb, signifying that these papers can be utilized to store hot materials without the packaging paper deteriorating by temperature of kept items. The paper samples had 2.11%wb ash content which signals ease of disposal without damaging disposal equipment. Ash is less desired in agricultural residues for paper production because it tends to accumulate in the finest sized fraction during paper processing due to the small size and brittleness of the inorganic materials (Liu and X Citation2011).
Figure 6. Proximate composition of the developed paper.
Surface morphologies
The SEM images of the developed paper samples are shown in . The samples showed a clean non-woven web of cellulosic fibers that are contained by an enveloping membrane, which is similar to the structure of inherent banana stem fiber material (Basak et al. Citation2015). The reason for this observance is because banana stems contain high amounts of cellulose (≈67.34%) (Sakare et al. Citation2021; Basak et al. Citation2015; Bhatnagar, Gupta, and Yadav Citation2015). Additionally, voids observed in the structure are linked to the hydrophilic structure of banana stem fiber materials, which is why the developed paper had reasonably high moisture compositions (see ). The morphology behaviors obtained in this study are similar to those obtained by Jirukkakul (Citation2019).
Figure 7. Surface morphologies of developed paper at magnifications of (a) 500 µm (b) 200 µm (c) 100 µm.
Surface functional groups
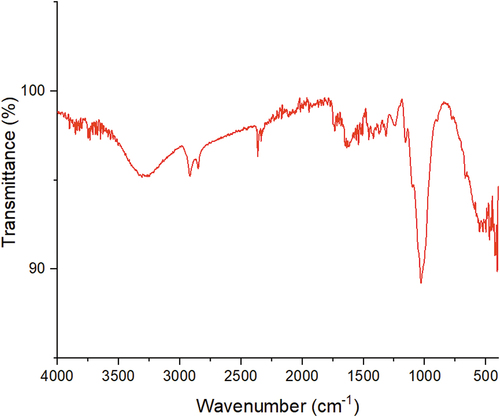
The FTIR spectra of developed paper is shown in . Peaks around 3300 cm−1, 2924‒2362 cm−1 and 1033 cm−1 are typical characteristic of cellulose backbone ascribed to – OH, C – H, and C – O–C stretching bands, respectively (Abdul Razab et al. Citation2021; d’Halluin et al. Citation2017; Mohamad and Jai Citation2022; Tibolla et al. Citation2018). The broadband at around 3300 cm−1, where moisture content could take part in the formation of hydrogen bonds, is associated with O−H vibrations in hydroxyl groups due to the presence of phenolic groups (Fu et al. Citation2010). This band indicates a free OH stretching vibration in the cellulose molecules of the inherent banana stem fiber (Abdul Razab et al. Citation2021). Sharp bands around 1646 cm−1 observed from the spectrum of banana stem fiber paper was ascribed to C=C stretching in aromatic ring of lignin within the banana stem fiber (Abdul Razab et al. Citation2021; Mohamad and Jai Citation2022; Tibolla et al. Citation2018). Bands around 1400 cm−1 are a depiction of CH2 stretching (Purnama and Primadiamanti Citation2021). It should be noted that the obtained result are similar to results of banana stem fiber material by Fatrozi et al. (Citation2020).
Figure 8. FTIR spectra of developed paper.
Conclusions
This study optimized the density of banana stem fiber paper through response surface methodology (RSM). The effect of banana stem fiber amount, water content, and blending time on density of the developed composites was evaluated using the Box-Behnken design (BBD). Blending time and banana stem fiber amount were found to exhibit the greatest influence on density of the developed papers. The linear effect was found to be more predominant than the quadratic and interaction effects for the developed density model with 95.7, 3.9, and 0.4% respective contributions to the total sums of squares. With R2, predicted-R2, and adjusted-R2 of 0.9748, 0.9495, and 0.7571 respectively, the obtained model showed good agreement between experimental and predicted values of density. Optimal conditions to achieve maximum density of 675.75 g/m3 were banana stem fiber amount, water amount and blending time of 461.83 g, 1.31 liters, and 8.53 min, respectively. Developed paper was found to have cellulosic compositions, with volatile content as high as 82.11%wb.
Highlights
Optimization and modeling of density of banana stem fiber paper using response surface methodology
Effect of operating parameters on density of banana stem fiber paper was estimated using Box – Behnken Design.
The optimum conditions of banana stem fiber amount, water amount and blending time to achieve a density of 675.75 g/m3 were determined.
Characterization of banana stem fiber paper using proximate analysis, SEM and FTIR.
Acknowledgements
This research was supported by funding from Yosevi Engineering Services Limited. Technical support from the Materials and Metallurgy Lab at Busitema University Tororo, Uganda is gratefully acknowledged.
Disclosure statement
No potential conflict of interest was reported by the author(s).
Additional information
Funding
References
- Abdul Razab, M. K. A., R. S. Mohd Ghani, F. A. Mohd Zin, N. A. A. Nik Yusoff, and A. A. Mohamed Noor. 2021. Isolation and characterization of cellulose Nanofibrils from banana Pseudostem, oil palm Trunk, and Kenaf bast fibers using chemicals and high-intensity ultrasonication. Journal of Natural Fibers 19 (13):1–16. doi:10.1080/15440478.2021.1881021.
- Basak, S., K. K. Samanta, S. K. Chattopadhyay, and R. Narkar. 2015. Thermally stable cellulosic paper made using banana pseudostem sap, a wasted by-product. Cellulose 22 (4):2767–76. doi:10.1007/s10570-015-0662-7.
- Bhatnagar, R., G. Gupta, and S. Yadav. 2015. A review on composition and properties of banana fibers. International Journal of Scientific & Engineering Research 6 (5):49–52.
- Call, M., C. Gray, and P. Jagger. 2019. Smallholder responses to climate anomalies in rural Uganda. World Development 115:132–44. doi:10.1016/j.worlddev.2018.11.009.
- Chaker, H., N. Ameur, K. Saidi-Bendahou, M. Djennas, and S. Fourmentin. 2021. Modeling and Box-Behnken design optimization of photocatalytic parameters for efficient removal of dye by lanthanum-doped mesoporous TiO2. Journal of Environmental Chemical Engineering 9 (1):104584. doi:10.1016/j.jece.2020.104584.
- d’Halluin, M., J. Rull-Barrull, G. Bretel, C. Labrugere, E. Grognec, and F. X. Felpin. 2017. Chemically modified cellulose filter paper for heavy metal remediation in water. ACS Sustainable Chemistry & Engineering 5 (2):1965–73. doi:10.1021/acssuschemeng.6b02768.
- Fatrozi, S., L. Purwanti, S. K. Sari, M. N. Ariesta, and S. D. Marliyana. 2020. Properties of starch biofoam reinforced with microcrystalline cellulose from banana stem fiber. In AIP Conference Proceedings 2237 (1): 020054–62.
- Fu, P., S. Hu, J. Xiang, P. Li, D. Huang, L. Jiang, J. Zhang, and J. Zhang. 2010. FTIR study of pyrolysis products evolving from typical agricultural residues. Journal of Analytical and Applied Pyrolysis 88 (2):117–23. doi:10.1016/j.jaap.2010.03.004.
- Gumisiriza, R., J. F. Hawumba, M. Okure, and O. Hensel. 2017. Biomass waste-to-energy valorisation technologies: A review case for banana processing in Uganda. Biotechnology for Biofuels 10 (1):1–29. doi:10.1186/s13068-016-0689-5.
- Hussain, I., and O. M. Tarar. 2014. Pulp and paper making by using waste banana stem. Journal of Modern Science and Technology 2 (2):36–40.
- Jirukkakul, N. 2019. Physical properties of banana stem and leaf papers laminated with banana film. Walailak Journal of Science and Technology (WJST) 16 (10):753–63. doi:10.48048/wjst.2019.3471.
- Jung, J., G. M. Raghavendra, D. Kim, and J. Seo. 2018. One-step synthesis of starch-silver nanoparticle solution and its application to antibacterial paper coating. International Journal of Biological Macromolecules 107:2285–90. doi:10.1016/j.ijbiomac.2017.10.108.
- Karlsson, H. 2010. Strength properties of paper produced from softwood Kraft Pulp: Pulp mixture, reinforcement and sheet stratification. PhD dissertation, Karlstads universitet, n.d.
- Khan, M. Z. H., M. A. R. Sarkar, F. I. Al Imam, M. Z. H. Khan, and R. O. Malinen. 2014. Paper making from banana pseudo-stem: Characterization and comparison. Journal of Natural Fibers 11 (3):199–211. doi:10.1080/15440478.2013.874962.
- Liu, X., and T. B. X. 2011. Removal of inorganic constituents from pine barks and switchgrass. Fuel Processing Technology 92 (7):1273–79. doi:10.1016/j.fuproc.2011.01.016.
- Lubwama, M., V. A. Yiga, and H. N. Lubwama. 2020. Effects and interactions of the agricultural waste residues and binder type on physical properties and calorific values of carbonized briquettes. Biomass Conversion and Biorefinery 12 (11):1–21. doi:10.1007/s13399-020-01001-8.
- Lubwama, M., V. A. Yiga, F. Muhairwe, and J. Kihedu. 2020. Physical and combustion properties of agricultural residue bio-char bio-composite briquettes as sustainable domestic energy sources. Renewable Energy 148:1002–16. doi:10.1016/j.renene.2019.10.085.
- Mahale, S., and A. S. Goswami-Giri. 2015. Environmental friendly approach in paper making using natural organic waste. Chem Sci Rev Lett 4:489–93.
- Megra, M. B., R. K. Bachheti, M. G. Tadesse, and L. A. Worku. 2022. Evaluation of Pulp and Papermaking Properties of Melia azedarach. Forests 13 (2):263–76. doi:10.3390/f13020263.
- Mehraz, L., and M. Nouri. 2020. Modification of silk fibers via β-cyclodextrin–empirical modeling and process optimization using response surface methodology. Journal of Natural Fibers 17 (8):1225–37. doi:10.1080/15440478.2018.1558154.
- Menya, E., P. W. Olupot, H. Storz, M. Lubwama, Y. Kiros, and M. J. John. 2020. Optimization of pyrolysis conditions for char production from rice husks and its characterization as a precursor for production of activated carbon. Biomass Conversion and Biorefinery 10 (1):57–72. doi:10.1007/s13399-019-00399-0.
- Mochane, M. J., T. C. Mokhena, T. H. Mokhothu, A. Mtibe, E. R. Sadiku, S. S. Ray, O. O. Daramola, and O. O. Daramola. 2019. Recent progress on natural fiber hybrid composites for advanced applications: A review. Express Polymer Letters 13 (2):159–98. doi:10.3144/expresspolymlett.2019.15.
- Mohamad, N. A. N., and J. Jai. 2022. Response surface methodology for optimization of cellulose extraction from banana stem using NaOH-EDTA for pulp and papermaking. Heliyon 8 (3):9114–25. doi:10.1016/j.heliyon.2022.e09114.
- Muñoz, P., V. Letelier, L. Muñoz, and M. A. Bustamante. 2020. Adobe bricks reinforced with paper & pulp wastes improving thermal and mechanical properties. Construction and Building Materials 254:119314–22. doi:10.1016/j.conbuildmat.2020.119314.
- Omulo, G., N. Banadda, I. Kabenge, and J. Seay. 2019. Optimizing slow pyrolysis of banana peels wastes using response surface methodology. Environmental Engineering Research 24 (2):354–361. doi:10.4491/eer.2018.269.
- Padam, B. S., H. S. Tin, F. Y. Chye, and M. I. Abdullah. 2014. Banana by-products: An under-utilized renewable food biomass with great potential. Journal of Food Science and Technology 51 (12):3545. doi:10.1007/s13197-012-0861-2.
- Pavani, S., Y. M. Rao, and Y. S. Kumar. 2016. Use of Box-Behnken Experimental design for Optimization of process Variables in Iontophoretic delivery of Repaglinide. JYP 8 (4):350–355. doi:10.5530/jyp.2016.4.10.
- Purnama, R. C., and A. Primadiamanti. 2021. Phytochemical screening and spectrum profile of functional group from Banana (Musa paradisiaca L.) stem waste extract using Fourier-transform Infrared (FTIR) Spectroscopy method. Journal of Physics: Conference Series, Indonesia, 2020 October 20–22, 1882 (1):12106–16.
- Ramdhonee, A., and P. Jeetah. 2017. Production of wrapping paper from banana fibres. Journal of Environmental Chemical Engineering 5 (5):4298–306. doi:10.1016/j.jece.2017.08.011.
- Rashid, M., A. K. Das, M. Shams, and S. K. Biswas. 2014. Physical and mechanical properties of medium density fiber board (MDF) fabricated from banana plant (Musa sapientum) stem and midrib. Journal of the Indian Academy of Wood Science 11 (1):1–4. doi:10.1007/s13196-014-0109-z.
- Rietveld, A. M., S. Mpiira, W. Jogo, C. Staver, and E. B. Karamura. 2013. The beer banana value chain in central Uganda. Banana systems in the Humid highlands of Sub-Saharan Africa. Enhancing Resilience and Productivity 2015:191–201.
- Sakare, P., A. K. Bharimalla, J. Dhakane-Lad, and P. G. Patil. 2021. Development of greaseproof paper from banana pseudostem fiber for packaging of butter. Journal of Natural Fibers 18 (12):1974–82.
- Samson, S., M. Basri, R. A. Karjiban, E. A. Malek, and E. Abdul Malek. 2016. Design and development of a nanoemulsion system containing copper peptide by D-optimal mixture design and evaluation of its physicochemical properties. RSC Advances 6 (22):17845–56. doi:10.1039/C5RA24379C.
- Senthilkumar, K., I. Siva, N. Rajini, J. W. Jappes, and S. Siengchin. 2018. Mechanical characteristics of tri-layer eco-friendly polymer composites for interior parts of aerospace application. In Sustainable composites for aerospace applications, eds. J. Mohammad and T. Mohamed, 35–53. United Kingdom: Woodhead Publishing.
- Tessema, T. Y., M. M. Shute, M. A. Yalew, T. G. Hishe, and E. E. Shumey. 2019. Briquetting of sesame stalk using waste paper as binding agent to replace petcoke. International Journal of Advanced Science and Engineering 6 (2):1382–89. doi:10.29294/IJASE.6.2.2019.1382-1389.
- Tharazi, I., A. B. Sulong, N. Muhamad, N. F. Tholibon, D. Ismail, Z. Razak, M. K. F. M. Radzi, and Z. Razak. 2017. Optimization of hot press parameters on tensile strength for unidirectional long kenaf fiber reinforced polylactic-acid composite. Procedia Engineering 184:478–85. doi:10.1016/j.proeng.2017.04.150.
- Tibolla, H., F. M. Pelissari, J. T. Martins, A. A. Vicente, and F. C. Menegalli. 2018. Cellulose nanofibers produced from banana peel by chemical and mechanical treatments: Characterization and cytotoxicity assessment. Food Hydrocolloids 75:192–201. doi:10.1016/j.foodhyd.2017.08.027.
- Tumutegyereize, P. 2011. Optimization of biogas production from banana peels: Effect of particle size on methane yield. African Journal of Biotechnology 10 (79):18243–51. doi:10.5897/AJB11.2442.
- Uganda wood asset and forest resources accounts. 2020: Uganda National Bureau of Statistics (UBOS).
- Wen, Q., F. Guo, F. Yang, and Z. Guo. 2017. Green fabrication of coloured superhydrophobic paper from native cotton cellulose. Journal of Colloid and Interface Science 497:284–89. doi:10.1016/j.jcis.2017.03.036.
- Yiga, V. A., M. Lubwama, and P. W. Olupot. 2021a. Application of response surface methodology for optimizing tensile strength of rice husk fiber-reinforced polylactic acid composites. Process Pap 3:1–8.
- Yiga, V. A., M. Lubwama, and P. W. Olupot. 2021b. Effect of alkaline surface modification and carbonization on biochemical properties of rice and coffee husks for use in briquettes and fiber-reinforced plastics. Journal of Natural Fibers 18 (4):620–29. doi:10.1080/15440478.2019.1642824.
- Yiga, V. A., M. Lubwama, S. Pagel, P. W. Olupot, J. Benz, and C. Bonten. 2021a. Optimization of tensile strength of PLA/clay/rice husk composites using Box-Behnken design. Biomass Conversion and Biorefinery 1–27. doi:10.1007/s13399-021-01971-3.
- Yiga, V. A., M. Lubwama, S. Pagel, P. W. Olupot, J. Benz, and C. Bonten. 2021b. Optimization of tensile strength of PLA/clay/rice husk composites using Box-Behnken design. Biomass Conversion and Biorefinery 1–27. doi:10.1007/s13399-021-01971-3.
- Zhao, L., Q. Li, X. Xu, W. Kong, X. Li, Y. Su, Q. Yue, and B. Gao. 2016. A novel enteromorpha based hydrogel optimized with Box–Behnken response surface method: Synthesis, characterization and swelling behaviors. Chemical Engineering Journal 287:537–44. doi:10.1016/j.cej.2015.11.085.