
 ?Mathematical formulae have been encoded as MathML and are displayed in this HTML version using MathJax in order to improve their display. Uncheck the box to turn MathJax off. This feature requires Javascript. Click on a formula to zoom.
ABSTRACT
Cannabis sativa L. is an extremely variable species. Even within the same cultivar plants can significantly differ in the content and profile of cannabinoids. Therefore, the best method for production of uniform plants and standardized raw material is vegetative propagation using clones. The aim of this study was to determine the content of cannabidiolic acid (CBDA), cannabidiol (CBD), Δ9-tetrahydrocannabinolic acid (Δ9-THCA), Δ9-tetrahydrocannabinol (Δ9-THC), cannabichromene (CBC), cannabigerol (CBG), and cannabinol (CBN) in clonally propagated plants of industrial hemp. One hundred and thirty-nine plants representing 17 different hemp genotypes were regenerated in vitro, hardened, and grown in a vegetation hall until harvest. Single plants of each accession were analyzed using high-performance liquid chromatography with UV/diode-array detection (HPLC-DAD/UV). The results revealed significant variability in the total cannabinoid content (0.55–5.18% in dry weight) among tested genotypes and within the Epsilon 68 cultivar. The highest content of total CBD (4.410%) was recorded for EPS/40 genotype, while the level of total Δ9-THC was below the allowed threshold (0.3%). Therefore, we can conclude that some clonally propagated plants provided reproducible hemp material as a potential source of cannabidiol. The results of this study will be useful for breeding and early selection of hemp genotypes.
摘要
大麻是一个极易变异的物种. 即使在同一栽培品种中,大麻素的含量和分布也可能存在显著差异. 因此,生产统一植物和标准化原料的最佳方法是使用无性繁殖. 本研究旨在测定工业大麻克隆繁殖植物中大麻二酚酸(CBDA)、大麻二酚(CBD)、Δ9-四氢大麻酚酸(Δ9-THCA)、Δ9-THC、大麻色素烯(CBC)、大麻酚(CBG)和大麻酚(CBN)的含量. 代表17种不同大麻基因型的139株植物在体外再生、硬化并在植被大厅中生长,直到收获. 使用具有UV/二极管阵列检测的高效液相色谱法(HPLC-DAD/UV)分析每个登录的单株. 结果显示,在受试基因型之间和受试基因组内,大麻素总含量(干重为0.55–5.18%)存在显著差异. 结果显示,在测试的基因型和Epsilon 68品种中,大麻素总含量存在显著差异(干重为0.55–5.18%). EPS/40基因型的总CBD含量最高(4.410%),而总Δ9-THC水平低于允许的阈值(0.3%). 因此,我们可以得出结论,一些克隆繁殖的植物提供了一种可再生的大麻材料,作为大麻二酚的潜在来源。研究结果对大麻基因型的选育和早期选择具有一定的指导意义.
Introduction
Hemp (Cannabis sativa L.) is a well-known multifunctional crop, with great medical and economic importance. The global legal cannabis market was estimated to be worth USD 10.81 billion in 2022 and is expected to reach USD 70.56 billion by 2031 (Global Medical Cannabis Market Report and Forecast Citation2023–2023–2031). In Europe, medical cannabis constitutes the majority of the legal cannabis market, and it is expected to grow to USD 140.5 million by 2025 (Consumer Goods & FMCG Citation2023). The main reason for the rapid growth of this market is the demand for legal cannabis products containing highly bioactive compounds – cannabinoids.
Cannabis sativa L. plants synthesize about 600 compounds including cannabinoids, flavonoids, terpenoids, terpenes, alkaloids, and polyphenols. So far, more than 150 cannabinoids have been identified in hemp (Hanuš et al. Citation2016). The term phytocannabinoids is often used to discriminate the plant-produced cannabinoids from the endocannabinoids which are a natural part of the endocannabinoid system in mammals. Phytocannabinoids interact with the endocannabinoid receptors (CB1, CB2, and GPR55) and some other receptors, e.g.: transient potential vanilloid receptor (TRPV) or serotonin receptor (5-TH2A, 5-TH3A) (Stasiłowicz et al. Citation2021). Cannabinoids have found medical application in epilepsy, sclerosis multiplex (SM), and in alleviating side effects of chemotherapy such as vomiting and nausea, pain, and appetite loss (Stasiłowicz et al. Citation2021). They have also shown documented pharmacological potential in inflammatory bowel diseases (IBDs), Parkinson’s disease, Tourette’s syndrome, schizophrenia, glaucoma, and coronavirus disease (Raj et al. Citation2021). Beneficial properties of C. sativa are mainly attributed to two active compounds: the hallucinogenic ∆9-tetrahydrocannabinol (Δ9-THC) and the non-psychoactive cannabidiol (CBD). Apart from these two predominant phytocannabinoids, cannabigerol (CBG), cannabichromene (CBC), cannabinol (CBN), and cannabivarin (CBCV) are also often reported. In most European countries hemp cultivation is restricted by law due to the anti-drug policy, and the limit of 0.2% of Δ9-THC content was implemented in the European Union (EU Regulation 1307/Citation2013). However, a new limit of 0.3% Δ9-THC content came into force on 1 January 2023 according to the new Common Agricultural Policy (CAP). For practical and legal reasons prohibiting the cultivation of high ∆9-THC hemp, the cultivars were classified as three main chemotypes: drug-type with higher (>0.3%) levels of ∆9-THC and CBD content lower than 0.5%, an intermediate type (chemotype II) with similar levels of each and fiber-type (chemotype III) with higher CBD content (>0.5%), and THC content lower than 0.3% (Grassi and McPartland Citation2017). Other chemotypes IV and V are also classified: chemotype IV has a low ∆9-THC level but a relatively high content of CBG (cannabigerol) and chemotype V – synthesize trace amounts of cannabinoids (Mandolino and Carboni Citation2004; Meijer and Hammond Citation2005). Whereas the ratio of ∆9-THC/CBD is constant during the plant’s life (Meijer et al. Citation2003; Pacifico et al. Citation2008), the content of phytocannabinoids may be very variable. Presence of ∆9-THC and CBD is genetically determined by genes coding the enzymes tetrahydrocannabinolic acid synthase (THCAS) and cannabidiolic acid synthase (CBDAS). THCAS and CBDAS are responsible for the production of tetrahydrocannabinolic acid (Δ9-THCA) and cannabidiolic acid (CBDA), the native forms of Δ9-THC and CBD, respectively. The presence of THCAS and CBDAS (defined as BT and BD allele, respectively) differs among cultivars and among individuals within the same cultivar (Borroto Fernandez et al. Citation2020; Pacifico et al. Citation2006). Depending on hemp cultivar, from 0.97% up to 35% of individuals carrying the BT allele (homozygotic or heterozygotic) were determined in fiber hemp (Borroto Fernandez et al. Citation2020). However, the presence of the BT allele is not obligatory for Δ9-THC production, because it is assumed that both synthases THCAS and CBDAS are potent to produce residual CBDA and Δ9-THCA (Melzer, McCabe, and Schilling Citation2022). Additionally, pseudogenes and gene copy number of THCAS and CBDAS also contribute to phytochemical diversity in hemp (Vergara et al. Citation2019; Weiblen et al. Citation2015).
Beyond genetics, the content of cannabinoids is affected by sex (Nagy et al. Citation2019), ontogeny (Ingallina et al. Citation2020) and variety of environmental factors (Campbell et al. Citation2019). Among them light intensity and spectrum (Danziger and Bernstein Citation2021a; Magagnini, Grassi, and Kotiranta Citation2018), temperature (Galic et al. Citation2022), drought (Caplan, Dixon, and Zheng Citation2019; Sheldon et al. Citation2021), nutrients (Bernstein et al. Citation2019; Saloner and Bernstein Citation2021, Citation2022a, Citation2022b; Shiponi and Bernstein Citation2021), heavy metal (Husain et al. Citation2019) and plant growth-promoting rhizobacteria (Pagnani et al. Citation2018) have been reported. Exposure to heavy metals significantly increased total CBD and THC content in hemp plants (Husain et al. Citation2019). Drought (Caplan, Dixon, and Zheng Citation2019), low phosphorus supplementation (Shiponi and Bernstein Citation2021), UV radiation (Giupponi et al. Citation2020; Jenkins Citation2021), and blue light (~450–520 nm) combined with a short photoperiod (Magagnini, Grassi, and Kotiranta Citation2018) may increase cannabinoid concentration. On the other hand, high level of phosphorus (30 mg L−1) and nitrogen (100 ppm NH4) (Saloner and Bernstein Citation2021, Citation2022b) had an adverse impact on THCA and CBDA accumulation. The importance of plant density and architecture for chemical quality and standardization in drug-type medical cannabis was revealed by Danziger and Bernstein (Citation2021a, Citation2021b, Citation2022). They demonstrated that increased density of planting reduced concentration of cannabinoids, however cannabinoid yield per cultivation area was not affected. The response to plant density and architecture modulation was cannabinoid-specific. Under high-density growth, cultivation practice such as defoliation or removal of branches increased light penetration to the bottom of the plants and improved chemical standardization. It should be noted that different cultivars may respond differentially to the same environmental factors (Campbell et al. Citation2019; Danziger and Bernstein Citation2021a; Herppich et al. Citation2020; Poniatowska et al. Citation2022).
Generally, industrial hemp accumulates lower amounts of cannabinoids compared to drug-type cultivars, with predominance of CBD over other cannabinoids. Low Δ9-THC cultivars are also in demand on the market, because not all patients and consumers accept the psychotic effect associated with medical marijuana treatment. Long-term use of high Δ9-THC hemp can be addictive and lead to cognitive impairment, especially in young people. Therefore, industrial hemp is also considered as a source of valuable cannabinoids, particularly CBD (Glivar et al. Citation2020; Pexová Kalinová et al. Citation2021). However, phenotypic and genetic variations within industrial hemp are high, and even within the same cultivar individuals might display different chemotypes (Hillig and Mahlberg Citation2004; Pacifico et al. Citation2006; Welling et al. Citation2016). On the other hand, the raw material for pharmaceutical production has to meet strict requirements: batch-to-batch consistency and standardized content of cannabinoids (Chandra et al. Citation2017). Therefore, the best way to achieve production of uniform plants and standardized raw material is vegetative propagation using clones (Fischedick et al. Citation2010). Vegetative propagation can be achieved using cuttings, as is practiced in drug-type cultivars, or by in vitro cultures (Chandra et al. Citation2017). In vitro cultures can offer rapid multiplication, large-scale production, controlled conditions of cultivation, and a lack of environmental restrictions (e.g., exposure to pathogens and pests), but above all they provide true-to-type plants. Hence, they can be useful in reproduction of valuable genotypes for production of standardized raw material or for breeding purposes, providing the parent material for crossbreeding.
In our study, clonally propagated plants of industrial hemp derived from individual seedlings were regenerated in vitro, hardened, and cultivated in the vegetation hall under semi-controlled conditions. Cloned plants from each of the 17 accessions were used as material for the phytochemical study on phenotypic variation. This preliminary study is a part of a program aimed at evaluation and selection of hemp genotypes with higher CBD content for further breeding programs. The main purpose of this study was to obtain clonally propagated plants of industrial hemp genotypes and to determine the content of CBDA, CBD, Δ9-THCA, Δ9-THC, CBC, CBG, and CBN using the HPLC-DAD/UV method.
Material and methods
Plant material
Hemp seed cultivars (Epsilon 68, Henola), accession K290, and hybrids – Carmagnola × K 290 (marked 1565) and Beniko × Carmagnola (marked 1491) – were obtained from the Fibrous Plants Gene Bank of the Institute of Natural Fibres and Medicinal Plants (INF&MP-NRI, Poznań, Poland). Seeds of the Henola variety were provided by Prof Henryk Burczyk from the seed plantation (Experimental Station, INF&MP, Pętkowo). Basic characteristics of hemp cultivars and the hybrid components are presented in .
Table 1. Breeding information on tested hemp accessions and the parent components of hybrids (Carmagnola × K 290 (1565) and Beniko × Carmagnola (1491)).
In vitro propagation
Seeds were sterilized in 70% (v/v) ethanol for 1 min followed by rinsing in commercial bleach-ACE solution (3:1) for 20 min. After sterilization seeds were washed three times in sterile, deionized water, placed in a half-strength MS medium (Murashige and Skoog Citation1962), and cultivated at 25°C in darkness for 3 days, then for 7 days in light. In vitro cultures were established from sterile and individually marked seedlings. From each single seedling the genotype was derived and cloned using shoot tip explants. Shoot tips were removed from the regenerated plants at the age of 14–21 days and cultured for the next 2 weeks to stimulate the growth of lateral shoots, as described by Wróbel et al. (Citation2022).
Acclimatization conditions
The regenerated plants with well-developed roots were removed from the vessels and washed in autoclaved water, then placed in pots with sterilized soil (standard garden soil without additives) under glass covers and grown at 25 ± 1°C (18/6 photoperiod, 80–100 μmol m2 s−1). After 1 week, the glass covers were replaced with plastic covers and plants were progressively exposed to the environmental humidity. Plantlets were irrigated twice a week. Plants were hardened for 3–4 weeks and then transferred to the pots in the vegetation hall.
Pot experiment in the vegetation hall
The pot experiment was carried out in 2021, from May 25 until September 13, inside the vegetation hall in the Experimental Station in Pętkowo (Wielkopolskie, Poland N: 52°12ʹ09ʹʹ; E: 17°15ʹ21ʹʹ). The vegetation hall was not heated or lighted, except solar source. The temperature was maintained in the range of 15–25°C, and humidity 40–60% during the entire period of the experiment. The pots were randomly arranged in the vegetation hall.
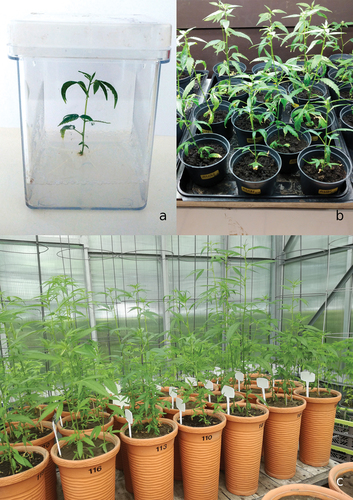
The pots of capacity of 160 dm3 (50 cm high and 30 cm in diameter) were filled with 21 kg of the soil. Soil analysis demonstrated a mechanical composition of sandy clay, slightly acidic (pH = 5.9) with a high (8.6 mg·100 g−1 of soil) magnesium content, moderate phosphorus, and potassium content (13.5 and 18.2 mg·100 g−1 of soil, respectively); boron (1.15 mg·100 g−1 of soil), manganese (54.7 mg·100 g−1 of soil), copper (2.9 mg·100 g−1 of soil), zinc (6.7 mg·100 g−1 of soil); and low iron content (423 mg·100 g−1 of soil), and a 1.64% content of humus. Plants were not fertilized. Hardened plants derived from in vitro cultures were transplanted into pots (3–4 per pot). Each genotype was represented by 5–10 regenerated (cloned) plants. Plants were irrigated (200 ml per plant) twice a day during the intensive growth phase, and once per day during the flowering phase. The percentage of acclimatized plants was calculated 1 month after transplant and before harvest. In vitro regenerated plants, acclimatized plantlets and growing plants in the vegetation are presented in (a-c).
Figure 1. a) in vitro regenerated plant (EPS/40), b) acclimatization of plantlets, c) plants growing in the vegetation hall.
Plant material collection and HPLC-DAD/UV analysis
Sampling of the female/monoecious plants was carried out at the beginning of the seed maturation stage. Inflorescences were cut (±30 cm) and packed in paper bags. Henola genotypes were harvested on July 30th (66 days after planting), the other genotypes on September 13th, 2021 (111 days after planting). Each sample contained material collected from a single plant. Harvested plant material was dried at 40°C ± 0.1°C in a laboratory dryer. Content of cannabinoids (CBDA, CBD, Δ9-THCA, Δ9-THC, CBC, CBG, and CBN) was analyzed by a certified laboratory (Cannalabs by EkotechLAB, Poland) using the HPLC-DAD/UV method. Dried plant material was sieved using a 0.5 mm mesh sieve and grounded. Samples were extracted by adding 10 mL of ethanol (96%) to 100 mg of the accurately weighed ground material. Then, the samples were incubated for 30 min in an ultrasonic bath at 50°C. The supernatant was removed and filtered through a syringe filter (0.2 μm) into the vials. Analyses were performed using a Thermo Dionex Ultimate 3000 chromatograph with diode array detector (DAD RS 300). Separation was carried out on a Dr Maisch ReproSil XR 120 (3.5 µm × 50 mm × 3 µm) column. The mobile phase A was water + 0.1% formic acid (v/v), while the mobile phase B was methanol + 0.05% formic acid (v/v). The elution procedure was as follows: 1–6.8 min, 60% B→73% B; 6.8–9.3 min, 73% B→95% B; 9.3–9.4 min, 95% B→60% B; 9.4–10 min, 60% B. The volume of the samples was 1 μL, flowrate 1 mL/min, with detection at 228 nm, and the column temperature was 40°C. The amount of each cannabinoid (%w/w) in the original sample was calculated using calibration curves of standard compounds. All cannabinoid standards were purchased in LGC (Dr Ehrenstorfer®, Augsburg, Germany). The limit of quantification for all cannabinoids was 0.01%, and the limit of detection was 0.003%. The total concentration of Δ9-THC and CBD in %w/w [%mg of cannabinoid/100 mg herbal drug] was calculated as follows:
The conversion factor 0.877 represents a loss of molecular mass during the decarboxylation reaction.
Statistical analysis
Statistical analysis was performed using Statistica 12.0 (StatSoft Inc.). Phytochemical measurements were repeated at least three times for each tested sample and compound. These data were analyzed using ANOVA, and the statistical significance was determined by applying Tukey’s test and Fisher’s test with a p value of 0.05.
Results and discussions
Clonal propagation and obtaining the raw material for analysis
Clonal propagation ensures a constant cannabinoid profile and a high uniformity of the raw material, which allows adherence to strict pharmaceutical standards (Chandra et al. Citation2017; Fischedick et al. Citation2010). Although different in vitro protocols have been reported (Monthony et al. Citation2021), the low regeneration rate, poor replicability, and genotype-dependent response of the explants are the main limitations for in vitro propagation. In this study, we used a slightly modified regeneration protocol, developed previously in our laboratory (Wróbel et al. Citation2022). This protocol involves direct regeneration from shoot tips taken from lateral shoots without the use of cytokinins. Applying this regeneration protocol, 150 plants representing 17 different genotypes were regenerated in vitro ().
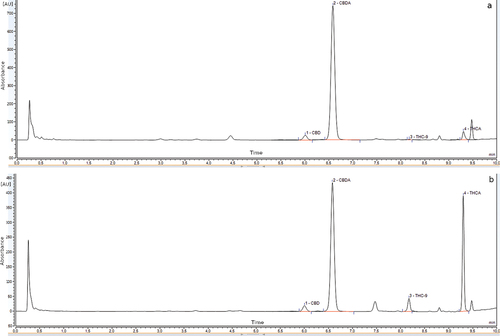
Epsilon 68 genotypes included line EPS/40 obtained previously as well as the new genotypes of this cultivar. The multiplication rate varied depending on the tested genotype and ranged from 1.8 to 4.5 shoot tips per donor plant calculated in a two-week cycle. These results are consistent with previously obtained values, with the multiplication rate 3.0 (Wróbel et al. Citation2022). Plantlets after transplanting in the vegetation hall grew vigorously and 93% of them successfully survived to harvest (). Samples (139) collected from individual plants were then analyzed using the HPLC-DAD/UV method. Chromatograms of Δ9-THCA and CBDA are presented in .
Figure 2. a) HPLC profile of EPS/40 genotype at λ = 228 nm, b) HPLC profile of K290/136 genotype at λ = 228 nm. 1—CBD, 2—CBDA (pink colored), 3—Δ9-THC, 4—Δ9-THCA.
Differences in the content of CBDA, CBD, ∆9-THCA, ∆9-THC, CBG, and CBC are summarized in . The sum of cannabinoid content (THCA, THC, CBD, CBDA, CBC and CBG) is presented in .
Figure 3. Sum (%) of total cannabinoids (CBDA, CBD, Δ9-THCA, Δ9-THC, CBC and CBG) in tested genotypes. Mean values in column with the same letter are not significantly different at p = .05 (tukey’s multiple range test). Genotypes: HN—Henola; 1491—Beniko xCarmagnola, 1565—Carmagnola x K 290; EPS—Epsilon 68.
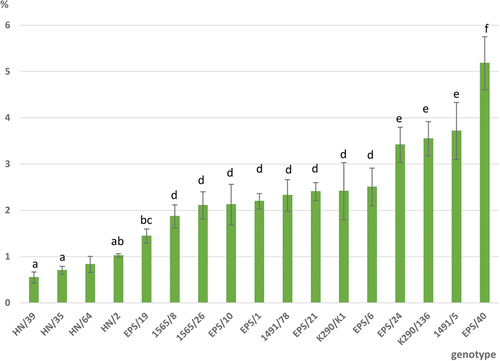
Table 2. Content of CBDA, CBD, ∆9-THCA, ∆9-THC, CBC, CBG, and CBN in tested genotypes.
Total content of CBD, ∆9-THC and ratio of total ∆9-THC/total CBD, as well as total CBD/total ∆9-THC, are presented in . Coefficient of variation calculated for CBDA and THCA is presented in .
Table 3. Content of total CBD and total THC, ratio of CBD/THC and ratio of THC/CBD.
Table 4. Coefficient of variation calculated for THCA and CBDA.
Content of CBDA, CBD, ∆9-THCA, ∆9-THC, CBG, and CBC
Differences in content of CBDA, CBD, ∆9-THCA, ∆9-THC, CBG, and CBC between tested genotypes were significant (). CBDA was the dominant cannabinoid, at the level 0.48–4.72%, whereas the content of other cannabinoids was significantly lower: 0.05–0.35% of CBD, 0.01–0.82% of Δ9-THCA, 0.01–0.3% of Δ9-THC, 0.01–0.5% of CBG, and 0.01–0.07% of CBC. Significant variation in CBDA content among tested genotypes was found. The majority of genotypes (10) contained a medium level of this compound at the level 1–3%. Three genotypes (EPS/40, EPS/24 and 1491/5) reached the highest level of CBDA (>3%); among them EPS/40 was characterized by a significantly high content (4.723%±0.542) of this compound. Similar or even higher level of CBDA (6.282%) for this French cultivar was reported by Vásquez-Ocmín et al. (Citation2021). Δ9-THCA content also varied significantly among tested genotypes. Most of the tested genotypes contained low (0.02–0.10%) Δ9-THCA level. All Henola genotypes reached the lowest content of Δ9-THCA, i.e., ≤0.02%. In this respect, K290/136 genotype was characterized by the highest content (0.8%) of this cannabinoid. Unfortunately, there are no data available on the variability within this accession. Carboxylic acidic forms of cannabinoids (CBDA and THCA) are predominant and native for hemp, but they are nonenzymatically degraded into the neutral form which occurs naturally in plants or during heating or drying (Taura et al. Citation2007). In this study, the percentage of CBD in the sum of CBDA and CBD ranged from 5.4% to 22.4%, whereas Δ9-THC represented 15.5% to 50% of total Δ9-THC, respectively. The percentage of neutral forms is mainly dependent on the temperature of storage and drying. These values are comparable with the results obtained by Glivar et al. (Citation2020) or Eržen et al. (Citation2021). CBC was detected at a low level of 0.01%–0.04% in the majority of the tested samples, but EPS/40 genotype was characterized by the highest content of this cannabinoid (0.069%±0.011) and the result achieved statistical significance.
CBG was determined in a trace amount (≤0.01%) in most of the samples, but seven genotypes (1491/5, 1491/78, 1565/8, 1565/26, K290/K1, K290/136, and EPS/6) accumulated CBG at the level 0.02%–0.05%. Genotype 1565/8 was characterized by a relatively high content (0.05%±0.008) of this cannabinoid. CBN was not detectable at a level below 0.01%. This might imply that degradation of ∆9-THCA during drying or storage resulted in a trace amount of CBN – the side product of this process (Fischedick et al. Citation2010).
Total CBD and total ∆9-THC content and ratios of CBD/∆9-THC and ∆9-THC/CBD
Heterogeneity in total content of CBD and ∆9-THC was also observed in this study. A higher content of total CBD (>3%) was recorded for two genotypes – EPS/40 and 1491/5, but the highest level of this cannabinoid (4.410%±0.491) was determined for EPS/40 genotype (). Comparable or even higher content of CBD (4–9.6%) was found by Glivar et al. (Citation2020) in bracts or different parts of inflorescences of Antal, Carmagnola, Helena, and Tiborszallasi cultivars. Our results are consistent with previously determined content of total CBD (3.9%–5.4%) in Epsilon 68 genotypes (Wróbel et al. Citation2022). In this study, we found significant variability within the Epsilon 68 cultivar and confirmed that the EPS/40 line accumulates relatively constant content of CBD under semi-controlled conditions (4.410%±0.491) as grown in the field (5.0134%±0.1182) (Wróbel et al. Citation2022). Notably, the Δ9-THC value did not exceed the allowed threshold (0.3%) in this study and previously. This is a good prognostic sign for this accession, and it should be considered as one of the criteria for selection in the breeding process.
The total Δ9-THC concentration is important information for growers and breeders due to the different national legal regulations. A new limit of 0.3% was set by Polish law in 2022 (Dz Citation2022 poz. 764). It should be stressed that Δ9-THC values observed for most single plants were below the allowed threshold and ranged from 0.02% to 0.08%. In this study, one accession K290/136 genotype (1.021%±0.132) exceeded the allowed THC limit. This may be due to the naturally occurring inter-individual variability within this local Ukrainian landrace. Unfortunately, there are not any data on variability in the K290 accession. An increased level of THC in single plants has been recorded previously in some industrial cultivars: Carmagonola (Pacifico et al. Citation2006), Felina 34 and Białobrzeskie (Mechtler, Bailer, and de Hueber Citation2004) and K-573 accession (Mańkowska et al. Citation2015). It is not excluded that during in vitro process an individual (seedling) representing a different chemotype was found. Over 200 seedlings of the K290 accession were obtained, and only a few of them were randomly selected for further micropropagation, among them seedling number 136 (K290/136). However, more studies are needed in the subsequent seasons for a definite conclusion.
Uniformity of cannabinoid content is important information about the tested accessions and can be evaluated with standard deviation (SD); however more relevant is coefficient of variation (CV). In this regard, a very high uniformity in Δ9-THCA and CBDA content was found for EPS/1 and EPS/40 genotypes (). CV calculated for EPS/1 genotype were 7.7% and 5.8% and 9.7% and 11.5% for EPS/40, respectively. On the opposite side, significantly higher CV values (38.7% and 28.2% respectively) were noted for K290/K1 or 1565/26 lines. Potential causes of the variability within genotype could be uneven access of plants to light in the vegetation hall. Light quality and intensity play a key role. The significant increase in the amount of cannabinoids extracted from inflorescences from bottom to top of the stem was demonstrated by Namdar et al. (Citation2018). Effect of micro-climates in plant shoots due to an increase in inter-shoot shading was found recently (Danziger and Bernstein Citation2021a, Citation2022). Shadow or weak light penetration in inflorescences was correlated with lower cannabinoid concentration. On the other hand, defoliation increased cannabinoid concentrations locally due to better light penetration. Spatial gradients of light intensity in plant canopies intensify with plant height. In this study, differences in plant height resulted from differences between cultivars, e.g., Henola and Epsilon 68 () and individual plants. Another source of variability may have been temperature fluctuations (15–25°C) under the semi-controlled conditions. Considering that the cloned plants represented different individuals derived from different cultivars and accesions, a varied response to light and temperature was possible. Different responses of the cultivars to the same environmental factors were documented (Herppich et al. Citation2020; Poniatowska et al. Citation2022). Therefore, further research on the effects of different light and temperature is worth considering.
The ratio of total Δ9-THC/total CBD as well as the ratio of total CBD/total Δ9-THC is used for chemotype evaluation. Δ9-THC/CBD values lower than 1.0 were attributed to the fiber-type cultivars. In this study, all tested genotypes fulfilled this criterion (). However, according to the classification based on CBD/Δ9-THC ratio, two different chemotypes are represented: III – typical for fiber type and II – intermediate. Chemotype III is represented by almost all genotypes, with a characteristic low Δ9-THC content (<0.3%) and prevalent CBD content >0.5%. Intermediate chemotype II is represented by K290/136 genotype with CBD/Δ9-THC ratio 2.06 and total content of Δ9-THC above 1%. Single plants expressing different chemotypes (II and III) were identified within cultivars Carmagnola and Fibranova (Pacifico et al. Citation2006), Felina 34, Białobrzeskie, and Beniko (Mechtler, Bailer, and de Hueber Citation2004). A study on the distribution of chemotypes in industrial hemp confirmed the presence of at least some individuals with Δ9-THC-predominant or intermediate phenotype within 23 cultivars (Borroto Fernandez et al. Citation2020). Genetic analysis determined the frequency of BT allele-carrying individuals from 0.97% to 35% depending on cultivar. It means that if the size of the tested sample is sufficiently large (100 or more individuals), one is very likely to find individuals (genotypes) with an active BT allele (BD/BT or BT/BT genotype) expressing different chemotypes. Therefore, random selection of seeds (individuals) during the in vitro process might lead to clonal propagation of individuals expressing different chemotypes in this study.
The average CBD/Δ9-THC ratio is about 33:1, which is consistent with the results obtained by Glivar et al. (Citation2020). However, this ratio for two genotypes (EPS/40 and HN/35) was more than 40:1. Toth et al. (Citation2020) suggested that it might be difficult to develop a cultivar that accumulates more than 6% of CBD content while maintaining the allowed low Δ9-THC level based on the CBD/Δ9-THC ratio 20:1. Our results are consistent with this claim, but further studies and experiments are needed to verify this assumption.
Conclusions
In this study, in vitro cultures were used for clonal propagation of industrial hemp. One hundred and thirty-nine plants representing 17 different hemp genotypes were regenerated in vitro, hardened, and grown until harvest in the vegetation hall. The results of HPLC-DAD/UV analysis revealed large variability in the total content of cannabinoids (0.55–5.18%) among tested genotypes as well as within the Epsilon 68 cultivar. The highest content of total CBD (4.410%±0.491) was recorded for EPS/40 genotype, while the maintained level of THC was below the legally allowed threshold (0.3%). Some accessions (EPS/1 and EPS/40) expressed constant cannabinoid profile and high uniformity. Therefore, we can conclude that some clonally propagated plants provided reproducible hemp material as a potential source of cannabidiol. Additionally, we confirmed that EPS/40 genotype accumulates higher (>4%) content of CBD under semi-controlled conditions as grown in the field and therefore is a good candidate for selection and material for breeding practice.
Highlights
Seventeen different hemp genotypes were regenerated in vitro, hardened, and grown in a vegetation hall.
Single plants were analyzed using high-performance liquid chromatography with UV/diode-array detection (HPLC-DAD/UV).
Significant variability in the total cannabinoid content (0.55–5.18% in dry weight) among tested genotypes was found
The highest content of total CBD (4.410%) was recorded for EPS/40 genotype
Clonally propagated plants can provide Cannabis material as a potential source of cannabidiol.
Ethical approval
We confirm that all the research meets ethical guidelines and adheres to the legal requirements of the study country. The research does not involve any human or animal welfare-related issues.
Acknowledgements
The authors would like to express their gratitude to Professor Henryk Burczyk for providing seeds of the Henola cultivar and to Dr Karolina Wielgus for her assistance and support.
Disclosure statement
No potential conflict of interest was reported by the author(s).
Additional information
Funding
References
- Bernstein, N., J. Gorelick, R. Zerahia, and S. Koch. 2019. Impact of N, P, K, and humic acid supplementation on the chemical profile of medical cannabis (Cannabis sativa L). Frontiers in Plant Science 10:736. doi:10.3389/fpls.2019.00736.
- Borroto Fernandez, E., V. Peterseil, G. Hackl, S. Menges, E. de Meijer, and C. Staginnus. 2020. Distribution of chemical phenotypes (chemotypes) in European agricultural hemp (Cannabis sativa L.) cultivars. Journal of Forensic Sciences 65 (3):715–14. doi:10.1111/1556-4029.14242.
- Campbell, B. J., A. F. Berrada, C. Hudalla, S. Amaducci, and J. K. McKay. 2019. Genotype × environment interactions of industrial hemp cultivars highlight diverse responses to environmental factors. Agrosystems, Geosciences & Environment 2 (1):1–11. doi:10.2134/age2018.11.0057.
- Caplan, D., M. Dixon, and Y. Zheng. 2019. Increasing inflorescence dry weight and cannabinoid content in medical cannabis using controlled drought stress. HortScience 54 (5):964–69. doi:10.21273/HORTSCI13510-18.
- Chandra, S., H. Lata, M. A. ElSohly, L., A. Walker, and D. Potter. 2017. Cannabis cultivation: Methodological issues for obtaining medical-grade product. Epilepsy & Behavior 70:302–12. doi:10.1016/j.yebeh.2016.11.029.
- Consumer Goods & FMCG. 2023. Legal cannabis sales in Europe from 2020 to 2025. Accessed May 12, 2023. https://www.statista.com/statistics/1293126/europe-legal-cannabis-market-size/
- Danziger, N., and N. Bernstein. 2021a. Light matters: Effect of light spectra on cannabinoid profile and plant development of medical cannabis (Cannabis sativa L.). Industrial Crops and Products 164:113351. doi:10.1016/j.indcrop.2021.113351.
- Danziger, N., and N. Bernstein. 2021b. Shape matters: Plant architecture affects chemical uniformity in large-size medical Cannabis plants. Plants 10 (9):1834. doi:10.3390/plants10091834.
- Danziger, N., and N. Bernstein. 2022. Too dense or not too dense: Higher planting density reduces cannabinoid uniformity but increases yield/area in drug-type medical cannabis. Frontiers in Plant Sciences 13:713481. doi:10.3389/fpls.2022.713481.
- Dz, U. 2022. poz.764. Ustawa z dnia 24 marca 2022 r. o zmianie ustawy o przeciwdziałaniu narkomanii oraz niektórych ustaw. Parliament, Warsaw, Poland]: Law on counteracting drug addiction. Dz.U. 2022 poz.764. https://isap.sejm.gov.pl/isap.nsf/download.xsp/WDU20220000764/O/D20220764.pdf.
- Eržen, M., I. J. Košir, M. Ocvirk, S. Kreft, and A. Čerenak. 2021. Metabolomic analysis of cannabinoid and essential oil profiles in different hemp (Cannabis sativa L.) phenotypes. Plants 10 (5):966. doi:10.3390/plants10050966.
- EU Regulation no 1307/2013 of the European Parliament and of the Council of 17 December 2013 establishing rules for direct payments to farmers under support schemes within the framework of the common agricultural policy and repealing Council regulation (EC) No 637/2008 and council regulation (EC) No 73/2009. 2013. Brussels, Belgium: European Parliament.
- Fischedick, J. T., A. Hazekamp, T. Erkelens, Y. H. Choi, and R. Verpoorte. 2010. Metabolic fingerprinting of Cannabis sativa L., cannabinoids and terpenoids for chemotaxonomic and drug standardization purposes. Phytochemistry 71 (17–18):2058–73. doi:10.1016/j.phytochem.2010.10.001.
- Galic, A., H. Grab, N. Kaczmar, K. Maser, W. B. Miller, and L. B. Smart. 2022. Effects of cold temperature and acclimation on cold tolerance and cannabinoid profiles of Cannabis sativa L. (hemp). Horticulturae 8 (6):531. doi:10.3390/horticulturae8060531.
- Giupponi, L., V. Leoni, R. Pavlovic, and A. Giorgi. 2020. Influence of altitude on phytochemical composition of hemp inflorescence: A metabolomic approach. Molecules 25 (6):1381. doi:10.3390/molecules25061381.
- Glivar, T., J. Eržen, S. Kreft, M. Zagožen, A. Čerenak, B. Čeh, and E. Tavčar Benković. 2020. Cannabinoid content in industrial hemp (Cannabis sativa L.) varieties grown in Slovenia. Industrial Crops and Products 145:112082. doi:10.1016/j.indcrop.2019.112082.
- Global Medical Cannabis Market Report and Forecast 2023-2031. Expert market research. Accessed June 12, 2023. https://www.researchandmarkets.com/report/cannabis#product–description
- Grassi, G., and J. M. McPartland. 2017. Chemical and morphological phenotypes in breeding of Cannabis sativa L. In Cannabis sativa L. - Botany and biotechnology, ed. S. Chandra, H. Lata, and M. ElSohly, 137–60. Cham: Springer International Publishing. doi:10.1007/978-3-319-54564-6_6.
- Hanuš, L. O., S. M. Meyer, E. Muñoz, O. Taglialatela-Scafatid, and G. Appendino. 2016. Phytocannabinoids: A unified critical inventory. Natural Product Report 33 (12):1357–92. doi:10.1039/c6np00074f.
- Herppich, W. B., H. J. Gusovius, I. Flemming, and K. Drastig. 2020. Effects of drought and heat on photosynthetic performance, water use and yield of two selected fiber hemp cultivars at a poor-soil site in Brandenburg (Germany). Agronomy 10 (9):1361. doi:10.3390/agronomy10091361.
- Hillig, K. W., and P. G. Mahlberg. 2004. A chemotaxonomic analysis of cannabinoid variation in Cannabis (Cannabaceae). American Journal of Botany 91 (6):966–75. doi:10.3732/ajb.91.6.966.
- Husain, R., H. Weeden, D. Bogush, M. Deguchi, M. Soliman, S. Potlakayala, R. Katam, S. Goldman, S. Rudrabhatl, and P. Thavamani. 2019. Enhanced tolerance of industrial hemp (Cannabis sativa L.) plants on abandoned mine land soil leads to overexpression of cannabinoids. PloS One 14 (8):e0221570. doi:10.1371/journal.pone.0221570.
- Ingallina, C., A. P. Sobolev, S. Circi, M. Spano, C. Fraschetti, A. Filippi, A. di Sotto, S. di Giacomo, G. Mazzoccanti, F. Gasparrini, et al. 2020. Cannabis sativa L. Inflorescences from monoecious cultivars grown in Central Italy: An untargeted chemical characterization from early flowering to ripening. Molecules 25 (8):1908. Cannabis sativa L. doi:10.3390/molecules25081908.
- Jenkins, M. W. 2021. Cannabis sativa L. Response to narrow bandwidth UV and the combination of Blue and Red light during the final stages of flowering on leaf level gas-exchange parameters, secondary metabolite production, and yield. Agricultural Sciences 12 (12):1414–32. doi:10.4236/as.2021.1212090.
- Magagnini, G., G. Grassi, and S. Kotiranta. 2018. The effect of light spectrum on the morphology and cannabinoid content of Cannabis sativa L. Medical Cannabis and Cannabinoids 1 (1):19–27. doi:10.1159/000489030.
- Mandolino, G., and A. Carboni. 2004. Potential of marker-assisted selection in hemp genetic improvement. Euphytica 140:107–20. doi:10.1007/s10681-004-4759-6.
- Mańkowska, G., A. Luwańska, K. Wielgus, and J. Bocianowski. 2015. Ocena zawartości kannabinoidów wybranych odmian konopi Cannabis sativa L. [evaluation of cannabinoid content in selected varieties of Cannabis sativa L.]. Biuletyn Instytutu Hodowli i Aklimatyzacji Roślin 277 (277):79–86. doi:10.37317/biul-2015-0012.
- Mechtler, K., J. Bailer, and K. de Hueber. 2004. Variations of Δ9-THC content in single plants of hemp varieties. Industrial Crops and Products 19 (1):19–24. doi:10.1016/S0926-6690(03)00077-3.
- Meijer, E. P., M. Bagatta, A. Carboni, P. Crucitti, V. M. Moliterni, P. Ranalli, and G. Mandolino. 2003. The inheritance of chemical phenotype in Cannabis sativa L. Genetics 163 (1):335–46. doi:10.1093/genetics/163.1.335.
- Meijer, E. P. M., and K. M. Hammond. 2005. The inheritance of chemical phenotype in Cannabis sativa L. (II): Cannabigerol predominant plants. Euphytica 145 (1–2):189–98. doi:10.1007/s10681-005-1164-8.
- Melzer, R., P. F. McCabe, and S. Schilling. 2022. Evolution, genetics and biochemistry of plant cannabinoid synthesis: A challenge for biotechnology in the years ahead. Current Opinion in Biotechnology 75:102684. doi:10.1016/j.copbio.2022.102684.
- Monthony, A. S., S. R. Page, M. Hesami, and A. M. P. Jones. 2021. The past, present and future of Cannabis sativa tissue culture. Plants 10 (1):185. doi:10.3390/plants10010185.
- Murashige, T., and F. Skoog. 1962. A revised medium for rapid growth and bioassays with tobacco tissue cultures. Physiologia Plantarum 15 (3):473–97. doi:10.1111/j.1399-3054.1962.tb08052.x.
- Nagy, D. U., K. Cianfaglione, F. Maggi, S. Sut, and S. Dall’acqua. 2019. Chemical characterization of leaves, male and female flowers from spontaneous cannabis (Cannabis sativa L.) growing in hungary. Chemistry & Biodiversity 16 (3):e1800562. doi:10.1002/cbdv.201800562.
- Namdar, D., M. Mazuz, A. Ion, and H. Koltai. 2018. Variation in the compositions of cannabinoid and terpenoids in Cannabis sativa derived from inflorescence position along the stem and extraction methods. Industrial Crops and Products 113:3763–82. doi:10.1016/j.indcrop.2018.01.060.
- Pacifico, D., F. Miselli, A. Carboni, A. Moschella, and G. Mandolino. 2008. Time course of cannabinoid accumulation and chemotype development during the growth of Cannabis sativa L. Euphytica 160:231–40. doi:10.1007/s10681-007-9543-y.
- Pacifico, D., F. Miselli, M. Micheler, A. Carboni, P. Ranalli, and G. Mandolino. 2006. Genetics and marker-assisted selection of the chemotype in Cannabis sativa L. Molecular Breeding 17:257–68. doi:10.1007/s11032-005-5681-x.
- Pagnani, G., M. Pellegrini, A. Galieni, S. D’Egidio, F. Matteucci, A. Ricci, F. Stagnari, M. Sergi, C. Lo Sterzo, M. Pisante, et al. 2018. Plant growth-promoting rhizobacteria (PGPR) in Cannabis sativa ‘Finola’ cultivation: An alternative fertilization strategy to improve plant growth and quality characteristics. Industrial Crops and Products 123:75–83. doi:10.1016/j.indcrop.2018.06.033.
- Pexová Kalinová, J., N. Vrchotová, J. Tříska, and Š. Hellerová. 2021. Industrial hemp (Cannabis sativa L.) as a possible source of cannabidiol. Journal of Central European Agriculture 22:110–18. doi:10.5513/JCEA01/22.1.2860.
- Poniatowska, J., K. Panasiewicz, K. Wielgus, M. Szalata, and B. Jaśkiewicz. 2022. Influence of agroclimatic conditions on active substances content in hemp cultivated in the South-East Baltic Region. Journal of Natural Fibers 19 (13):6119–33. doi:10.1080/15440478.2021.1904482.
- Raj, V., J. G. Park, K. H. Cho, P. Choi, T. Kim, J. Ham, and J. Lee. 2021. Assessment of antiviral potencies of cannabinoids against SARS-CoV-2 using computational and in vitro approaches. International Journal of Biological Macromolecules 168:474–85. doi:10.1016/j.ijbiomac.2020.12.020.
- Saloner, A., and N. Bernstein. 2021. Nitrogen supply affects cannabinoid and terpenoid profile in medical cannabis (Cannabis sativa L.). Industrial Crops and Products 167:113516. doi:10.1016/j.indcrop.2021.113516.
- Saloner, A., and N. Bernstein. 2022a. Effect of potassium (K) supply on cannabinoids, terpenoids and plant function in medical Cannabis. Agronomy 12 (5):1242. doi:10.3390/agronomy12051242.
- Saloner, A., and N. Bernstein. 2022b. Nitrogen source matters: High NH4/NO3 ratio reduces cannabinoids, terpenoids, and yield in medical cannabis. Frontiers in Plant Sciences 13:830224. doi:10.3389/fpls.2022.830224.
- Sheldon, K., A. Shekoofa, E. Walker, and H. Kelly. 2021. Physiological screening for drought-tolerance traits among hemp (Cannabis sativa L.) cultivars in controlled environments and in field. Journal of Crop Improvement 35 (6):816–31. doi:10.1080/15427528.2021.1883175.
- Shiponi, S., and N. Bernstein. 2021. The highs and lows of P supply in medical Cannabis: Effects on cannabinoids, the ionome, and morpho-physiology. Frontiers in Plant Sciences 12:657323. doi:10.3389/fpls.2021.657323.
- Stasiłowicz, A., A. Tomala, I. Podolak, and J. Cielecka-Piontek. 2021. Cannabis sativa L. as a natural drug meeting the criteria of a multitarget approach to treatment. International Journal of Molecular Sciences 22:778. doi:10.3390/ijms22020778.
- Taura, F., S. Sirikantaramas, Y. Shoyama, K. Yoshikai, Y. Shoyama, and S. Morimoto. 2007. Cannabidiolic-acid synthase, the chemotype-determining enzyme in the fiber-type Cannabis sativa. FEBS Letters 581 (16):2929–34. doi:10.1016/j.febslet.2007.05.043.
- Toth, J. A., G. M. Stack, A. R. Cala, C. H. Carlson, R. L. Wilk, J. L. Crawford, D. R. Viands, G. Philippe, C. D. Smart, J. K. C. Rose, et al. 2020. Development and validation of genetic markers for sex and cannabinoid chemotype in Cannabis sativa L. Global Change Biology Bioenergy. 12(3):213–22. doi:10.1111/gcbb.12667.
- Vásquez-Ocmín, P. G., G. Marti, M. Bonhomme, F. Mathis, S. Fournier, S. Bertani, and A. Maciuk. 2021. Cannabinoids vs. whole metabolome: Relevance of cannabinomics in analyzing cannabis varieties. Analytica chimica acta 1184:339020. doi:10.1016/j.aca.2021.339020.
- Vergara, D., E. L. Huscher, K. G. Keepers, R. M. Givens, C. G. Cizek, A. Torres, R. Gaudino, N. C. Kane, and H. Huber. 2019. Gene copy number is associated with phytochemistry in Cannabis sativa. AoB Plants 11 (6):lz074. doi:10.1093/aobpla/plz074.
- Weiblen, G. D., J. P. Wenger, K. J. Craft, M. A. ElSohly, Z. Mehmedic, E. L. Treiber, and M. D. Marks. 2015. Gene duplication and divergence affecting drug content in Cannabis sativa. The New Phytologist 208 (4):1241–50. doi:10.1111/nph.13562.
- Welling, M. T., L. Liu, T. Shapter, C. A. Raymond, and G. J. King. 2016. Characterisation of cannabinoid composition in a diverse Cannabis sativa L. germplasm collection. Euphytica 208 (3):463–75. doi:10.1007/s10681-015-1585-y.
- Wróbel, T., M. Dreger, K. Wielgus, and R. Słomski. 2022. Modified nodal cuttings and shoot tips protocol for rapid regeneration of Cannabis sativa L. Journal of Natural Fibers 19 (2):536–45. doi:10.1080/15440478.2020.1748160.