
 ?Mathematical formulae have been encoded as MathML and are displayed in this HTML version using MathJax in order to improve their display. Uncheck the box to turn MathJax off. This feature requires Javascript. Click on a formula to zoom.
ABSTRACT
Cotton fiber properties play a significant role in determining the quality of yarns and fabrics. Information on fiber length distribution is crucial throughout many textile processing steps to transform fibers into yarn. The current High Volume Instrument (HVI) provides only two traditional length parameters, the upper half mean length (UHML) and uniformity index (UI). The UI is the mean length (ML) divided by the UHML expressed as a percentage. Both UHML and ML are extracted from the fibrogram, are highly correlated, and characterize only the longer fibers in a sample. Yet, the whole fibrogram contains more descriptive information than the two length measurements provided by the HVI. In addition, the fibrogram is a stable measurement on an HVI, and differences in fibrogram measurements across instruments can be reduced using a recently proposed calibration method. However, the use of the complete fibrogram by the textile industry is complicated and almost impossible in practice. This study aimed to investigate a simplified method to identify key span lengths extracted from the HVI fibrogram that can improve yarn prediction compared to the current method. The results obtained from a set of 60 commercial-like samples covering a wide range of length parameters are promising.
摘要
棉纤维的性能在决定纱线和织物的质量方面起着重要作用. 在将纤维转化为纱线的许多纺织加工步骤中,纤维长度分布信息至关重要. 目前的大容量仪器(HVI)只提供两个传统的长度参数,上半平均长度(UHML)和均匀度指数(UI). UI是平均长度(ML)除以以百分比表示的UHML. UHML和ML都是从纤维图中提取的,高度相关,并且仅表征样品中较长的纤维. 然而,整个纤维图比HVI提供的两个长度测量包含更多的描述性信息. 此外,纤维图是HVI上的稳定测量,并且可以使用最近提出的校准方法来减少仪器之间纤维图测量的差异. 然而,纺织工业使用完整的纤维图是复杂的,在实践中几乎是不可能的. 本研究旨在研究一种简化的方法来识别从HVI纤维图中提取的关键跨距,与目前的方法相比,该方法可以改进纱线预测. 从一组覆盖广泛长度参数的60个商业类样品中获得的结果是有希望的.
Introduction
Cotton is being used by the textile industry as raw material to produce soft, breathable, lightweight, and biodegradable products. Cotton fiber properties play a significant role in determining the quality of the yarn produced (Delhom, Martin, and Schreiner Citation2017; Kelly et al. Citation2015). Among the physical properties of cotton, fiber length is one of the most critical properties to producers, breeders, and spinners (Delhom, Kelly, and Martin Citation2018; Hertel and Craven Citation1960; Kothari et al. Citation2015; Morton and Hearle Citation2008; Wakeham Citation1955). Several scholars revealed the significance of fiber length and its distribution throughout textile processing (Cai et al. Citation2013; Kelly and Hequet Citation2018; Sawhney and Zeidman Citation2002; van der Sluijs, Delhom, and Martin Citation2021; Wakeham Citation1955). As the fiber length distribution holds indispensable data that can be used to adjust machine settings through many processing stages found in spinning mills to translate fibers into yarn (Hertel Citation1940; Hertel and Craven Citation1960; Krifa and Ethridge Citation2006).
Ring spinning is the most dominant spinning method to produce a wide range of yarn counts (Klein and Stalder Citation2014; Rengasamy Citation2010a, Citation2010b). The quality of cotton fibers is related to the production cost and ring-spun yarn quality (Klein and Stalder Citation2014). The cost of cotton fiber accounts for more than half of the yarn manufacturing cost (Klein Citation2014). This also indicates the significance of fiber quality for spinners. The textile industry requires adequate raw materials that perform well during processing to produce the desired product quality.
Many scientists (Cai et al. Citation2013; El Mogahzy, Broughton, and Lynch Citation1990; Elmogahzy and Farag Citation2018; Sasser et al. Citation1991; Sayeed et al. Citation2021) have developed statistical and theoretical models that relate fiber properties to yarn properties. These models have been used as tools to quantify the relative importance of various fiber properties. Some of these prediction models were developed to estimate the tensile properties, imperfections, unevenness, and hairiness of ring-spun yarns from cotton fiber properties.
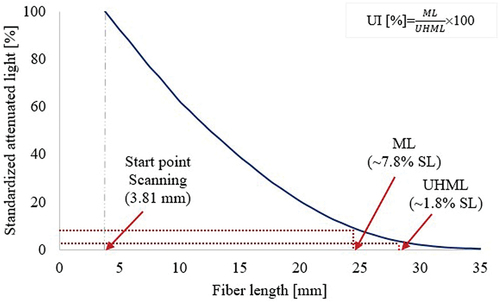
As noted earlier, fiber length is a key attribute to determine the yarn quality. The High Volume Instrument (HVI) is the most frequently used equipment in the cotton industry for assessing important cotton fiber properties (Suh and Sasser Citation1996). The yarn prediction models developed by many scholars integrate the two length parameters (Upper Half Mean Length, UHML and Uniformity Index, UI) reported by the HVI. Although these reported length parameters are used in the current U.S. cotton classification and global cotton marketing systems, they do not adequately explain the within-sample variation in fiber length. During the HVI length measurement, a fiber beard is formed by randomly sampling raw cotton fibers (~20,000 fibers/fiber beard). The fiber beard is brushed to remove loosely attached fibers and foreign matter and moved to a sensor to be scanned with a beam of light. The scanning starts at 3.81 mm away from the base to avoid the possible noises associated with the HVI comb and a beam of light. When scanning begins, the maximum light is attenuated, normalizing the measurement to 100%. As scanning continues toward the fiber beard’s tip, the light attenuated amount decreases with the number of fibers to finally reach 0%. The fibrogram is generated based on the distance traveled by the fiber beard and the corresponding attenuated light. Then, the HVI reports only two length parameters from the fibrogram. shows a fibrogram for illustration and indicates the two length values HVI uses to report the current length parameters.
Figure 1. A fibrogram and its association with the current HVI length parameters.
The fibrogram is a graphic representation of the length distribution of the fibers in the fiber beard. The complete fibrogram contains more descriptive information than the two traditional length measurements provided by the HVI. Sayeed et al. developed yarn prediction models using three principal components (PCs) of the fibrogram data representing nearly 98% of the total within-sample variability. These yarn prediction models integrating the complete fibrogram were better than the ones using the current HVI length parameters and at least as good as the traditional models using AFIS (Sayeed et al. Citation2021). However, the use of the entire fibrogram was not practical and no information was available on the stability and reproducibility of the fibrograms.
Recent findings on similar research areas showed the stability of a fibrogram measurement under normal operations for short-term and long-term periods (Tesema et al. Citation2022). However, the same article reported the variability of fibrogram measurements across multiple instruments and the need for a calibration procedure. The proposed calibration procedure effectively reduced the differences among the HVI lines (Tesema et al. Citation2022). Since a calibration procedure exists for the two traditional HVI length parameters using two USDA length calibration cotton standards, a similar procedure was followed for calibrating the fibrogram; but instead of calibrating UHML (~1.8% span length) and ML (~7.8% span length), eight span lengths across the fibrogram were calibrated. They acquired reference and observed values for a series of span lengths extracted from a fibrogram using the two universal standards which are used to calibrate HVI length parameters. Then, simple linear regressions between the reference and observed values were used to obtain calibration equations. The proposed calibration procedure was tested on 13 samples covering a wide range of fiber length parameters. The results revealed that the HVI lines are considerably closer to the acceptable limit after calibration (Tesema et al. Citation2022). It was hypothesized that using unused length information from the fibrograms would result in improved yarn predictions compared to currently reported HVI length data. This study aims to study the relationships between important ring-spun yarn quality parameters and selected span lengths extracted from the fibrogram and to design appropriate models for predicting yarn quality.
Materials and methods
For this experiment, a set of samples that covers a wide range of length parameters was used. Every year, the Plains Cooperative Improvement Committee (PCIC) grows several commercial varieties in various locations in Texas. Sixty samples were grown in 2016 across the Texas High Plains. They are “commercial-like samples” as they meet most of the requirements for commercial cotton production. In brief, they are breeder varieties grown, harvested, and ginned like commercial cotton on a large scale. They consist of 12 varieties grown in five distinct locations. A stripper harvester (John Deere 7460, USA) was used to harvest the cotton. In addition, these samples were ginned with a commercial-type gin (i.e., Continental Double Eagle 93 saw gin stand) at the USDA Agricultural Research Services (USDA ARS) ginning facility in Lubbock, Texas. The 60 samples were conditioned at 21 ± 1°C and 65 ± 2% RH for at least 48 hours prior to testing. These samples covered a broad range of fiber quality parameters ().
Table 1. Descriptive statistics of 60 commercial-like samples from the 2016 crop year.
The samples were tested with the HVI (USTER® HVI 1000) using a research protocol of 4-4-10 (4 micronaire, 4 color and trash, and 10 length/strength). Along with the regular HVI properties, we acquired the fibrograms for each sample with 10 replications using the HVI module testing mode. The module testing mode provides functionality to store a fibrogram as a graphical image. After testing, a series of 81 data points for each sample was extracted from the fibrogram (Sayeed et al. Citation2021). Eight span lengths (2%, 8%, 15%, 25%, 40%, 50%, 60%, and 75%) were selected representing fiber lengths from short to long fibers for this study. The samples were also tested with the AFIS (USTER® AFIS Pro 2) with five replications per sample. Then, samples were processed into 30Ne ring-spun yarn.
About 27 kg of raw cotton fibers from each sample were used to produce the carded ring spun yarn. After opening and blending, the samples were carded with a card (Trutzchler DK 903, Germany) to produce card slivers. Card slivers were passed through a breaker draw frame (Trutzchler HSR 1000, Germany) and finisher draw frame (Reiter RSB 851, Switzerland) to blend eight slivers at each drawing frame and minimize variations in mass among card slivers. These slivers were further reduced to the required linear density by roving machines. Eventually, the roving bobbins were fed and processed by a ring spinning machine (Suessen Fiomax 1000, Germany) which run at a speed of 14,500 rpm with a twist multiplier of 3.64 to produce 30Ne ring spun yarns.
Yarn quality parameters including tensile properties (tenacity, elongation, work-to-break), unevenness (U%), imperfections (coefficient of variation of mass (CVm%), thin places (−50%), thick places (+50%), neps (+200%)), and hairiness were measured using standard testing protocols. Yarn tensile properties were measured on 20 single-end breaks per bobbin on 10 bobbins on Statimat DS. For yarn unevenness, imperfections, and hairiness, 400 meters of yarn per bobbin on 10 bobbins were tested on Uster Tester 5.
Some of the yarn quality parameters showed a non-linear relationship between yarn properties and fiber properties such as thin places, thick places, neps, and CVm%. Therefore, we applied a transformation to linearize the relationships. A square root transformation was used for thin places, thick places, and yarn neps, while the arcsine square root transformation was used for CVm% and hairiness. Then, all fiber properties and yarn parameters data were centered and scaled prior to analysis.
Partial Least Squares Regression (PLSR) was used to develop the models to avoid the multicollinearity problem among fiber properties. Several PLSR models were developed using different span lengths along with the HVI non-length parameters (strength, elongation, micronaire, Rd, and +b). Each model has been developed using fiber properties as predictor variables and a yarn quality parameter as a response variable.
Six models were selected after several attempts and are described below. These models contain a customized length value called uniformity ratio by span lengths (i.e., , which is a ratio of two span lengths expressed as a percentage.
Model I: Non-length HVI data + HVI length data [UHML and UI]
Model II: Non-length HVI data + 2.5%SL + UR_15
Model III: Non-length HVI data + 2.5%SL + UR_25
Model IV: Non-length HVI data + 2.5%SL + UR_50
Model V: Model I + 3 AFIS parameters [AFIS Ln, AFIS SFCn, and AFIS L5n]
Model VI: Model I + 5 AFIS parameters [AFIS Ln, AFIS SFCn, AFIS L5n, Mat and Hs]
Leave-one-out cross-validation was used to evaluate the performance of each model. Each time, we took away one sample and developed the prediction model using the rest of the samples. The coefficient of determination (R2) was obtained for each model. Using the developed model, we predicted the yarn quality of the sample we took out. We calculated the error between the observed yarn quality and the predicted yarn quality. This procedure was executed 60 times – once for each sample. The mean squared error (MSE) for each of the models for each of the yarn quality parameters was calculated. The R2 and MSE are used as criteria for model comparisons.
Results and discussion
Yarn tenacity
Tenacity is a force required to break a fiber or bundle of fibers and is expressed as strength divided by the linear density of the fiber or fiber bundle (i.e. g/tex). Strength is an important attribute to determine the quality of cotton fiber (Elmogahzy and Farag Citation2018; May and Taylor Citation1998; Sawhney and Zeidman Citation2002). It is understandable that a textile fiber should have adequate strength to endure the complex external forces exerted on the fibers during spinning, weaving or knitting, and textile wet processing.
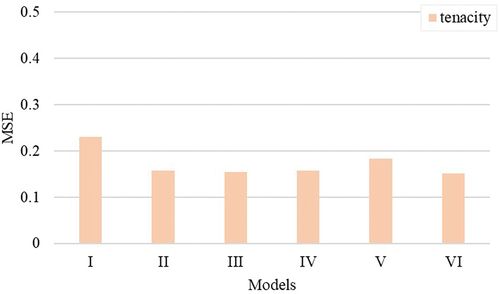
For yarn tenacity, Model I, which uses the HVI-reported length parameters, did not perform as well as the other models shown in . All models based on the fibrogram unused span lengths (i.e., Models II-IV) were about the same. Models integrating currently unused span lengths perform better to explain the variation in yarn tenacity than Model I and Model V (i.e., the model I plus three AFIS length parameters). As expected, model VI (i.e., the model I plus five AFIS parameters) seemed to perform slightly better than the models with the fibrogram span lengths due to the addition of Maturity (Mat) and Standard fineness (Hs). Mat and Hs determine the number of fibers in the cross-section of a yarn which is related to friction among fibers and, therefore, to yarn tenacity (Hequet et al. Citation2006).
Figure 2. The amount of variation explained (R2) in yarn tenacity (g/tex) by different yarn quality prediction models.
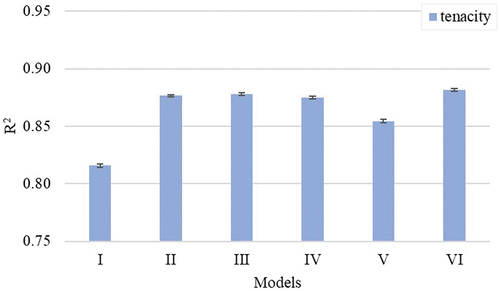
Figure 3. Performance of different yarn quality models while predicting yarn tenacity (g/tex) based on MSE.
Yarn work-to-break
In , we compare the R2 and MSE values of the models for 30Ne ring-spun yarn work-to-break. The work-to-break is the area under the stress-strain curve up to the point of rupture. It provides the energy required to break the yarn during textile processing. It impacts yarn processability and performance in weaving and knitting (Faulkner et al. Citation2012; Kelly et al. Citation2019; Mathangadeera et al. Citation2020; McCormick et al. Citation2019).
Figure 4. The amount of variation explained (R2) in yarn work-to-break by different yarn quality prediction models.
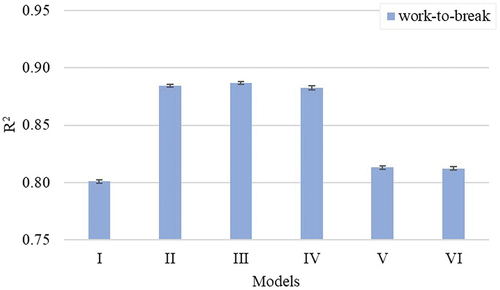
Figure 5. Performance of different yarn quality models while predicting yarn work-to-break based on MSE.
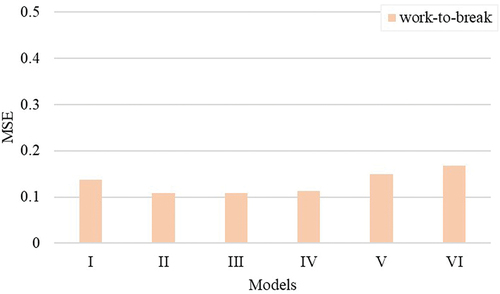
Model I, which contains the regular HVI length output, was the least performing model characterized by the smallest R2 and higher MSE. Models based on unused span lengths (i.e., models II-IV) showed better performance than the HVI- and AFIS-based length models. It is interesting to note that models based on two unused span lengths (i.e., models II through IV) were about the same and showed better performance than other models.
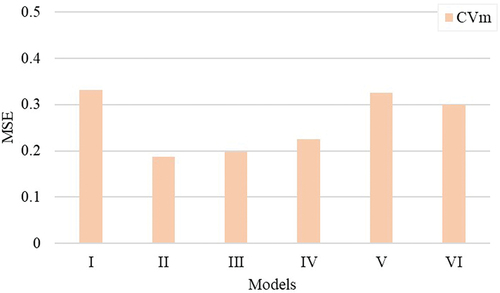
Yarn coefficient of mass variation
The coefficient of mass variation (CVm%) is a measure of yarn irregularity and is determined by the ratio of the standard deviation of yarn mass variation of a specified length divided by the mean mass variation of the yarn. Yarn unevenness can be attributed to poor fiber quality, deficiencies during spinning preparation and yarn production, and defective processing machine parts (Addisu and Hameed Citation2007). Thin places, thick places, and neps are highly associated with unevenness on yarn cross-sections (Padmanabhan and Balasubramanian Citation1990; Thibodeaux et al. Citation2008). The higher the CVm% value, the greater the variation in yarn mass and the worse the quality. This yarn defect affects fabric production and results in production loss due to frequent yarn breakages, fabric defects, and shade variation during dyeing (Addisu and Hameed Citation2007; Lappage Citation2005; Price, Calamari, and Meredith Citation2002). The R2 and MSE values for 30Ne ring-spun yarn unevenness are compared in . For yarn CVm%, models based on unused length information in a fibrogram explained the yarn mass variations better than the HVI- and AFIS-based length models.
Figure 6. The amount of variation explained (R2) in yarn coefficient of mass variation (CVm %) by different yarn quality prediction models.
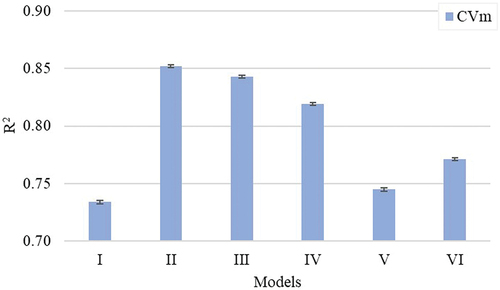
Figure 7. Performance of different yarn quality models while predicting yarn coefficient of mass variation (CVm %) based on MSE.
Yarn thin places
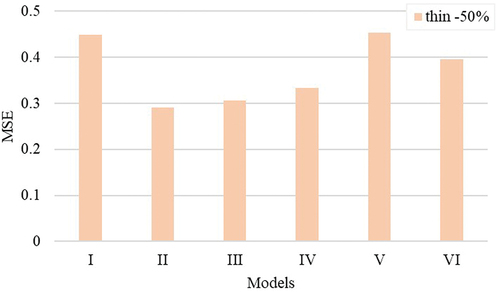
A thin place is a yarn defect characterized by a mass of a yarn portion below 50% of the average yarn mass. Thin places are weak spots that can result in increased yarn breakage rates during fabric production (Lappage Citation2005; Padmanabhan and Balasubramanian Citation1990). compare the R2 and MSE values of six models for thin places. The model I with the regular length output has a lower R2 value and higher MSE. This means these length parameters have a lower impact on the number of thin places. Whereas models with unused span lengths extracted from unused portions of the fibrogram showed higher R2 and lower MSE than models based on the current methods (i.e., models I, V, and VI). It was noticed that models with the fibrogram unused length data explained the variation in thin places much better than the HVI- and AFIS-based length models.
Figure 8. The amount of variation explained (R2) in yarn thin places − 50% (counts/km) by different yarn quality prediction models.
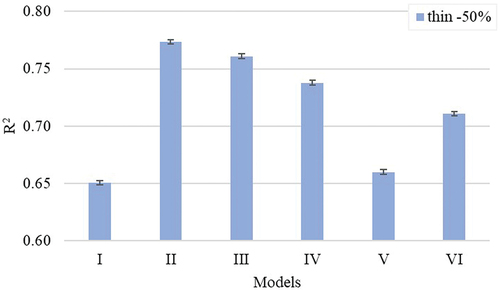
Figure 9. Performance of different yarn quality models while predicting yarn thin places − 50% (counts/km) based on MSE.
Yarn thick places
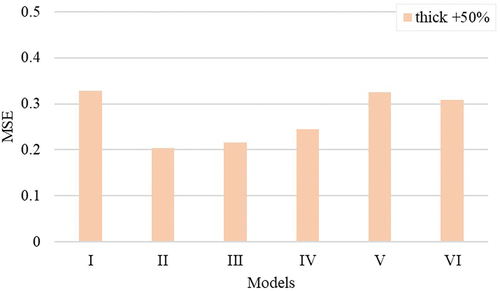
A thick place is a yarn defect characterized by a mass of a yarn portion exceeding 50% of the average yarn mass. It looks like a slub and affects fabric production and quality.
compare the R2 and MSE values of the models for yarn thick places. A higher R2 value in some of the models shows that the fiber properties used to develop the specified model have a high impact on the ring-spun yarn number of thick places. It has been previously reported that length properties have a significant impact on the variation of thin and thick places (Cai et al. Citation2013). Models I, V, and VI show lower R2 and relatively higher MSE than other models developed using unused span lengths extracted from the fibrogram. The models developed using unused span lengths explained yarn thick places better than the HVI- and AFIS-based length models.
Figure 10. The amount of variation explained (R2) in yarn thick places + 50% (counts/km) by different yarn quality prediction models.
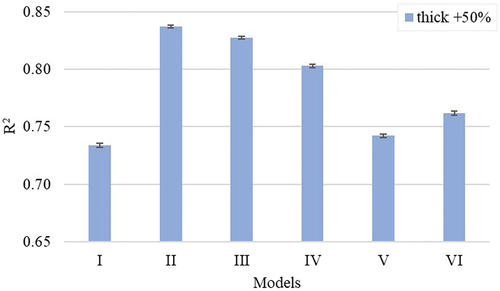
Figure 11. Performance of different yarn quality models while predicting yarn thick places + 50% (counts/km) based on MSE.
Yarn neps
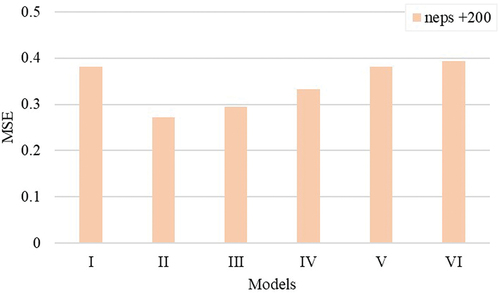
Neps are knots of entangled fibers characterized by a mass of a yarn portion exceeding 200% of the average mass of the ring-spun yarn (van der Sluijs and Hunter Citation1999). Neps can cause frequent yarn breakages resulting in production losses and lowering the quality of yarn and fabrics (van der Sluijs and Hunter Citation1999, Citation2016). compare the R2 and MSE values of the different models for neps. As described above for thin and thick places, neps adversely affect the quality and productivity of textile processing. The models based on the unused fibrogram span lengths (i.e., models II, III, and IV) outperform both the HVI- and AFIS-based length models (i.e., models I, V, and VI). However, the performance of the models based on unused span lengths (i.e., models II through IV) was reduced for lower percent span lengths. In other words, models representing longer fibers (lower percent span lengths) better explain neps because longer fibers tend to entangle more than shorter fibers.
Figure 12. The amount of variation explained (R2) in yarn neps + 200 (counts/km) by different yarn quality prediction models.
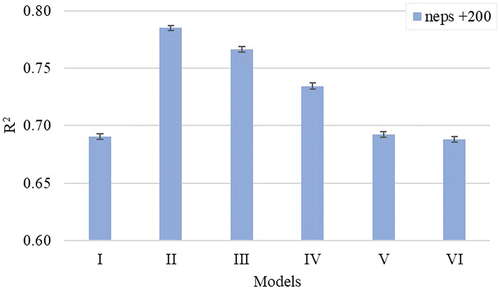
Figure 13. Performance of different yarn quality models while predicting yarn neps + 200 (counts/km) based on MSE.
Yarn hairiness
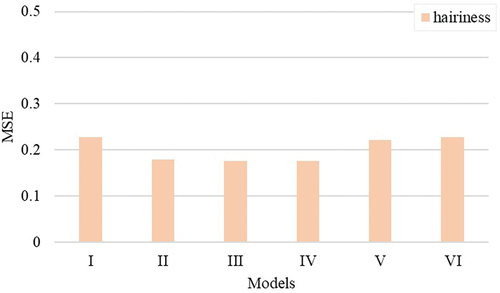
Yarn hairiness is a measure of protruding fibers (hairs) on the surface of the yarn. The incidence of long hairs and/or an excessive number of short hairs on the yarn surface is an undesirable property resulting in yarn breakages during weaving as neighboring yarns can entangle easily. This property is influenced by several factors including cotton fiber quality and yarn processing parameters (Barella and Manich Citation1997; Haleem and Wang Citation2015; Krupincová and Meloun Citation2013). These factors can be related to fiber length uniformity, short fiber content, fiber elongation, fiber strength, yarn twists, and yarn linear density which can cause breakages in weaving. In most cases, long, strong, and high-elongation cotton fibers will make less hairy yarn (Krifa and Ethridge Citation2006; Krupincová and Meloun Citation2013).
The models (i.e., models II-IV) developed using unused span lengths did a better job of explaining yarn hairiness than other models developed using the HVI-based models and AFIS-based models. In almost all yarn qualities, model II is as good or better at explaining yarn imperfections than the other unused span length models except for yarn hairiness () where it appears similar to the other two models.
Figure 14. The amount of variation explained (R2) in yarn hairiness by different yarn quality prediction models.
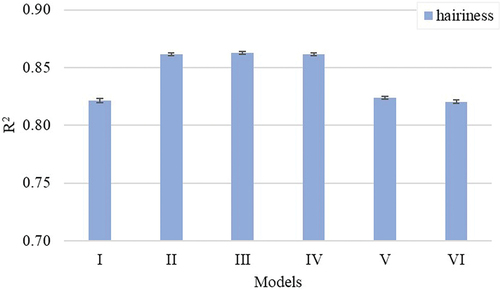
Figure 15. Performance of different yarn quality models while predicting yarn hairiness based on MSE.
Conclusions
The High Volume Instrument (HVI) is a common tool to measure important cotton fiber properties to determine the economic value of cotton. Among measured fiber properties, length is an important property as it affects textile processing and determines the quality of yarn and fabrics. The HVI extracts ML (~7.8% span length) and UHML (~1.8% span length) from the fibrogram and reports two length parameters, the upper half mean length (UHML) and uniformity index (UI). While these parameters are used to classify the U.S. cotton and global marketing systems, they only characterize the longer fibers. On the other hand, information on short fibers is also important to the textile industries as short fibers affect textile processing and product quality negatively. However, the fibrogram which is generated during the length measurement comprises valuable information related to the within-sample variation in fiber length that is not captured by the current HVI length parameters. It is obvious that a large portion of a fibrogram is not used.
Recent studies on a fibrogram showed its stability under normal operation, its method of calibration across HVIs, and its importance to the cotton industry. Yet, the use of the entire fibrogram for yarn prediction is not feasible. Therefore, it was important to identify the key span lengths extracted from the fibrogram that can improve yarn prediction.
The length measurements being evaluated in this study were derived from measurements made by HVI but not reported by the HVI. There is no new instrument being used, we are just using the HVI more efficiently. For a set of 60 commercial-like samples, models with new length information captured by the fibrogram perform better in predicting yarn quality than the current HVI and AFIS outputs. Even two span lengths from a fibrogram will be able to perform better than the current method. The yarn models developed with a large set of commercial cotton bales could be an effective tool for cotton breeders and spinners to characterize the fiber properties better with the existing infrastructure and no extra cost.
Highlights
The current length parameters, Upper Half Mean Length (UHML) and Uniformity Index (UI) do not adequately characterize within sample variability of cotton fibers length.
Other key length parameters from the fibrogram that can improve yarn prediction models are identified.
Yarn models with new length information performed better in predicting important yarn quality parameters than the current High Volume Instrument (HVI) and Advanced Fiber Information System (AFIS) outputs.
Yarn models developed with a large set of commercial cotton bales could be an effective tool for the spinners to predict the quality of yarn and fabrics.
Acknowledgements
We would like to thank Cotton Incorporated for funding this research and Plains Cotton Growers for providing the PCIC cotton samples. We appreciate the help of the phenomics research laboratory technicians and staff at the Fiber and Biopolymer Research Institute, Department of Plant and Soil Science, Texas Tech University for testing our samples.
Disclosure statement
No potential conflict of interest was reported by the author(s).
Additional information
Funding
References
- Addisu, F., and P. M. A. Hameed. 2007. Investigation into the periodicity of mass variation of yarn and its effect on fabric appearance. AUTEX Research Journal 7 (2):89–14.
- Barella, A. M. M. A., and A. M. Manich. 1997. Yarn hairiness update. Textile Progress 26 (4):1–29. doi:10.1080/00405169708688867.
- Cai, Y., X. Cui, J. Rodgers, D. Thibodeaux, V. Martin, M. Watson, and S. S. Pang. 2013. A comparative study of the effects of cotton fiber length parameters on modeling yarn properties. Textile Research Journal 83 (9):961–70. doi:10.1177/0040517512468821.
- Delhom, C. D., B. Kelly, and V. Martin. 2018. Physical properties of cotton fiber and their measurement. In Cotton fiber: Physics, chemistry and biology, ed. D. D. Fang, 41–73. Cham: Springer. doi:10.1007/978-3-030-00871-0_3.
- Delhom, C. D., V. B. Martin, and M. K. Schreiner. 2017. COTTON GINNERS HANDBOOK: Textile industry needs. Journal of Cotton Science 21 (3):210–19. doi:10.56454/ZELZ3209.
- El Mogahzy, Y. E., R. Broughton Jr, and W. K. Lynch. 1990. A statistical approach for determining the technological value of cotton using HVI fiber properties. Textile Research Journal 60 (9):495–500. doi:10.1177/004051759006000901.
- Elmogahzy, Y., and R. Farag. 2018. Tensile properties of cotton fibers. In Handbook of properties of textile and technical fibres 223–73. Woodhead Publishing. doi:10.1016/B978-0-08-101272-7.00007-9.
- Faulkner, W. B., E. F. Hequet, J. Wanjura, and R. Boman. 2012. Relationships of cotton fiber properties to ring-spun yarn quality on selected High Plains cottons. Textile Research Journal 82 (4):400–14. doi:10.1177/0040517511426613.
- Haleem, N., and X. Wang. 2015. Recent research and developments on yarn hairiness. Textile Research Journal 85 (2):211–24. doi:10.1177/0040517514538692.
- Hequet, E. F., B. Wyatt, N. Abidi, and D. P. Thibodeaux. 2006. Creation of a set of reference material for cotton fiber maturity measurements. Textile Research Journal 76 (7):576–86. doi:10.1177/0040517506064710.
- Hertel, K. L. 1940. A method of fibre-length analysis using the fibrograph. Textile Research 10 (12):510–20. doi:10.1177/004051754001001203.
- Hertel, K. L., and C. J. Craven. 1960. Span length as a fiber length criterion. Textile Industries 124 (7):103–07.
- Kelly, B., N. Abidi, D. Ethridge, and E. F. Hequet. 2015. Fiber to fabric. In Cotton, ed., D. D. Fang and R. G. Percy, 2nd, Vol. 57, 665–744. American Society of Agronomy, Inc., Crop Science Society of America, Inc., Soil Science Society of America, Inc. doi:10.2134/agronmonogr57.2013.0031.
- Kelly, B. R., and E. F. Hequet. 2018. Variation in the advanced fiber information system cotton fiber length-by-number distribution captured by High Volume Instrument fiber length parameters. Textile Research Journal 88 (7):754–65. doi:10.1177/0040517516688628.
- Kelly, C. M., J. Osorio-Marin, N. Kothari, S. Hague, and J. K. Dever. 2019. Genetic improvement in cotton fiber elongation can impact yarn quality. Industrial Crops and Products 129:1–9. doi:10.1016/j.indcrop.2018.11.066.
- Klein, W. 2014. Technology of short-staple spinning. In The rieter manual of spinning, Vol. 1, 11–22. Winterthur: Rieter Machine Works Ltd.
- Klein, W., and H. Stalder. 2014. Ring spinning. In The rieter manual of spinning, Vol. 4, 1–11. Winterthur: Rieter Machine Works Ltd.
- Kothari, N., J. Dever, S. Hague, and E. Hequet. 2015. Evaluating intraplant cotton fiber variability. Crop Science 55 (2):564–70. doi:10.2135/cropsci2014.01.0077.
- Krifa, M., and M. D. Ethridge. 2006. Compact spinning effect on cotton yarn quality: Interactions with fiber characteristics. Textile Research Journal 76 (5):388–99. doi:10.1177/0040517506062648.
- Krupincová, G., and M. Meloun. 2013. Yarn hairiness versus quality of yarn. The Journal of the Textile Institute 104 (12):1312–19. doi:10.1080/00405000.2013.800377.
- Lappage, J. 2005. End breaks in the spinning and weaving of weavable singles yarns: Part 2: End breaks in weaving. Textile Research Journal 75 (6):512–17. doi:10.1177/0040517505054189.
- Mathangadeera, R. W., E. F. Hequet, B. Kelly, J. K. Dever, and C. M. Kelly. 2020. Importance of cotton fiber elongation in fiber processing. Industrial Crops and Products 147:1–7. doi:10.1016/j.indcrop.2020.112217.
- May, O. L., and R. A. Taylor. 1998. Breeding cottons with higher yarn tenacity. Textile Research Journal 68 (4):302–07. doi:10.1177/004051759806800409.
- McCormick, K. M., J. P. S. Morais, E. Hequet, and B. Kelly. 2019. Development of the correction procedure for High Volume Instrument elongation measurement. Textile Research Journal 89 (19–20):4095–103. doi:10.1177/0040517519829002.
- Morton, W. E., and J. W. S. Hearle. 2008. Physical properties of textile fibres. 4th ed. Cambridge, England: Woodhead Publishing Limited. doi:10.1533/9781845694425.
- Padmanabhan, A. R., and A. Balasubramanian. 1990. An exploratory study of imperfections in cotton yarns. Textile Research Journal 60 (1):17–22. doi:10.1177/004051759006000103.
- Price, J. B., T. A. Calamari, and W. R. Meredith Jr. 2002. A comparison of yarn evenness and imperfection data. Textile Research Journal 72 (9):810–16. doi:10.1177/004051750207200910.
- Rengasamy, R. S. 2010b. Fundamental principles of ring spinning of yarns. In Advances in yarn spinning technology, ed. C. A. Lawrence, 42–78. Woodhead Publishing. doi:10.1533/9780857090218.1.42.
- Rengasamy, R. S. 2010a. Developments in ring spinning. In Advances in yarn spinning technology, C. A. Lawrence. ed., 193–216. Woodhead Publishing. doi:10.1533/9780857090218.2.193.
- Sasser, P. E., F. M. Shofner, Y. T. Chu, C. K. Shofner, and M. G. Townes. 1991. Interpretations of single fiber, bundle, and yarn tenacity data. Textile Research Journal 61 (11):681–90. doi:10.1177/004051759106101108.
- Sawhney, P. S., and M. Zeidman. 2002. Influence of fiber length distribution on strength efficiency of fibers in yarn. Textile Research Journal 72 (3):216–20. doi:10.1177/004051750207200306.
- Sayeed, M. A., M. Schumann, J. Wanjura, B. R. Kelly, W. Smith, and E. F. Hequet. 2021. Characterizing the total within-sample variation in cotton fiber length using the High Volume INstrument fibrogram. Textile Research Journal 91 (1–2):175–87. doi:10.1177/0040517520935212.
- Suh, M. W., and P. E. Sasser. 1996. The technological and economic impact of high volume instrument (HVI) systems on the cotton and cotton textile industries. The Journal of the Textile Institute 87 (3):43–59. doi:10.1080/00405009608659117.
- Tesema, A. F., M. A. Sayeed, C. Turner, B. R. Kelly, and E. F. Hequet. 2022. An approach for obtaining stable, reproducible, and accurate fibrogram measurements from High Volume Instruments. Agronomy 12 (5):1120. doi:10.3390/agronomy12051120.
- Thibodeaux, D., H. E. R. M. A. N. Senter, J. L. Knowlton, D. A. V. I. D. McAlister, and X. Cui. 2008. The impact of short fiber content on the quality of cotton ring spun yarn. Journal of Cotton Science 12 (4):368–77. http://journal.cotton.org.
- van der Sluijs, M. H. J., C. D. Delhom, and V. B. Martin. 2021. Assessment of cotton fibre length measurement methods. The Journal of the Textile Institute 112 (9):1377–89. doi:10.1080/00405000.2020.1816684.
- van der Sluijs, M. H. J., and L. Hunter. 1999. Neps in cotton lint. Textile Progress 28 (4):1–47. doi:10.1080/00405169908688875.
- van der Sluijs, M. H. J., and L. Hunter. 2016. A review on the formation, causes, measurement, implications and reduction of neps during cotton processing. Textile Progress 48 (4):221–323. doi:10.1080/00405167.2016.1233656.
- Wakeham, H. 1955. Cotton fiber length distribution—an important quality factor. Textile Research Journal 25 (5):422–29. doi:10.1177/004051755502500509.