
Abstract
Airborne particles play a significant role in the transmission of SARS-CoV-2, the virus that causes COVID-19. A previous study reported that institutional flush-O-meter (FOM) toilets can generate 3–12 times as many droplets as other toilets by splashing (large droplets) and bubble bursting (fine droplets). In this study, an aerosol suppression lid was evaluated to measure the reduction of particles by size using three metrics; number, surface area, and mass concentrations. To quantify toilet flush aerosol over time, detailed particle size distributions (from 0.016–19.81 µm across 152 size bins) were measured from a FOM toilet in a controlled-environment test chamber, without ventilation, with and without use of the suppression lid. Prior to each flushing trial, the toilet bowl water was seeded with 480 mL fluorescein at 10 mg/mL. A high-speed camera was used to record the large droplet movements after flushing. An ultraviolet-visible spectrophotometer was used to analyze the wipe samples to evaluate the contamination on the lid. The particle number, surface area, and mass concentrations without a lid were elevated compared to a lid in the first 90 sec. Overall, the lid reduced 48% of total number concentration, 76% of total surface area concentration, and 66% of total mass concentration, respectively. Depending on the particle size, the number concentration reduction percentage ranged from 48–100% for particles larger than 0.1 µm. Large droplets created by splashing were captured by the high-speed camera. Similar studies can be used for future particle aerodynamic studies. The fluorescein droplets deposited on the lid back sections, which were closer to the FOM accounted for 82% of the total fluorescein. Based on two-way ANOVA analysis, there were significant differences among both the experimental flushes (p = 0.0185) and the sections on the lid (p = 0.0146). Future work should explore the aerosolization produced by flushing and the performance of the lid in real restroom environments, where feces and urine exist in the bowl water and the indoor ventilation system is in operation.
Introduction
The severe acute respiratory syndrome coronavirus 2 (SARS-CoV-2) is a highly transmissible virus that causes the coronavirus disease 2019 (COVID-19). Recent studies have reported the presence of SARS-CoV-2 ribonucleic acid (RNA) in human feces and urine (Chen et al. Citation2020; Foladori et al. Citation2020; Wang et al. Citation2020; Park et al. Citation2021). Aerosol transmission of SARS-CoV-2 is plausible since the virus can remain viable and infectious in aerosol form for hours (Asadi et al. Citation2020; van Doremalen et al. Citation2020). Therefore, in addition to close human contact, the SARS-CoV-2 may also spread via fecal-oral and aerosol-borne routes (Hindson Citation2020; Wang and Du Citation2020). The actual SARS-CoV-2 size ranges from 60–150 nm (Kim et al. Citation2020; Matsuyama et al. Citation2020; Cascella et al. Citation2021). However, an aerodynamic analysis of the SARS-CoV-2 found that the virus RNA was found on particles with sizes ranging from nanoparticles (<100 nm) to 10 µm particles, and the peak concentration of the virus RNA was found on 250–500 nm particles in a protective-apparel removal room (Liu et al. Citation2020). For different size particles, the adverse health effects were found to be associated with various metrics, including the number, surface area, and mass concentrations. Therefore, the detailed particle size distributions in various metrics from the potential emission sources should be measured for assessment and control.
Flushing of institutional toilets of the type found in healthcare facilities, long-term care facilities, and public restrooms has been postulated to facilitate the spread of pathogenic organisms, including Clostridioides difficile, Escherichia coli, Legionella pneumophila, and SARS-CoV-2 (Johnson et al. Citation2013; Knowlton et al. Citation2018; Aithinne et al. Citation2019; Amirian Citation2020; Wilson et al. Citation2020; Dancer et al. Citation2021; Schreck et al. Citation2021). These institutions typically employ Flush-O-meter (FOM) types of toilets that do not have a lid covering the toilet. The subsequent production of aerosol plumes may result in inhalation of respirable particulates containing bacteria and viruses and can also lead to their deposition on surfaces that result in dermal contact. In addition to the spread of infectious agents, there has been concern that chemotherapy drugs present in patient waste may also be spread in a similar manner (Kromhout et al. Citation2000; Crul et al. Citation2020; Eisenberg et al. Citation2021), thus potentially exposing healthcare personnel who dispose of bodily waste and housekeeping personnel who clean contaminated areas. Therefore, exposure to infectious pathogens and hazardous drugs pose significant risks to healthcare professionals, cleaning staff members, and patients in the hospital.
Engineering controls that separate workers from potential hazards are one of the key elements in the Hierarchy of Controls to protect individuals from exposure to infectious agents and hazardous chemicals (NIOSH Citation2015). Engineering controls have long been employed in various healthcare and industrial settings and include ventilation, negative-pressure rooms, plexiglass shields, antimicrobial materials, and others (Möhlenkamp and Thiele Citation2020; Al-Benna Citation2021; Billings et al. Citation2021; Esteban Florez et al. Citation2021; Opfermann et al. Citation2021). Most hospital toilets do not have lids because they might harbor dangerous pathogens (Newsom Citation1972), which increases the risk of the housekeeper staff or increases their workload of cleaning and maintaining the lids. However, previous studies also indicate that lidless toilets increase the risk of environmental contamination with infectious pathogens (Best et al. Citation2012). Additional research on the role of a control measure such as a toilet lid is needed (McDermott et al. Citation2020).
Therefore, in this study, we comprehensively evaluated the performance of a temporary lid in reducing particle spread from FOM toilet flushing. We measured the detailed particle size distributions in three metrics (number, surface area, and mass) from flushing with and without a lid in a controlled-environment chamber using state-of-the-art aerosol instrumentations. To visualize the generated particle dynamics, a high-speed camera was used to record particle movements. To evaluate lid contamination due to toilet flushing, wipe samples were performed on various portions of the lid.
Methods
Experimental chamber
This study was conducted in a controlled-environment flushing toilet chamber described in previous studies () (Johnson et al. Citation2013; Aithinne et al. Citation2019). The test chamber room was 5 × 5 × 7 ft (1.52 × 1.52 × 2.13 m) in interior dimension, for a volume of 175 ft3 (5 m3). A clear plastic access door provided a view and an airtight enclosure. The test chamber was ventilated under slight positive pressure using a high-efficiency particulate air (HEPA)-filtered supply and powered HEPA-filtered exhaust after each trial. The effective ventilation rate was 18 air changes per hour (ACH) between tests, higher than most healthcare rooms but allowed for quicker contaminant purging. Toilet flush water was pre-filtered to avoid potential interference by naturally occurring particles that might be present in the mains water supply.
Figure 1. Experimental setup: (a) experimental chamber, (b) measurement of particle size distributions with and without the lid, and (c) visualization of the particle plumes and quantification of the contamination on the lid.
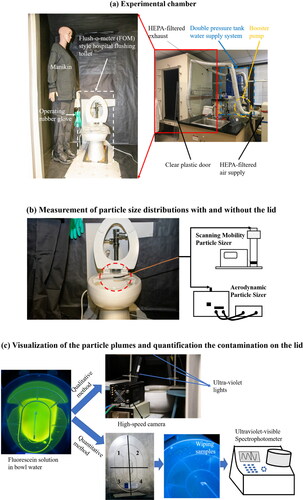
A hospital-type toilet (Model: K-96057-L-0, Kohler Co., Kohler, WI, USA), together with a 1.6 gallon per flush (GPF) FOM (Model: 6047.161.002, American Standard, Piscataway, NJ, USA), were used in this study. The two-tank water supply system () was used to provide 55 psi (379 kPa) water pressure to the FOM toilet for all flushing experiments in this study. An operating rubber glove was installed inside the chamber in order to operate the flush handle and inject fluorescein solution into the toilet bowl without disturbing the airflow inside the test chamber.
Measurement of particle size distributions
Particle size distributions were measured using a Scanning Mobility Particle Sizer (SMPS, model 3936, TSI Inc., Shoreview, MN, USA) and the Aerodynamic Particle Sizer (APS, model 3314, TSI Inc., Shoreview, MN, USA) 1 cm above the toilet bowl plane and centered over the bowl to measure the particle concentrations leaving the bowl plane (). In this study, a SMPS with a time resolution of 60 sec was used to measure the particle number concentration for mobility diameter from 0.016–0.593 µm (101 size bins), and an APS with a time resolution of 30 sec was used to measure the particle number concentration for aerodynamic diameter from 0.523–19.81 µm (51 size bins). Since the toilet flush particles are mainly filtered water, the number concentration was converted to surface area and mass concentration assuming spherical shape (shape factor of 1) and unit density (1 g/cm3), and the mobility diameter from SMPS and the aerodynamic diameter from APS are essentially equivalent. Measurements were collected triplicate, three with the lid and three without the lid. The temporary lid used in this study was a commercial Splashblocker (Splashblocker LLC, Newtown, PA, USA). The instruction for use from the official website were followed during the test. This engineering control, thus, was a detached, clear, and impervious toilet lid with a handle, which is placed on top of the ceramic toilet bowl before flushing the toilet. This physical barrier was intended to separate the person from the hazard and suppress splatter aerosol. According to a previous study, after flushing, the particle number concentration went back to baseline after 5 min (Knowlton et al. 2018). Therefore, in order to assess the particle concentration changes over time, each measurement lasted 5 min. The test chamber was ventilated (at 18 ACH) for more than 8 min between measurements to purge residual particles. The particle concentrations during the 3 min of purge ventilation before and after each flush served as the “baseline” particle concentrations.
Visualization of the particle plumes and quantification of the contamination on the lid
Fluorescein, a fluorescent indicator, was used as the contamination detection agent. The flushing-generated fluorescein particles were characterized qualitatively and quantitatively (). A 1% fluorescein solution was prepared using fluorescein powder (CAS-No. 2321-07-5, Sigma-Aldrich Inc., St. Louis, MO, USA). In each flush, 480 milliliter (mL) of the 1% fluorescein solution was mixed into 2300 mL of bowl water of the toilet. A high-speed camera (ORCA-Lightning Digital CMOS camera, Hamamatsu Photonics, Hamamatsu, Japan) was positioned in front of the toilet to record the generation of fluorescein particles during toilet flushing. The camera was set to record 250 frames per second with a resolution of 1024 × 1024 pixels. Each video started one second before the flushing and lasted 10 sec. Videos were used to qualitatively capture particle generation and flight trajectories.
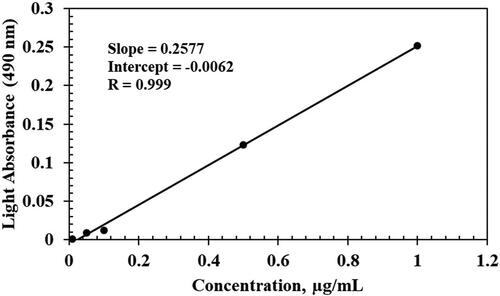
The lid was divided into quadrants as shown in . Wipe sampling was conducted on each quadrant of the lid and quantitatively analyzed for fluorescein concentration since only bowl water particles would contain this indicator. A wavelength scan was performed with dilute fluorescein solution to determine the maximum absorption peak at a wavelength of 490 nm using an ultraviolet-visible (UV-Vis) spectrophotometer (model 840-208100, Thermo Scientific, Waltham, MA, USA). A linear calibration curve was created on fluorescein concentrations of 0.01, 0.05, 0.1, 0.5, and 1.0 µg/mL; and a correlation coefficient (R) of 0.999, an intercept of −0.0062, and a slope of 0.2577 were obtained (). The procedures of collecting wipe samples on the lid are as follows. First, 300 µL distilled water was used to wet a Kimwipe (Kimtech Science, Kimberly-Clark, Irving, TX, USA), and then the wet Kimwipe was used to carefully wipe each quadrant of the lid. Wipes were then extracted in a 15 mL vial with 3 mL of distilled water, and they were mixed using a vortex mixer for 5 min. The extract solution was then transferred to UV-Vis Spectrophotometer cuvette. Fluorescein concentration was calculated using the created calibration curve.
Figure 2. Calibration curve for fluorescein using an ultraviolet-visible Spectrophotometer.
Normality of data was tested using the Shapiro–Wilk test. The data were then log-transformed to normalize the data. Parametric Two-Way ANOVA tests without replication were performed to determine whether the differences among testing flushes or among lid sections were significant. Parametric Two-Way ANOVA without replication was used to account for two factors, testing flushes and lid sections, with interrelation influence on the fluorescein concentration due to the limited nature of the study, as only limited flushes were performed. A type I error (or alpha) of 0.05 was used to determine the statistical significance in this study. All data manipulation, transfer and statistical tests were performed in Microsoft Excel.
Results and discussion
Concentration change over time with and without the lid
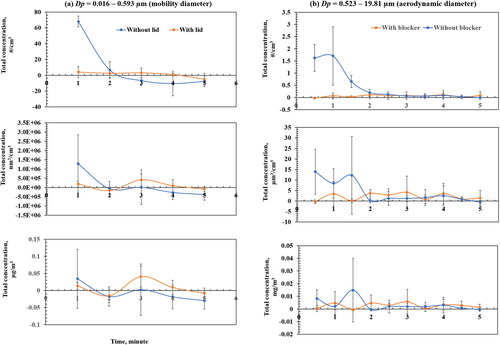
The main objective of this work was to evaluate the performance of a temporary lid for reducing toilet flush aerosol from a FOM type toilet. The particle concentration changes over time in three metrics (number, surface area and mass) are given in , indicating that the highest concentrations in all metrics without a lid occur in the first 90 sec, and are higher than when a lid was in place. However, the concentrations of particles sized from 0.016–0.593 µm measured by the SMPS with the lid used were slightly higher than without using the lid, showing the challenge of controlling the submicrometer particles (). The lid was more effective at reducing particles 0.523–19.81 µm measured by the APS (). In summary, for all size particles (0.016–19.81 µm with 152 size bins from both SMPS and APS), in the first 90 sec, the lid reduced 48% of the total number concentration, 76% of the total surface area concentration, and 66% of the total mass concentration.
Figure 3. Baseline corrected particle concentration change over time with and without a lid after flushing for (a) particle size from 0.016–0.593 µm (mobility diameter, and (b) particle size from 0.523–19.81 µm (aerodynamic diameter).
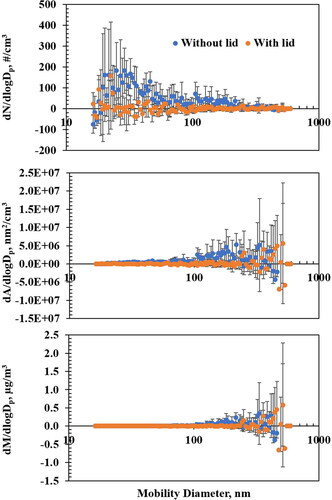
The particle size distributions (0.016–0.593 µm) measured by SMPS in three metrics during the first 60 sec are provided in , demonstrating that the lid is more effective in reducing the number (48% reduction) and surface area (42% reduction) concentration compared to the mass (19% reduction) concentration for these size particles.
Figure 4. Baseline corrected particle size distributions (0.016–0.593 µm) measured by Scanning Mobility Particle Sizer in three metrics (number, surface area, and mass) during the first 60 sec after flushing.
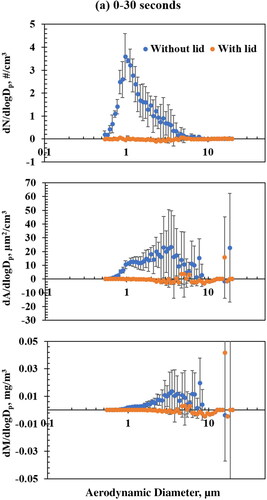
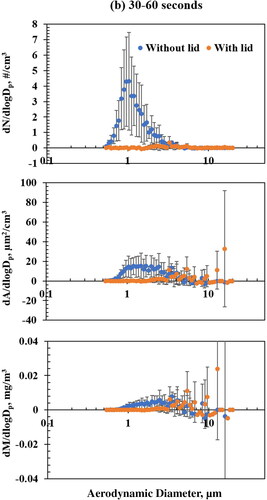
The particle size distributions (0.523–19.81 µm) measured by APS in three metrics during the first 90 sec are provided in . For 0–30 sec, the lid reduces 96% of the number concentration, 88% of the surface area concentration, and 77% of the mass concentration, respectively (). For 30–60 sec, the lid reduces 91% of number concentration and 47% of surface area concentration, but no reduction is measured for mass concentration (). For 60–90 sec, the lid reduces 84% of number concentration, 84% of surface area concentration, and 92% of mass concentration, respectively ().
Figure 5. Baseline corrected particle size distributions (0.523–19.81 µm) measured by Aerodynamic Particle Sizer in three metrics (number, surface area and mass) after flushing: (a) 0–30 sec, (b) 30–60 sec, and (c) 60–90 sec.

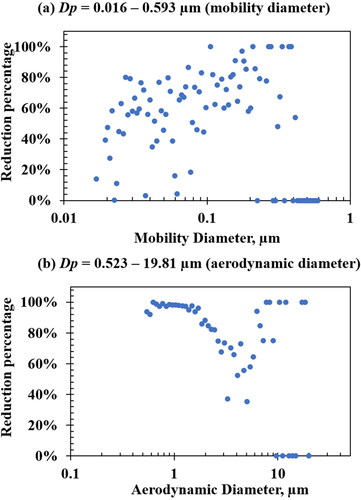
Overall, the particle reduction by size is given in , showing that, depending on particle size, the percentage of reduction ranged from 48–100% for particles larger than 0.1 µm.
Figure 6. Particle concentration reduction by size: (a) 0.016–0.593 µm measured by Scanning Mobility Particle Sizer and (b) 0.523–19.81 µm measured by Aerodynamic Particle Sizer.
Particle plume visualization and their contamination on the lid
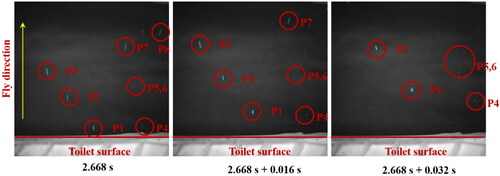
Three sequential images from the high-speed video are provided in , starting at 2.668 sec after flush initiation. Large droplet splatter was captured by the high-speed camera. The particle movement speeds and directions can be evaluated based on the distance and time. This information will be useful for future particle dynamic studies of the particle emissions from flushing toilet.
Figure 7. Large particle movement captured by the high-speed camera.
summarizes fluorescein concentrations deposited on the lid. In the three testing flushes, the fluorescein concentration in each section was 1.08 ± 1.05 µg/mL (section 1), 0.54 ± 0.38 µg/mL (section 2), 0.22 + 0.08 µg/mL (section 3), and 0.14 ± 0.05 µg/mL (section 4). The Shapiro–Wilk test indicated the log-normal distribution, and data was then log-transformed. Parametric Two-way ANOVA analysis without replication demonstrated that each lid section was contaminated by significantly different amounts of particles generated by flushing (p = 0.0146), and the front sections (1&2) had a much higher concentration compared to the back sections (3&4). Parametric Two-way ANOVA without replication analysis also found a significant difference among testing flushes (p = 0.0185), indicating that the particles generated by flushing were significantly different even the testing flushes occurred in a similar environment and condition in the test chamber.
Table 1. Fluorescein concentrations deposited on the lid.
Conclusions
This study successfully evaluated the performance of a temporary lid in reducing particles by size from flushing a FOM toilet by charactering the detailed particle size distributions in three metrics (number, surface area, and mass concentrations) over time with and without the lid in a controlled-environment chamber using state-of-the-art aerosol instrumentations. Although the particle reductions are different by particle sizes and metrics, the lid evaluated in this study can effectively reduce the particles generated by flushing a FOM toilet that does not have a lid, especially during the first 90 sec, when the highest particle concentrations occur after flushing. In doing so, it may reduce inhalation of particulates containing SARS-CoV-2 and other microorganisms or hazardous substances when they are present. The deposition of particles on the lid are significantly different across its surface, which should be sanitized after each use.
Future studies are still needed. For example, 2 min after flushing, the concentrations of particles from 0.016–0.593 µm with the lid in use resulted in slightly higher than without the lid, which might be due to the leak of small particles under the lid and needs to be further analyzed using real-time instruments. Although SMPS has many size bins, it does not measure every size bin at the same time, and the particle concentration is changing during the 1-min SMPS measurement. Therefore, a real-time instrument (such as photometer, condensation particle counter) measuring sub-micron particle sizes could better obtain the concentration change over time compared to the SMPS. In addition, the bowl water was not fed with bioaerosols (such as bacteria, viruses) that should be investigated in future as well.
Future research should also investigate the performance of the lid in a real bathroom (e.g., in the hospital). Other real-world variables not accounted for include movement of personnel in the bathroom and normal ventilation that can impact aerosol distribution. The surrogate (fluorescein) used in this study may not be predictive of feces/urine containing hazardous drugs or microbial agents. In addition, the videos captured by the high-speed camera are valuable of studying the dynamics of particles emitted from the flushing in the future.
Data availability
The laboratory data are available upon reasonable request to Dr. Changjie Cai and Dr. Yingtao Liu.
Additional information
Funding
References
- Aithinne KA, Cooper CW, Lynch RA, Johnson DL. 2019. Toilet plume aerosol generation rate and environmental contamination following bowl water inoculation with Clostridium difficile spores. Am J Infect Control. 47(5):515–520. doi:10.1016/j.ajic.2018.11.009
- Al-Benna S. 2021. Negative pressure rooms and COVID-19. J Perioper Pract. 31(1-2):18–23.
- Amirian ES. 2020. Potential fecal transmission of SARS-CoV-2: current evidence and implications for public health. Int J Infect Dis. 95:363–370. doi:10.1016/j.ijid.2020.04.057
- Asadi S, Bouvier N, Wexler AS, Ristenpart WD. 2020. The coronavirus pandemic and aerosols: does COVID-19 transmit via expiratory particles? Aerosol Sci Technol. 54(6):635–638. doi:10.1080/02786826.2020.1749229
- Best EL, Sandoe JAT, Wilcox MH. 2012. Potential for aerosolization of Clostridium difficile after flushing toilets: the role of toilet lids in reducing environmental contamination risk. J Hosp Infect. 80(1):1–5. doi:10.1016/j.jhin.2011.08.010
- Billings C, Cai C, Liu Y. 2021. Utilization of antibacterial nanoparticles in photocurable additive manufacturing of advanced composites for improved public health. Polymers. 13(16):2616. doi:10.3390/polym13162616
- Cascella M, Rajnik M, Aleem A, Dulebohn S, Di Napoli R. 2021. Features, evaluation, and treatment of coronavirus (COVID-19). StatPearls.
- Chen Y, Chen L, Deng Q, Zhang G, Wu K, Ni L, Yang Y, Liu B, Wang W, Wei C, et al. 2020. The presence of SARS-CoV-2 RNA in the feces of COVID-19 patients. J Med Virol. 92(7):833–840. doi:10.1002/jmv.25825
- Crul M, Hilhorst S, Breukels O, Bouman-d'Onofrio J, Stubbs P, van Rooij J. 2020. Occupational exposure of pharmacy technicians and cleaning staff to cytotoxic drugs in Dutch hospitals. J Occup Environ Hyg. 17(7-8):343–352.
- Dancer SJ, Li Y, Hart A, Tang JW, Jones DL. 2021. What is the risk of acquiring SARS-CoV-2 from the use of public toilets? Sci Total Environ. 792:148341. doi:10.1016/j.scitotenv.2021.148341
- Eisenberg M, McCourt A, Stuart E, Rutkow L, Tormohlen K, Fingerhood M, Quintero L, White S, McGinty EE. 2021. Studying how state health services delivery policies can mitigate the effects of disasters on drug addiction treatment and overdose: protocol for a mixed-methods study. PLoS One. 16(12):e0261115. doi:10.1371/journal.pone.0261115
- Esteban Florez FL, Thibodeau T, Oni T, Floyd E, Khajotia SS, Cai C. 2021. Size-resolved spatial distribution analysis of aerosols with or without the utilization of a novel aerosol containment device in dental settings. Phys Fluids. 33(8):085102. doi:10.1063/5.0056229
- Foladori P, Cutrupi F, Segata N, Manara S, Pinto F, Malpei F, Bruni L, La Rosa G. 2020. SARS-CoV-2 from faeces to wastewater treatment: what do we know? A review. Sci Total Environ. 743:140444. doi:10.1016/j.scitotenv.2020.140444
- Hindson J. 2020. COVID-19: faecal-oral transmission? Nat Rev Gastroenterol Hepatol. 17(5):259–259. doi:10.1038/s41575-020-0295-7
- Johnson D, Lynch R, Marshall C, Mead K, Hirst D. 2013. Aerosol generation by modern flush toilets. Aerosol Sci Technol. 47(9):1047–1057. doi:10.1080/02786826.2013.814911
- Kim J-M, Chung Y-S, Jo HJ, Lee N-J, Kim MS, Woo SH, Park S, Kim JW, Kim HM, Han M-G. 2020. Identification of coronavirus isolated from a patient in Korea with COVID-19. Osong Public Health Res Perspect. 11(1):3–7.
- Knowlton SD, Boles CL, Perencevich EN, Diekema DJ, Nonnenmann MW, CDC Epicenters Program. 2018. Bioaerosol concentrations generated from toilet flushing in a hospital-based patient care setting. Antimicrob Resist Infect Control. 7(1):1–8. doi:10.1186/s13756-018-0301-9
- Kromhout H, Hoek F, Uitterhoeve R, Huijbers R, Overmars RF, Anzion R, Vermeulen R. 2000. Postulating a dermal pathway for exposure to anti-neoplastic drugs among hospital workers. Ann Occup Hyg. 44(7):551–560. doi:10.1016/S0003-4878(00)00050-8
- Liu Y, Ning Z, Chen Y, Guo M, Liu Y, Gali NK, Sun L, Duan Y, Cai J, Westerdahl D, et al. 2020. Aerodynamic analysis of SARS-CoV-2 in two Wuhan hospitals. Nature. 582(7813):557–560.
- Matsuyama S, Nao N, Shirato K, Kawase M, Saito S, Takayama I, Nagata N, Sekizuka T, Katoh H, Kato F, et al. 2020. Enhanced isolation of SARS-CoV-2 by TMPRSS2-expressing cells. Proc Natl Acad Sci USA. 117(13):7001–7003. doi:10.1073/pnas.2002589117
- McDermott CV, Alicic RZ, Harden N, Cox EJ, Scanlan JM. 2020. Put a lid on it: are faecal bio-aerosols a route of transmission for SARS-CoV-2? J Hosp Infect. 105(3):397–398. doi:10.1016/j.jhin.2020.04.024
- Möhlenkamp S, Thiele H. 2020. Ventilation of COVID-19 patients in intensive care units. Herz. 45(4):329–331. doi:10.1007/s00059-020-04923-1
- National Institute for Occupational Safety and Health (NIOSH). 2015. Hierarchy of controls; [accessed 2022 Feb 10]. https://www.cdc.gov/niosh/topics/hierarchy/.
- Newsom SWB. 1972. Microbiology of hospital toilets. Lancet. 300(7779):700–703. doi:10.1016/S0140-6736(72)92102-2
- Opfermann J, Dayal A, Abo A, Thatcher E, Salvador T, Eskandanian K, McLeese R, Cleary K. 2021. Innovation at a children’s hospital: personal protective equipment efforts during the pandemic. Surg Innov. 28(2):189–197. doi:10.1177/1553350621999982
- Park S-k, Lee C-W, Park D-I, Woo H-Y, Cheong HS, Shin HC, Ahn K, Kwon M-J, Joo E-J. 2021. Detection of SARS-CoV-2 in fecal samples from patients with asymptomatic and mild COVID-19 in Korea. Clin Gastroenterol Hepatol. 19(7):1387–1394. doi:10.1016/j.cgh.2020.06.005
- Schreck JH, Lashaki MJ, Hashemi J, Dhanak M, Verma S. 2021. Aerosol generation in public restrooms. Phys Fluids. 33(3):033320. doi:10.1063/5.0040310
- van Doremalen N, Bushmaker T, Morris D, Holbrook M, Gamble A, Williamson B, Tamin A, Harcourt J, Thornburg N, Gerber S, et al. 2020. Aerosol and surface stability of SARS-CoV-2 as compared with SARS-CoV-1. N Engl J Med. 382(16):1564–1567. doi:10.1056/NEJMc2004973
- Wang J, Du G. 2020. COVID-19 may transmit through aerosol. Irish J Med Sci. 189(4):1143–1144.
- Wang W, Xu Y, Gao R, Lu R, Han K, Wu G, Tan W. 2020. Detection of SARS-CoV-2 in different types of clinical specimens. Jama. 323(18):1843–1844. doi:10.1001/jama.2020.3786
- Wilson G, Jackson V, Boyken L, Schweizer M, Diekema D, Petersen C, Breheny P, Nonnenmann M, Perencevich E, CDC Prevention Epicenter Program. 2020. Bioaerosols generated from toilet flushing in rooms of patients with Clostridioides difficile infection. Infect Control Hosp Epidemiol. 41(5):517–521. doi:10.1017/ice.2020.11
