
Abstract
This research investigated the impact of sensor camera misalignment on the quality of the lane keeping assistance, end user experience and driving performance. Testing was performed with 16 participants, both males and females, with an age range from 25 to 35. The Lane Keeping Assist System (LKAS) errors in lateral offset ranged from −0.66 m to 0.66 m and testing was performed on two roads. The results indicated that introducing an error in the LKAS system of 0.66 m caused the mean lane position of the vehicle to move in a similar direction by 0.1 m while some individuals showed as much as a 0.2 m change in their lateral position. Increases in error in the camera misalignment also increased the number of steering reversals indicating that the drivers worked harder to stay in their lane.
Introduction
A Lane Keeping Assist System (LKAS) is made up of a camera, an Electronic Control Unit (ECU), and an Electric Power Assist Steering system (EPAS). The camera is used to detect lane markers and the ECU then calculates the vehicle’s position and orientation in the lane based on the camera information. A path is then calculated to return the vehicle to a desired lane lateral position in finite time. In modern cars, cameras for LKAS are mounted on windscreens, and when the windscreen is replaced the camera must be moved to the new windscreen. The reinstallation may cause the camera to be misplaced, causing the malfunction of some systems relying on it (e.g. LKAS). While LKAS manufacturers provide installation instructions and calibration procedures, the Insurance Institute for Highway Safety (IIHS) found risks associated with camera misalignment and/or uncalibrated cameras are affecting LKAS nevertheless (Huetter, Citation2018). However, the real magnitude of such risks has never been studied. This research investigated the impact of camera misalignment on the quality of the LKAS and the end user experience and performance in the vehicle.
Literature review
Prior to the deployment of LKAS in production vehicles, manufacturers introduced Lane Departure Warning Systems (LDWS). LDWS warn the driver of an imminent lane departure and expect the driver to take appropriate action. This is quite different than a LKAS, which is a form of shared haptic control where the system actively controls the steering system to reduce the lane departure rate. There has been extensive research into the use of LDWS and the systems are quite often turned off (Reagan & McCartt, Citation2016). This is assumed to be due to nuisance and false alarms. Similar findings have been recorded for LKAS (Eichelberger & McCartt, Citation2016) where drivers have displayed low interest in the technology. Because LKAS is a form of shared haptic control, fighting between the driver and lane departure can lead to oscillations and poor lane tracking performance (Katzourakis et al., Citation2011). Mulder et al. (Citation2012) compared an LKAS to manual steering and found LKAS reduced Standard Deviation of Lane Position (SDLP) and Steering Wheel Reversal Rate while increasing minimum Time to Line Crossing (TLC). Some researchers have investigated full Lane Keeping Systems (LKS), which, opposed to a LKAS, provides enough torque to steer without any driver intervention. Miller et al. (Citation2019) conducted an experiment to investigate what happens when the LKS functions stop with a resulting transition from automated driving to manual driving. They found that drivers had an increased SDLP and decreased mean Time to Collision (TTC) after system withdrawal. Alsaid et al. (Citation2020) investigated drivers’ vicarious steering behavior (steering behavior before transitions) when the automated system is fully engaged. They evaluated the relationship between vicarious steering and the quality of transitions. They found an increase in SDLP after transition to manual control as vicarious steering increased.
While the literature on LKAS is limited, the literature on LDWS is more extensive. LDWS also uses cameras to calculate the vehicle lane position but typically use auditory rather than haptic feedback to warn the driver. Therefore changes in driver performance due to errors in the LKAS may follow similar patterns to those for LDWS degradation. The influence of LDWS reliability on acceptance has been studied by Navarro et al. (Citation2017) in which reliable LDWS was found to improve the driver’s steering behavior with more effective recovery maneuvers to lane departures. However, late or missing warnings caused the driver to perform similarly to having no warning. In addition, the human factors of LDWS has been studied by Edwards et al. (Citation2015), where the presence of an LDWS led to shorter duration of Run off Road (ROR) events and a decrease in Total Time out of Lane (TTL) as well as a decrease in Maximum Lane Deviation (MLD). Souders et al. (Citation2020) found that LDWS were effective for older drivers. Hu et al. (Citation2017) investigated drivers’ behavior in unintentional lane departure to assist in the design of LDWS to reduce false alarms. Faizan et al. (Citation2019) found that LDWS performance was improved by using GPS information rather than a camera based system.
While investigating the effects of haptic shared control in tele-manipulated task execution, Van Oosterhout et al. (Citation2015) found that guidance inaccuracies may degrade task execution. Although relevant, the validity of this finding with LKAS remains arguable since the control task is quite different. In addition, drivers will need to cope with tasks other than lane-keeping and whether they will have the capacity to spot the inaccurate guidance warrants further investigation.
Therefore, with the absence of prior research in this area, Petermeijer et al. (Citation2015), the goal of this study is to determine the impact of lane keeping accuracy in a shared control LKAS on driver acceptance and behavior. The range of potential position and orientation errors in lane keeping has also not been researched extensively in the literature (Fritsch et al., Citation2013). Therefore, for this study a range of lane offsets from −0.66 m to 0.66 m will be used which corresponds to the maximum offset errors observed in recent testing by the Insurance Institute for Highway Safety (IIHS), given in , for a camera misalignment of 0.4 degrees to the left and 0.6 degrees to the right (Huetter, Citation2018).
Table 1. Lane departure alignment testing IIHS (Huetter, Citation2018).
Experiment
The experiment used the University of Leeds Driving Simulator (UoLDS). UoLDS includes a large excursion motion base of 5 meters both longitudinally and laterally that ensures the appropriate kinesthetic feedback is experienced by drivers while studying changes in the LKAS. This presentation of real-world-like motion-cues ensures that the participants are able to correctly control their lateral position on the road as well as track their desired speed (de Winter et al., Citation2012).
Participants
The study included 16 participants, 5 females and 11 males, between 25 and 35 years of age who had been living and driving in the UK for at least two years with a driving experience greater than 7000 miles per year. Of the participants, 56% had access to a cruise control system while 19% had access to either a LDWS or LKAS.
Participants were paid for their participation and their data was anonymised. The participants were asked to stay as close as possible to the center of the lane while driving, try to respect the speed limits and drive as they would normally in a real driving situation. An ethics application was made for the project to the Research Ethics committee and received approval on 25/04/2018. The application number was AREA 17-113.
LKAS
The University of Leeds Driving Simulator (UoLDS) already has an electric motor installed on the steering wheel that can provide steering wheel torque control. The simulator can also exactly calculate the position and orientation of the vehicle in the virtual lane. The LKAS algorithm used draws heavily from Brandt et al. (Citation2007) which in turn was used by Mulder et al. (Citation2008). A point in the center of the lane (or offset in the case of errors in the lateral offset) is calculated one second ahead of the vehicle. This point is designated the guide point for the vehicle. A pursuit tracking algorithm is used to calculate the required steering angle to pass through this point (Snider, Citation2009). A torque on the steering wheel was generated based on the difference between the actual steering angle and the required steering angle to guide the vehicle toward the center of the lane. The gain was 0.65 Nm/rad at the hand wheel, and the torque was limited to 3.5 Nm for safety and drivability reasons. Similar to Mulder et al. (Citation2008), the system’s force feedback was tuned to provide torques that are large enough to be helpful to the driver, but not large enough to allow automatic steering. Therefore, according to the SAE Level 1 definition (SAE, 2018), the LKAS was not providing sufficient torque to constitute a LKS. The LKAS was engaged at all times and drivers were asked to control the vehicle at all times and received nothing more than guidance, which they could always override.
Scenario
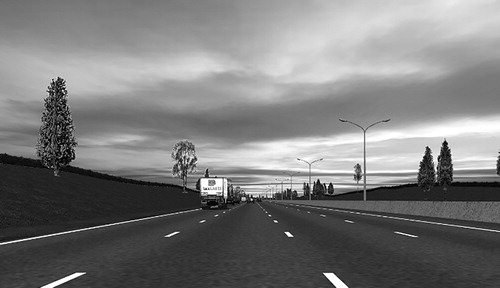
A variety of literature was reviewed to determine what might be the best scenarios to use to test the system (Blaschke et al., Citation2009; Breyer et al., Citation2010; De Nijs et al., Citation2014; Mulder et al., Citation2008; Stanley, Citation2006). Stanley (Citation2006) was researching lane departure warnings while the rest of the experiments were evaluating LKAS (i.e. shared haptic control). The scenarios used previously were as follows: distractor tasks, wind gusts, reduced visibility and curvy roads. Here distractor tasks were eliminated so that the research would focus on the behavior of alert drivers. In addition, reduced visibility was eliminated to maintain the widest transferability to the real world (a focus only on reduced visibility is not ideal). This left scenarios based on wind gusts and curvy roads. A curvy rural road with a single lane in each direction was chosen as one test condition (Road B in ); in addition a simple three lane motorway with some curves was chosen (Road C in ). To the motorway a section of wind gusts and a section of curvy narrow lanes in a work zone were added to increase the difficulty in specific short sections. The wind gust occurred over a length of 100 m and was featured twice, and the narrow work zone was 2 km long and also featured twice. Finally a baseline four lane motorway with very limited curves was used for training and as a post-test to look at longitudinal changes in driving across the experiment (Road A in ).
Figure 1. Scenario of Road B.

Figure 2. Scenario of Road C.
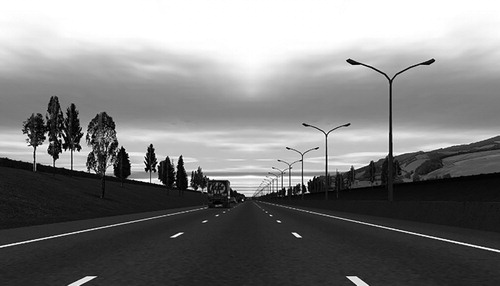
Figure 3. Scenario of Road A.
Based on the IIHS work (Huetter, Citation2018) four alignment errors were chosen for offsetting the guide point. These were designated error levels 0 − 3 with an error amount of: 0.0 m (as level 0), −0.33 m (as level 1), 0.66 m (as level 2) and −0.66 m (as level 3). For a negative error the guide point was placed to the left of the lane center line (level 1 for a small error and level 3 for a large error) and for a positive error the guide point was place to the right of the center line of the lane (level 2). For Road C, the three lane motorway, only the large errors to the left and right were tested. For Road B, the curvy two lane road, an additional smaller offset to the left in the direction of the road edge was tested since this was felt to be the most sensitive road and error direction. The study was a within subjects design and additional error levels could not be assessed given the maximum time spent in the simulator was to be limited to 3 hours.
Experimental procedure
To increase the power of the experiment, and to reduce the effect of individual differences, a within-subject design was used whereby all participants experienced all of the roads and sensor misalignment errors. During the experiment, the participants were free to change speed as they wished since this may represent a good indicator of the perceived workload level, which is expected to vary according to the different difficulty levels. However the participants were asked on the motorways (Roads A and C) to stay in the second lane from the left and to not change lanes. Before the experiment, each participant received a document that explained the procedure and was required to sign a consent form and complete a pre-experiment questionnaire. Each participant then drove on Road A with the LKAS active with no error for approximately 15 minutes as a practice drive. Within this training session they familiarized themselves with the driving simulator and were accompanied by a researcher. After this training session, the drivers participated in the actual trials that consisted of seven 15 minute drives at increasing levels of LKAS error. In the experiment, errors were increased over time rather than counterbalanced. It was felt that this would be more like the real world situation in which the performance of a system may steadily degrade and would give the opportunity to the drivers to increase their steering effort overtime to compensate for increases in error. It was felt that this would most appropriately capture the impact of increased error levels providing a more robust estimate of changes in driving behavior. In addition, it is expected that driver’s performance without changes in error will improve over the course of the experiment while the introduction of errors in the LKAS are expected to decrease the driver’s performance. Therefore it was assumed that a design with increasing error would be the best approach to address carryover effects. The drivers then performed a final drive on Road A once again with no error in the LKAS. This final drive was collected to evaluate any longitudinal changes in performance over the course of the experiment and confirm that driver performance did improve. After the final drive, a post-experiment questionnaire was completed. The experiment was counter-balanced by the road type driven. above gives the two possible orders that a participant could experience. The first letter is the road type and the second number is the error level. After each trial drive, a workload and trust/comfort rating was collected.
Table 2. Counter balanced order of trials.
The independent variables were:
Gender: male, female
Road curvature: curve, straight
Road type: A, B, C
Sensor misalignment: 0, 1, 2, 3
After each trial, the subjective dependent measures include a workload measurement between 1 and 10 (“When prompted please provide a workload rating between 1 and 10 representing low (1-3), medium (5-6) and high (8-10) workload”), expected to increase with poorer lane keeping assist and a comfort or trust measurement (“When prompted please provide a rating of comfort between 1 and 10 with a 1 (Very Comfortable) to 10 (Very Uncomfortable)”), expected to increase with poorer lane keeping assist. The rating scales were built based on scales used in previous research on workload (Teh, Citation2014; Teh et al., Citation2014) and trust (Schwarz et al., Citation2016).
Results
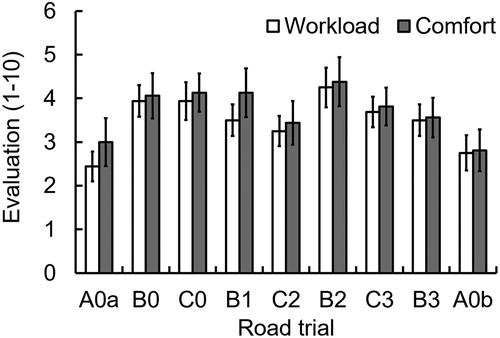
Data were analyzed with SPSS V.24 (IBM, Armonk, New York, USA). An α-value of 0.05 was used as the criterion for statistical significance. Error bars in all figures represent Standard Error. The intertrial workload and comfort/trust measures are given in . Paired sample t-tests found no significant difference between practice A0 and final A0 for perceived workload or perceived comfort or between error levels on Road B or Road C.
Figure 4. Workload and comfort measurements.
Objective data
Based on the metrics highlighted in the literature review that were found to be useful in studying similar systems, the following dependent variables were evaluated:
MSP: Mean longitudinal speed (m/s)
MLP: Mean lane position (m)
SDLP: Standard deviation of lane position (m)
SR1: Steering reversal rate 1 degree
SR3: Steering reversal rate 3 degrees
SR5: Steering reversal rate 5 degrees
TLC: Fraction of time that TLC (time to line crossing) is below 3.5 seconds
Initially Total Time out of Lane and Percentage eyes on Road Center were also considered but they were not found to be effective measures to evaluate lateral offset errors. The steering reversals were calculated using the amplitude method for the three magnitudes of 1, 3 and 5 degrees as recommended in SAE J2944 (Citation2015). The time series data was collected over the entire run and divided into curve and straight sections for analysis. An early set of ANOVAs were performed on several of the objective data with gender as one of the independent variables. No gender differences were found and therefore all further analyses collapsed the male and female data together. The first analysis is a pair-wise comparison between the A0 (practice) and A0 (end). These analyses were performed to see if there were any longitudinal or repeated measures effect over the trials. If there are longitudinal effects, then these need to be taken into account when drawing conclusions from the data since there were increasing levels of LKAS error across the experiment as given in . This is followed by an analysis of the impact of camera alignment error on each dependent variable for Road B and C separately.
Pair-wise comparisons
For each objective dependent variable a pairwise t-test was performed to compare A0 (practice) & A0 (end), as given in , for both Straight and Curved sections of Road A (four lane motorway with limited curves). Only significant longitudinal effects are presented below.
(1) MLP: Mean lane position (m)
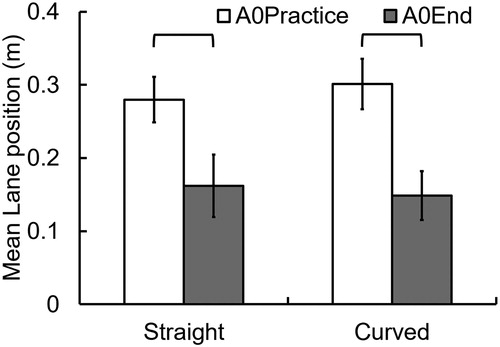
Mean lane position was significantly greater in A0Practice than in A0End for both straight and curved road sections (). (Straight t(15)= 3.01, p= 0.009 [mean diff= 0.118, Cohen’s d= 0.898] and Curved t(15)= 4.19, p= 0.001 [mean diff= 0.152, Cohen’s d= 0.997])
Figure 5. Repeated measures effect on mean lane position.
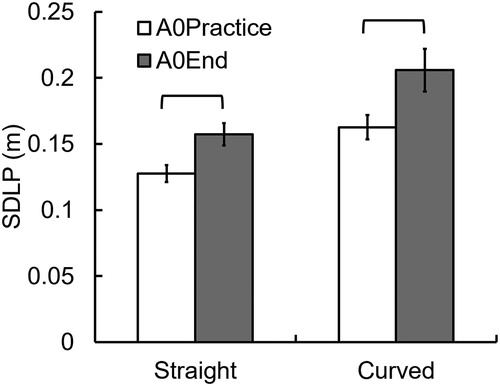
Standard deviation of lane position was significantly greater in A0End than in A0Practive for both straight and curved road sections (). (Straight t(15)= -3.08, p= 0.008 [mean diff= -0.0298, Cohen’s d= 0.952] and Curved t(15)= -2.35, p= 0.033, [mean diff= -0.0432, Cohen’s d= 0.831])
Figure 6. Repeated measures effect on standard deviation of lane position.
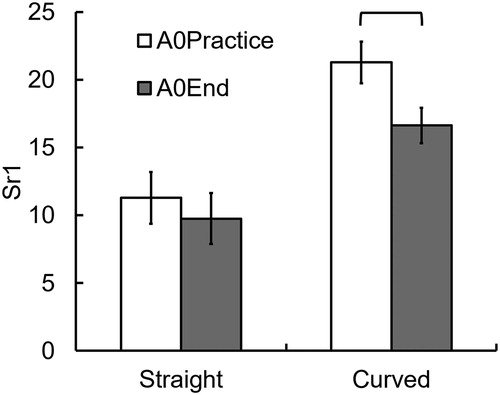
(2) SR1: Steering reversal rate 1 degree
SR1 was significantly greater in A0Practice than in A0End only in curved road sections (). (Curved – t(15)= 2.63, p= 0.019, [mean diff= 4.645, Cohen’s d= 0.720])
Figure 7. Repeated measures effect on steering reversals.
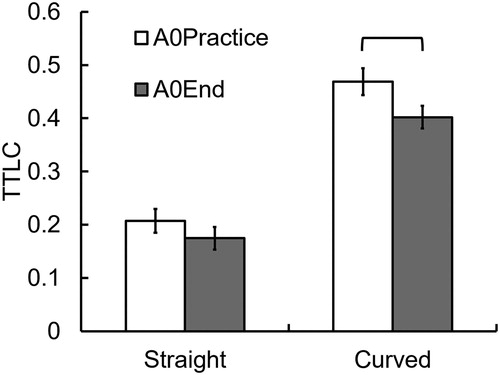
(3) TLC: Time to line crossing (Fraction of time below 3.5s)
The Time to line crossing fraction was significantly larger in A0Practice trials vs. A0End for curved roads (). (Curved t(15)= 2.86, p= 0.012 [mean diff= 0.0666, Cohen’s d= 0.783])
Figure 8. Repeated measures effect on TLC fraction below 3.5 s.
Road B and road C comparisons
Since the driving performance comparison between motorways and rural roads was not of specific interest in this study, each road was analyzed separately.
A within-subjects ANOVA was performed on each of the independent variables. The ANOVA for Road B (curvy rural road) had four levels of error (B0, B1, B2, B3) and two curvatures (straight, curved). The ANOVA for Road C (three lane motorway with curves, wind gusts and narrow lanes) had three levels of error (C0, C2, C3) and two curvatures (straight, curved). Follow up tests were only performed on error level since this is of primary interest and the blend of curved and straight road types was similar to the real world.
summarizes the statistical results. There were significant interaction effects between curvature and error level in Road B for MLP, SR3 and SR5. There were no significant interaction effects between curvature and error level in Road C. Follow up or post hoc test results are explained further in the text.
Table 3. (1). Summary of statistics.
Table 3. (2). Summary of statistics.
In evaluating the results one should keep in mind the sensor error levels. There were four error levels with an error amount as follows: 3: −0.66 m, 1: −0.33 m, 0: 0.0 m and 2: 0.66 m. For a negative error the guide point was placed to the left of the center line and for a positive error the guide point was place to the right of the center line of the lane.
MSP: Mean speed (m/s)
The mean speed was expected to decrease with increases in error. There was no significant change between the beginning and the end of the experiment, but the results showed that drivers drove faster when the error was to the right of center line when compared to no error or to a small negative error (B1). Since the order of testing was fixed it could be that the no error condition (B0 and C0) was driven slower than it otherwise would have been as the participants became more comfortable with the course however B1 was also at a lower speed, in addition while not significant both B3 and C3 showed a reduction in speed compared to B2 and C2. Higher speeds when the error is to the right could indicate that the drivers were more comfortable when driving to the right in the lane. Pairwise comparisons (corrected with Bonferroni) found mean speed was significantly greater () on
Figure 9. Impact of sensor error on mean speed.
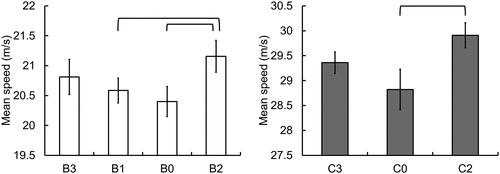
B2 compared to B0, p = 0.0041, [mean difference= -0.755 Effect size= 0.726] & B1, p= 0.0032, [mean diff= 0.570, effect size= 0.594]
C2 compared to C0, p= 0.017 [mean diff= 1.089, effect size= 0.806]
MLP: Mean lane position (m)
The mean lane position was expected to move to match the error. There was a significant decrease in lane position after the trials (A0 End) that might have been a learning effect. The mean lane position did move to match the error with the zero error offset being slightly to the right. Pairwise comparisons (corrected with Bonferroni) found mean lateral position was significantly greater () on
Figure 10. Impact of sensor error on mean lane position.
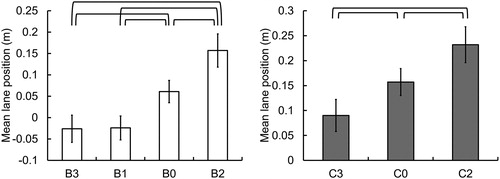
B0 compared to B1, p< 0.001, [mean diff= 0.085, effect size= 0.796] & B3, p= 0.003, [mean diff= 0.087, effect size= 0.742]
B2 compared to B0, p= 0.005, [mean diff= 0.096, effect size= 0.728], B1 roads, p< 0.001, [mean diff= 0.181, effect size= 1.345], & B3 roads, p< 0.001. [mean diff= 0.183, effect size= 1.279]
C0 compared to C3, p= 0.0231, [mean diff= 0.067, effect size= 0.577]
C2 compared to C0, p= 0.0362 [mean diff= 0.075, effect size= 0.595] & C3, p< 0.0013. [mean diff= 0.143, effect size= 1.045].
SDLP: Standard deviation of lane position (m)
The standard deviation of lane position was expected to increase with increases in error. There was an overall increase in SDLP between the practice and the final run. In addition, there was an overall increase in SDLP with increasing error level. Because of the significant difference in SDLP for curves and straights (a main effect), it is important to compare this independently. Reviewing the results, the percentage of SDLP increase for different error levels is similar to the increase from practice to final run. Therefore it is difficult to confirm that the SDLP increase is due to error, although it could also be a long term effect of error exposure or changes in driver effort. Pairwise comparisons across both curves and straights (corrected with Bonferroni) found standard deviation of lane position was significantly greater () for
Figure 11. Impact of sensor error on standard deviation of lane position.
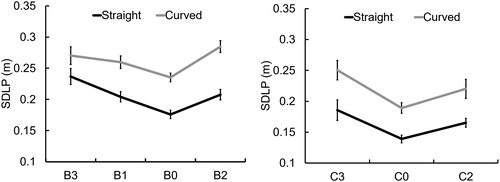
B1 compared to B0, p= 0.0411 [mean diff= 0.026, effect size= 0.950]
B2 compared to B0, p= 0.0012 [mean diff= 0.041, effect size= 1.554]
B3 compared to B0, p= 0.0123 [mean diff= 0.048, effect size= 1.211] & B1, p= 0.0344 [mean diff= 0.022, effect size= 0.491]
C2 compared to C0, p= 0.0061, [mean diff= 0.029, effect size= 0.908]
C3 compared to C0, p= 0.0032. [mean diff= 0.054, effect size= 1.184]
SR1: Steering reversal rate 1 degree
The discussion will focus on the 1 degree rate, since this showed changes across all the events. What magnitude and therefore frequency to analyze in Steering Wheel Reversal Rate is dependent on the task where SR3 and SR5, given in , only captured changes in Road B (which did matched the pattern for SR1). For Steering Wheel Reversal Rate the hypothesis was that there would be an increase for an increase in error. There was a difference in before and after with a reduction in steering reversals in curves only. On Road C there was an increase in Steering Wheel Reversal Rate with increase in error. On Road B the picture was more complex with increases seeming to only occur for errors to the right. Pairwise comparisons (corrected with Bonferroni) found SR1 to be significantly greater () for
Figure 12. Impact of sensor error on steering reversals 1.
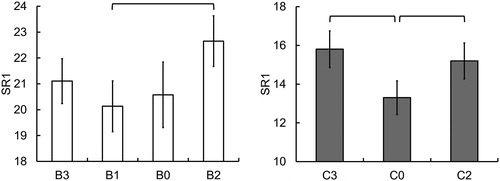
B2 compared to B1, p = 0.001, [mean diff= 2.52, effect size= 0.642]
C2 compared to C0, p= 0.0061, [mean diff= 1.894, effect size= 0.525]
C3 compared to C0, p = 0.0132. [mean diff= 2.50, effect size = 0.687]
TLC: Time to line crossing
For TLC the hypothesis was that the fraction of time TLC was below 3.5 seconds would increase with increases in error. There was a significant decrease in the fraction for curved roads after the trials (A0 End) which might have been a learning effect. The fraction of time that TLC was below 3.5 seconds did increase for each error condition as expected. Pairwise comparisons (corrected with Bonferroni) found Time to Line Crossing to be significantly greater () for
Figure 13. Impact of sensor error on time to line crossing fraction below 3.5 seconds.
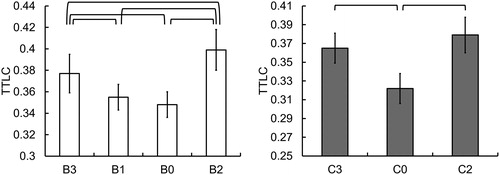
B2 > B0: p< 0.001 [mean diff= 0.051, effect size= 0.802]
B2 > B1: p< 0.001 [mean diff= 0.044, effect size= 0.692]
B2 > B3: p= 0.01 [mean diff= 0.022, effect size= 0.297]
B3 > B0: p= 0.028 [mean diff= 0.029, effect size= 0.474]
B3 > B1: p= 0.011 [mean diff= 0.022, effect size = 0.360]
C3 compared to C0, p= 0.004, [mean diff= 0.042, effect size= 0.672]
C2 compared to C0, p< 0.001 [mean diff= 0.057, effect size= 0.811]
Discussion
As presented at the beginning of the Objective Data section, the Total Time out of Lane was not found to be a useful metric. It was not possible to easily apply this and similar metrics from the LDWS literature because the task in this experiment proved to be more continuous than a typical LDWS study in which explicit road departures were typically generated for all the participants. For MSP, expected to decrease with poorer lane keeping assist, it was found that drivers drove faster when the error was to the right of center line when compared to no error or a small negative error. This is in line with a satisficing behavior for which higher speeds are observed when driving further away from a risk such as the road edge (Wei et al., Citation2019), however while not significant the large error offset to the left also produced higher speeds. Further study of this phenomena may be beneficial especially in terms of designing shared haptic control systems. Average lateral lane position did move to match the error condition as expected while standard deviation of lane position (SDLP) did increase with poorer lane keeping assist but conclusions are difficult to be drawn from this because of a longitudinal effect during the experiment. The steering wheel reversal rate did increase with poorer lane keeping assist as expected. Finally, the TLC fraction of time below 3.5 seconds increased for the higher error conditions as expected. In agreement with our findings, Mulder et al. (Citation2012) found that a capable LKAS system reduced SDLP, reduced steering wheel reversals and increased TLC when compared to manual driving. These findings are similar to other LKAS introduction studies (Petermeijer et al., Citation2015). In the current study, it was expected that an LKAS system with errors would produce performance more like manual driving which was confirmed.
To assess the magnitude of change of SDLP and TLC produced by the current study, the Advisors Project: (Action for advanced Driver assistance and Vehicle control systems Implementation, Standardization, Optimum use of the Road network and Safety) was used for comparison. The goal of the Advisors Project was to develop a common assessment methodology for advanced driver assistance systems. The project defined a “Straddle Lanes” error as a pattern of weaving within a lane. This weaving was characterized by an increase in lateral deviation (Wiethoff, Citation2003) defined as SDLP over 0.25 m and Median TLC less than 3 to 4 seconds as two of the criteria. In the current experiment at the highest levels of camera misalignment and the associated system error with the driver in control, the SDLP is 0.25 m and the median TLC is just below the criterion that Wiethoff defines as the edge of driver impairment. Steering reversals also increased which is similar to an increase in Steering SD, which was also part of the “Straddle Lanes” criteria. This suggests that maximum camera alignment errors as measured by IIHS would be considered “Straddle Lanes” errors using this criteria.
While 19% of the participants had access to either a LDWS or LKAS in their own vehicles, this was not accounted for in anyway in the analysis. The errors in the LKAS were introduced in an increasing way in an effort to assist the user in gradually understanding the LKAS and the impacts of increasing errors.
Finally, it was expected that subjectively reported workload would increase with increasing error. While not significant, reviewing both workload increased and comfort decreased when moving from the simplest Road A to Road B and C. Once back on Road A, the comfort and workload returned to their original levels. Since Steering Wheel Reversal Rate did increase with increasing errors, actual workload probably also increased but was not captured in the subjective responses. It is probably the case that the road type had more impact on the reported values than the errors in the LKAS, which are less salient.
A few study limitations should be noted. Due to the limited time in the simulator, only a few scenarios and one steering configuration could be evaluated. Testing additional LKAS error offsets in the future could help to explore the differences in driver behavior between errors to the right and left. The two roads used may not be the worst case scenario for the LKAS system errors. Additional scenarios should be explored in the future including different geometry, weather, and visibility. Only a single LKAS controller gain was used. This torque gain was chosen to provide a helpful torque but not allow automatic steering. Higher torque gains may yield different responses from the driver. Finally, testing groups of drivers based on age and experience may yield additional insights into the impact of LKAS system errors.
Conclusion
An experiment was run in a driving simulator with human participants to evaluate the effect of camera installation errors that cause lateral offset errors in LKAS. Testing was performed with 16 participants with a mix of males and females in a range of ages from 25 to 35. The LKAS errors in lateral offset ranged from −0.66 m to 0.66 m and testing was performed on two roads: one was a three lane motorway and the second was a dual carriage way. The results indicated that introducing an error in the LKAS caused the mean lane position of the vehicle to move in a similar direction as the error although by less than the error introduced by the system. Increases in LKAS error also increased the number of steering reversals and increased the amount of time that the vehicle’s time to line crossing was below 3.5 s. The conclusion is that the drivers are fighting with the system to maintain a lane offset that is less than the LKAS’s desired offset and this leads to an increase in steering reversals with its accompanying increase in workload for the driver. The fact that the driver does not reduce the lane offset completely may indicate some satisficing on the part of the driver. The changes in Time to Line Crossing indicate a reduction in the safety value of the LKAS. These impacts from LKAS errors, especially the decrease in safety value and increase in steering reversals warrants further research and testing. If LKAS safety is impacted by these types of errors then performance specifications on the error of the LKAS are warranted including the impact on performance due to LKAS maintenance such as windscreen replacement.
While changes in LKAS error did affect the driver’s performance, changes in error did not measurably affect the participant’s assessment of workload or comfort/trust.
When evaluating the learning effect of the simulator trial the mean lane position reduced between the practice and final drive as did the 1 degree steering reversal rate. The time to line crossing was found to increase on curved roads between the practice and final drive. All of these indicate improved driving as expected. However, the standard deviation of lane position increased over the same period, possibly indicating a reduction in driver performance. This is in agreement with Miller et al. (Citation2019) who found an increase in SDLP after using an LKS. Overall because improvements in driver performance between the practice and final drives were demonstrated for most measures and changes in driver performance due to LKAS alignment errors moved opposite to those improvements, the experimental design was effective.
Disclosure statement
No potential conflict of interest was reported by the author(s).
Additional information
Funding
References
- Alsaid, A., Lee, J. D., & Price, M. (2020). Moving into the loop: An investigation of drivers’ steering behavior in highly automated vehicles. Human Factors: The Journal of the Human Factors and Ergonomics Society, 62(4), 671–683. https://doi.org/10.1177/0018720819850283
- Blaschke, C., Breyer, F., Färber, B., Freyer, J., & Limbacher, R. (2009). Driver distraction based lane-keeping assistance. Transportation Research Part F: Traffic Psychology and Behaviour, 12(4), 288–299. https://doi.org/10.1016/j.trf.2009.02.002
- Brandt, T., Sattel, T., & Bohm, M. (2007). Combining haptic human-machine interaction with predictive path planning for lane-keeping and collision avoidance systems [Paper presentation]. 2007 IEEE Intelligent Vehicles Symposium (pp. 582–587). https://doi.org/10.1109/IVS.2007.4290178
- Breyer, F., Blaschke, C., Farber, B., Freyer, J., Limbacher, R., & Färber, B. (2010). Negative Behavioral Adaption to Lane-Keeping Assistance Systems. IEEE Intelligent Transportation Systems Magazine, 2(2), 21–32. https://doi.org/10.1109/MITS.2010.938533
- De Nijs, S. Y., Mulder, M., & Abbink, D. A. (2014). The value of haptic feedback in lane keeping [Paper presentation]. Conference Proceedings - IEEE International Conference on Systems, Man and Cybernetics, 2014–January. (pp. 3599–3604). https://doi.org/10.1109/smc.2014.6974488
- de Winter, J. C. F., van Leeuwen, P. M., & Happee, R. (2012). Advantages and Disadvantages of Driving Simulators: A Discussion [Paper presentation]. Proc. Meas. Behav. Conf. 2012, (pp. 47–50).
- Edwards, C., Cooper, J., & Ton, A. (2015). Human Factors of Vehicle-Based Lane Departure Warning Systems. Final Report, MN/RC 2015-35, Minnesota Department of Transportation, (June), 58.
- Eichelberger, A. H., & McCartt, A. T. (2016). Toyota drivers' experiences with dynamic radar cruise control, pre-collision system, and lane-keeping assist. Journal of Safety Research, 56, 67–73. https://doi.org/10.1016/j.jsr.2015.12.002
- Faizan, M., Hussain, S., & Hayee, M. I. (2019). Design and development of in-vehicle lane departure warning system using standard global positioning system receiver. Transportation Research Record: Journal of the Transportation Research Board, 2673(8), 648–656. https://doi.org/10.1177/0361198119844751
- Fritsch, J., Kuhnl, T., & Geiger, A. (2013). A new performance measure and evaluation benchmark for road detection algorithms. Intelligent Transportation Systems - (ITSC), 2013 16th International IEEE Conference on, (Itsc) (pp. 1693–1700). https://doi.org/10.1109/ITSC.2013.6728473
- Hu, H., Gao, Z., Yu, Z., & Sun, Y. (2017). An experimental driving simulator study of unintentional lane departure. Advances in Mechanical Engineering, 9(10), 168781401772629–168781401772628. https://doi.dox.org/10.1177/1687814017726290 https://doi.org/10.1177/1687814017726290
- Huetter, J. (2018). IIHS research shows risk of uncalibrated front-facing cameras - Repairer Driven NewsRepairer Driven News. Retrieved August 22, 2018, from http://www.repairerdrivennews.com/2018/04/16/iihs-research-shows-risk-of-uncalibrated-front-facing-cameras/
- Katzourakis, D., Alirezaei, M., De Winter, J. C. F., Corno, M., Happee, R., Ghaffari, A., & Kazemi, R. (2011). Shared control for road departure prevention. Conference Proceedings - IEEE International Conference on Systems, Man and Cybernetics (pp. 1037–1043). https://doi.org/10.1109/ICSMC.2011.6083811
- Miller, E. E., Collins, F., & Boyle, L. N. (2019). Behavioral Adaptations to Lane Keeping Systems: Effects of Exposure and Withdrawal. Human Factors, 61(1), 152–164. https://doi.org/10.1177/0018720818800538
- Mulder, M., Abbink, D. A., & Boer, E. R. (2008). The effect of haptic guidance on curve negotiation behavior of young, experienced drivers. Conference Proceedings - IEEE International Conference on Systems, Man and Cybernetics (pp. 804–809). https://doi.org/10.1109/ICSMC.2008.4811377
- Mulder, M., Abbink, D. A., & Boer, E. R. (2012). Sharing control with haptics: Seamless driver support from manual to automatic control. Human Factors, 54(5), 786–798. https://doi.org/10.1177/0018720812443984
- Navarro, J., Deniel, J., Yousfi, E., Jallais, C., Bueno, M., & Fort, A. (2017). Influence of lane departure warnings onset and reliability on car drivers' behaviors. Applied Ergonomics, 59(Pt A), 123–131. https://doi.org/10.1016/j.apergo.2016.08.010
- Petermeijer, S. M., Abbink, D. A., Mulder, M., & De Winter, J. C. F. (2015). The Effect of Haptic Support Systems on Driver Performance: A Literature Survey. IEEE Transactions on Haptics, 8(4), 467–479. https://doi.org/10.1109/TOH.2015.2437871
- Reagan, I. J., & McCartt, A. T. (2016). Observed Activation Status of Lane Departure Warning and Forward Collision Warning of Honda Vehicles at Dealership Service Centers. Traffic Injury Prevention, 17(8), 827–800. https://doi.org/10.1080/15389588.2016.1149698
- SAE J2944 (2015)., Operational Definitions of Driving Performance Measures and Statistics, SAE International, J2944_201506. https://doi.org/10.4271/J2944_201506
- Sartang, G. A., Ashnagar, M., Habibi, E., & Sadeghi, S. (2016). Evaluation of Rating Scale Mental Effort (RSME) effectiveness for mental workload assessment in nurses. Journal of Occupational Health and Epidemiology, 5(4), 211–217. https://doi.org/10.18869/acadpub.johe.5.4.211
- Schwarz, C., Brown, T. L., Keum, C., Gaspar, J. (2016). Transfer from Highly Automated to Manual Control: Performance & Trust, 65p. Safer-Sim University Transportation Center, Unversity of Iowa. Retrieved from http://safersim.nads-sc.uiowa.edu/final_reports/UI_4_Y2_FinalReport.pdf https://trid.trb.org/view/1428770
- Snider, J. M. (2009, February). Automatic steering methods for autonomous automobile path tracking [Master's thesis, Carnegie Mellon University]. Robotics Institute, Carnegie Mellon University, Tech. Rep. CMU-RI-TR-09-08.
- Souders, D. J., Charness, N., Roque, N. A., & Pham, H. (2020). Aging: older adults' driving behavior using longitudinal and lateral warning systems. Human Factors, 62(2), 229–248. https://doi.org/10.1177/0018720819864510
- Stanley, L. M. (2006). Haptic and auditory cues for lane departure warnings. Proceedings of the Human Factors and Ergonomics Society Annual Meeting, 50(22), 2405–2408. https://doi.org/10.1177/154193120605002212
- Teh, E. (2014). Development of a workload estimator : The influence of surrounding traffic behaviour on driver workload and performance [PhD thesis]. University of Leeds.
- Teh, E., Jamson, S., Carsten, O., & Jamson, H. (2014). Temporal fluctuations in driving demand: The effect of traffic complexity on subjective measures of workload and driving performance. Transportation Research Part F: Traffic Psychology and Behaviour, 22, 207–217. https://doi.org/10.1016/j.trf.2013.12.005
- Van Oosterhout, J., Wildenbeest, J. G. W., Boessenkool, H., Heemskerk, C. J. M., De Baar, M. R., Van Der Helm, F. C. T., & Abbink, D. A. (2015). Haptic shared control in tele-manipulation: Effects of inaccuracies in guidance on task execution. IEEE Transactions on Haptics, 8(2), 164–175. https://doi.org/10.1109/TOH.2015.2406708
- Wei, C., Romano, R., Hajiseyedjavadi, F., Merat, N., & Boer, E. (2019). Driver-centred Autonomous Vehicle Motion Control within A Blended Corridor. IFAC-PapersOnLine, 52(5), 212–217. https://doi.org/10.1016/j.ifacol.2019.09.034
- Wiethoff, M. (2003). ADVISORS Project Final Report Annexes. European Union.