
Abstract
There has been an increasing devotion to the gender balance on executive boards in China. There has been an assumption that increasing the proportion of women in the highest jobs will improve company performance and corporate governance. This research paper tests this assumption by studying a sample of 305 publicly listed healthcare companies in China in the period 2016–2019. We find that the choice of gender for board chair and CEO has a more impact on company performance than merely increasing the proportion of women on boards. Assessing the impact on company performance of different gender composition of board chairs and CEOs, we use an innovative approach to measure the relationship, using a proxy measurement in R&D, sales, and marketing expenses.
Introduction
Widening gender diversity and visible minority representation in publicly listed companies’ top jobs continues to be a hot issue for executive committees. Women growing concerns about gender equality have led to regulations (Chieregato, Citation2020; Terjesen, Couto, & Francisco, Citation2016), such as gender quotas, to increase women’s representation on corporate boards. Institutional investors have also used the board gender diversity policy as one of the criteria for investment in a firm. They proposed increasing the proportion of women directors based on the assumption that this will be good for company performance and corporate governance.
A complication with these proposals is that a single focus on proportionality may not reflect women directors’ actual performance (Christiansen, Lin, Pereira, Topalova, & Turk, Citation2016; Guo & Masulis, Citation2015). Green and Homroy (Citation2018) found that increasing the proportion of women directors had no statistically significant association with company performance in the U.K. Moreover, the Gender Diversity and Board Quotas Bill in California (SB 826) received criticism because it considered the result rather than the means of achieving such an outcome. In other words, appointing women directors may have become a regulatory requirement rather than reflect a sound economic decision-making process (Greene, Intintoli, & Kahle, Citation2020).
The relationship between company performance and board gender diversity has been studied. We have found little focus on the interaction effects of a male and women board chair and CEO (Guo & Masulis, Citation2015). It is assumed that the integration of women directors in corporate governance will positively affect company performance. Further, gender diversity seems to bring fresh ideas, perspectives, and different skill sets into the board room. The imagined ideal is that men and women directors can synergize their differences working toward a paradigm shift for a company. However, little empirical research evidence has backed up these claims.
This paper aims to explore three objectives about these claims. First, we provide new data correlating the choice of gender in the Chair and CEO positions to sales performance. Our study uses data from public listed China healthcare companies, with less than 10% of our sample companies having women directors holding board chair or CEO positions. We argue that the women director’s performance impact is not about the proportion of seats held by them but the functions of how a women director interacting on boards.
The second objective is to examine the impact on women directors’ performance when interacting with male directors. We hypothesize that women directors will operate with different influence levels over male directors about governance. While studying the performance impacts of the Gender of a board chair and the Gender of CEO, we seek to identify how various gender compositions exert control over R&D investment.
The third objective is to use a proxy for performance data on marketing expenses as a meditator of R&D investment and sales. It seems that both R&D investment and marketing expenses are in a line-relationship position rather than a staff-relationship role within an organizational structure.
Our endeavor is different from the propositions of other researchers. Ganguli (Citation2009) found that R&D and marketing are a tradeoff relationship, an internal competitor for resource allocation. It suggests that the marketing department guides the R&D investment or spend through the marketing expenses pattern on consumer behavior and market demand in the PRC.
We organize this paper as follows: Section 2 discusses the literature review. Section 3 devotes itself to the research questions and hypotheses. Section 4 explains the research methodology. Section 5 describes the results, and Section 6 presents the conclusions.
Theoretical background
The choice of gender on the executive board
Gender diversity on boards remains a concern in many companies and institutions across the world. The desire to achieve the right proportion of women and visible minorities on corporate boards is based on equality principles. National governments have tried to pass relevant legislation to enforce gender quotas to achieve better representation on boards. In February 2020, the Dutch Government passed a gender quota Bill aimed at board-level appointments. The use of gender quotas to improve disproportionate gender representation has been controversial. Wang and Kelan (Citation2013) argue that the gender quota initiative is beneficial because it has had a positive impact on the appointment of more women board chairs and a women CEO. Although the gender quota status has led to an increase in women directors, it did not affect women employees in lower positions (Bertrand, Black, Jensen, & Lleras-Muney, Citation2014). It has also begged the question of whether an institutional investor might use the existence of gender quotas as a criterion for investment (Adams & Ferreira, 2009). In the literature, we observe no conclusive evidence that increasing women board members will lead to better company performance (Bertrand & Hallock, Citation2001; Green & Homroy, Citation2018; Gregory-Smith, Main, & O’Reilly, 2014; Krishnan & Parsons, Citation2008).
The implementation of board gender diversity requires some caveats. First, Saeed et al. (Citation2016) found that firm size is a key determinant factor of a higher proportion of women directors. In Asia, Morikawa (Citation2016) found that many family businesses in Japan have a higher proportion of women directors than public companies.
Besides board gender diversity research, there is currently other research looking into board committees’ gender composition to ascertain the best mix of male and female directors to produce high synergy performance (Adam et al., 2010; Christiansen et al., Citation2016; Guo & Masulis, Citation2015). Ye et al. (Citation2019) found that a woman director helps temper a male CEO’s over-confidence to improve a firm’s overall decision-making. They highlighted that a women director makes contributions that men directors may be less likely to make, giving a greater diversity of viewpoints, expressing their independent views, and proposing more options. Konrad and Kramer (Citation2006) found that female power has not been fully engaged because a critical mass had not yet been reached in the industry. As of 2018, women held 20.8% of the board seats based on Russell 1000 companies’ findings. However, Hermalin and Weisbach (Citation2003) pointed out that the high proportion of women directors may replace capable male directors. Smith, Smith, and Verner (Citation2006) showed that having the correct gender mix in executive board positions leads to better company performance (Dwyer, Richard, & Chadwick, Citation2003; Molero, Citation2011).
Gender, decision-making, and risk-aversion levels
Men and women behave differently in the workplace, particularly relating to managing risk. Betz, O’Connell, and Shepard (Citation1989) and Bernardi and Arnold (Citation1997) claimed that women are more comfortable with people, while men are more comfortable with money. Powell and Ansic (Citation1997) argued that women are less able as financial decision-makers. Post and Byron (Citation2015) found that differences in cognitive functions between men and women impact company performance and the board’s decision-making process. They also found that women directors positively impacted accounting returns and strategic implementation but with no significant relationship to market performance.
Risk behavior appears in the literature to be similarly gendered. Besides, Levi et al. (Citation2014) found that women directors are less likely to acquire other companies and pay lower bid prices if an acquisition occurs. Wei (Citation2007) also argued that women are more risk-averse than men, and the differential risk attitudes and characteristics between men versus women affect company financial decisions. Jianakoplos and Bernasek (Citation1998) further indicated that women are generally more risk-averse than men when investing. Niessen and Ruenzi (Citation2006) pointed out that women fund managers seem to take a less unsystematic risk and look for more stable investment fund managers. Schubert, Brown, and Brachinger (Citation2000) described that women are generally more risk-averse than men. Khan and Vieito (Citation2013) agreed that when the CEO is a woman, the company safety level is higher than when the CEO is a male. If women make investment decisions in a secure, less uncertain, and less ambiguous environment, they tend to take the same chance as men.
Women at the top usually have a good network (Bartlett & Miller, Citation1985), higher academic qualifications (Adams, Gupta, Haughton, & Leeth, Citation2007). They are younger, on average than their male counterparts (Burress & Zucca, Citation2004). Hersch (Citation1998) indicated that women generally prefer to find safer jobs. However, a woman CEO is willing to take risks if the equity-based compensation portion is sufficiently motivating (Hersch, Citation1998).
Board chairs and CEOs
The Chair-CEO relationship is crucial to the board’s effective functioning and leadership. Brickley, Coles, and Jarrell (Citation1997) argued that separating the titles of Board Chair and CEO will reduce agency costs in corporations and improve performance. However, Dey, Engel, and Liu (Citation2011) argued that splitting the CEO and chairman positions due to investor pressure significantly reduces performance and shareholder wealth investments. Braun and Sharma (Citation2007) found that duality by itself does not influence firm performance in family-controlled public firms. Withers and Fitza (Citation2017) concluded that the separation of CEO and board chair role is beneficial for corporate governance and stakeholder returns.
Cornforth and Macmillan (Citation2016) further explained that the Chair-CEO relationship is not static but influences each other’s perspective over time. Under the principal-agent theories, Bernstein, Buse, and Bilimoria (Citation2016) pointed out that principals (board chairs) and agents (CEOs) are two parties that may have differing interests, perspectives, potentially affecting the decision making of an organization. Muller-Kahle and Schiehll (Citation2013) found that a woman CEO’s structural power is less than a male CEO’s. In some cases, women CEOs are more likely to gain structural control if they are entrepreneurs, work in large companies, or have an elite education. These findings suggest that the gender mix of the chair-CEO relationship must be dynamic to have a significant impact on firm performance.
Board gender diversity in China
Mcguinnes, Vieito, and Wang (Citation2017) reported that the PRC supports gender diversity on social performance boards. Women directors’ appointments to top-management positions improve Corporate Social Responsibility (CSR) ratings that increase qualified foreign institutional investors (QFIIs). Lam, McGuinness and Vieito (Citation2013) reported that women were making up around 4.4% of all CEOs in China listed companies from 2000 to 2008. Our study data show that in the period 2016–2019, this had risen to about 10%. In contrast, Murphy and Cullen (Citation2015) indicated that Europe is unlikely to reach 20% of women executives before 2035. In keeping with international norms, women CEOs in China receive less favorable compensation terms than their male counterparts. In short, the researchers found limited evidence of a link between a woman CEO and company performance (Glass, Cook, & Ingersoll, Citation2016; Walls, Berrone, & Phan, Citation2012).
Investment in R&D and company performance
Investment in R&D is considered an essential investment, especially in high-tech companies (Karl-Heinz, Citation2005). It is hard to find a direct connection between R&D investment and future performance (Wu et al., Citation2020). R&D’s significant impact on company performance depends on investor protection and governance mechanisms. This seems to imply that the CEO and board chair directly influence R&D investment to meet customers’ new demands. We generalize that R&D investment affects a company’s long-term performance. Besides, Dai, Guo, and Wang (2020) also revealed that research and development activities promote a firm’s reputation. In short, we argue that R&D strategy directly influences marketing activity and, ultimately, affects company performance.
Board gender diversity and marketing strategy
Marketing can boost the innovation success of a company. Prevost and Upadhyay (Citation2018) found that the outside-in approach to strategy yields superior company performance. The CEO and board chair have to take active leadership to advocate an appropriate marketing strategy and provide function-specific supports for scholars from marketing, and R&D. Women CEO-led companies had worse market-based performance despite similar levels of accounting-based performance (Wang, Holmes, Devine, & Bishoff, Citation2018). It is interesting to know that Adams, Freitas, and Fontana (2019) found that a combined customer and technology orientation to marketing efforts outperformed those with a customer or technology orientation alone. In conclusion, the literature supports three findings: (1) the marketing expenditure affects a firm’s performance; (2) R&D investment indirectly influences company performance and (3) a combined effort of marketing and R&D outperforms those with a marketing and R&D function alone.
Conceptual model and its hypotheses
Model development
This study deals with the interaction of different gender combinations of board chair and CEO and its impact on performance. The effect of these gender combinations in the top jobs on R&D investment has received little attention in the healthcare industry. As a proxy measure, we will explore the mediating effect of marketing expenses between R&D investment and sales performance.
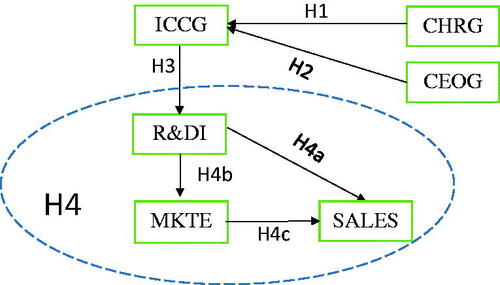
depicts the proposed model with six variables: Gender of board chair (CHRG) and CEO (CEOG), the interaction of Gender of board chair and CEO (ICCG), R&D Investment (R&DI), Marketing Expenses (MKTE), and Sales Performance (SALES). Taking the associations among these variables into consideration, we develop seven hypotheses: Hypotheses 1, 2, 3, 4, 4a, 4 b, and 4c. The last three hypotheses pertain to the examination of the mediating effect. The two exogenous variables are CHRG and CEOG, while the four endogenous variables in this model are ICCG, R&DI, MKTE, and SALES. In the upper part of , both CHRG and CEOG have an impact on ICCG. The lower part of is more complicated as it indicates the mediating effect of marketing expenses between R&DI and SALES. The relationship between ICCG and R&DI links the two parts of the model.
Figure 1. The conceptual model.
Hypotheses development
This section describes how we developed our hypotheses in the model. We first introduce brief literature on the key variables and then offer arguments for the relationship between variables, which form a hypothesis. It is essentially a three-step approach. For example, we first introduce the exogenous variable, the gender of the board chair, then the endogenous variable, the interaction of Gender of the board chair and CEO, and finally discuss their relationships.
Gender of board chair
Seeking clarity on the theory around the gender of board chairs is fragmented. We see recent studies developed in several directions. The first is about the ethical issue of gender balance (Bøhren & Staubo, Citation2014; Oliver, Krause, Busenbark, & Kalm, Citation2018; Sun, Zhu, & Ye, Citation2015). The second examines the performance of gender orientation and performance (Dobbin & Jung, Citation2010). Valls Martinez, Cruz Rambaud, and Parra Oller (Citation2019) and Ye et al. (Citation2019) refer it to either a male Chairperson or a female Chairperson in an organization. In this study, we adopt the same definition for the gender of the board chair in the listed healthcare companies.
Gender of CEO
The theory around the Gender of the CEO is complex. The first theme is concerned with ethical issues. Wu, Guang, Xu, and Wang (Citation2019) examined women executives and corporate social responsibility, while Wolfers (Citation2006) explored gender discrimination in hiring CEOs. The second theme scrutinizes the effect on innovation. Gomez-Mejia, Baixauli-Soler, Belda-Ruiz, and Sanchez-Marin (Citation2019), Ullah, Fang, and Jebran (Citation2019), and Liao et al. (Citation2019) examined how women directors influence firms’ environmental innovation. Third, Faccio, Marchica, and Mura (Citation2016) and Khan and Vieito (Citation2013) looked into how CEO’s Gender affects company performance.
All the above studies have one thing in common; they intrinsically defined gender. The Gender of the CEO refers to either a male CEO or a female CEO in an organization. In our study, we apply the same definition to the listed healthcare company.
Interaction of the gender of board chair and CEO
It refers to mixing the gender of male and female board chairs with the Gender of male and female CEOs in listed healthcare companies. There are four combinations:
We further divide these combinations into two groups: homogenous gender group coded as 1(one) and heterogeneous gender group coded as two (2). We call this process “interaction”.
The interaction of the gender of the board chair and CEO is a new variable that we developed for this study. We are not aware of other studies adopting this approach.
Relationship between interaction of gender of board chair and CEO and gender of board chair
Hence, we propose the following hypothesis.
Hypothesis 1: Gender of board chair has a positive impact on the interaction of the Gender of Board chair and the Gender of the CEO. That is, male board chair tends to influence the choice of male CEO, whereas female board chair tends to influence the choice of male CEO.
Relationship between interaction of gender of chairperson and CEO and gender of CEO
Similarly, according to a study of the listed companies in Vietnam, Tran, Phung, Yang, and Wang (Citation2020) find that women CEO reduces systemic and individual risks. However, there is little study about the Gender of the CEO has a significant positive impact on gender diversity.
Therefore, the following hypothesis emerges.
Hypothesis 2: Gender of CEO has a positive impact on the interaction of the gender of the board chair and the Gender of the CEO. A male CEO prefers to work with a male board chair, whereas a female CEO prefers to work with a male board chair.
R&D investment
The literature on R&D investment gives various definitions. The most commonly accepted one is from Hsu and Cohen (Citation2020) and Diéguez-Soto, Manzaneque, González-García, and Galache-Laza (Citation2019). They define R&D investment as all the costs related to the development of new offerings. These costs include products and services, comprising software investments, amortization of software investments, and company-sponsored R&D. One practical way to select the appropriate definition is to consider if there is accurate data available (Lu, Sheng, & Wang, Citation2020). This definition is the one we use in our model.
It is worth noting that R&D investment should not include government or customer sponsored R&D investment.
Relationship between interaction of gender of chairperson and CEO & R&D investment
Previous studies show that gender diversity in the board can bring a significant positive impact on organization performance as women CEO and board chair are less risk-averse than male directors (AlHares, Elamer, Alshbili, & Moustafa, Citation2020; Appelman, Citation2019; Budi, Citation2019; Nadeem et al., Citation2019; Poletti-Hughes, & Briano-Turrent, Citation2019). A study of 155 non-financial companies was retrieved from the Datastream database from 2004 to 2014 using the two-stage least squares method, Poletti-Hughes, and Briano-Turrent (Citation2019) find that board gender diversity can increase risk-averseness and, in turn, reduce R&D investment.
Hence, the following hypothesis emerges.
Hypothesis 3: The interaction of the gender of the board chair and the Gender of the CEO positively impacts R&D investment. The same genders of Board chair and CEO tend to increase the R&D expenses, whereas opposite genders of Board chair and CEO tend to reduce the R&D expenses.
Company performance
The literature on company performance is enormous. There are at least three key themes. The first theme assesses the company performance from a marketing approach, using a single indicator as an endogenous variable, such as sales and competitive advantage. Zhu, Zhao, and Abbas (Citation2020) adopted sales as a single indicator of performance in examining its triangular relationship with R&D investment and marketing expenses.
The second theme is related to utilizing a single financial indicator, such as cash flow (Sun, & Ding, Citation2020), total assets (Ma, Citation2019; Zhang & Jia, Citation2020), gross profit (Negru & Buzgurescu, Citation2019), and P.E. ratio (Yung et al., Citation2019). A final theme is a performance using a latent variable or constructs instead of a single indicator in the former two streams. The construct is mainly built by grouping psychological variables using exploratory factor analysis (Tse et al., Citation2003; Yau et al., Citation2007). As our study adopts an available public dataset, we will not be considering using any psychological data or scales in the third stream. Further, as we deal with marketing expenses and R&D investment in the proposed model, sales as a performance indicator seem most appropriate. As such, consistent with prior studies (Gregory et al., Citation2019; Spyropoulou, Katsikeas, Skarmeas, & Morgan, Citation2018), we define company performance as the total sales yielded by listed healthcare companies.
Relationship between R&D investment and company performance
Since there is a trend for the CEO or the board chair of large organizations or listed companies to spend a substantial amount of money in R&D, it is worth noting the importance of the effectiveness of the R&D investment to the company performance. Previous studies have ascertained that R&D investment can enhance the market value of the company (Hall & Oriani, Citation2006; Lantz, & Sahut, Citation2005; Lee et al., Citation2019; Ravselj & Aristovnik, Citation2019; Schwartz, Miller, Plummer, & Fusfeld, Citation2011; Sharma, Davcik, & Pillai, Citation2016; Špacek & Vacík, Citation2016; Wang, Du, Koong, & Fan, Citation2017).
Over the past few decades, top I.T. companies such as Apple, Microsoft, Tesla, Alibaba, and Tencent have tended to increase the percentage of their investment in R&D in the hope that they can generally enhance their companies’ performance (Diéguez-Soto et al., Citation2019; Hsu & Cohen, Citation2020). As we mentioned in the last section, company performance’s common indicators are ROI, ROE and ROA, market competitiveness, stock price, sales, and higher operation value (Wang, Du, Koong, & Fan, Citation2017). However, the results of the above studies are mixed. The money spent on R&D investment in I.T. companies has increased because they believe that R&D investment can augment their market competitiveness and increase their chance of competing in the patent race.
Results of the impact of R&D investment on company performance are mixed. First, we have found positive impacts of R&D investment on company performance. Second, R&D investment seldom negatively influences company performance. Its failures may be due to uncertainty, risk factors, and time factors (Ravšelj, & Aristovnik, Citation2020; Xiong, Wang, & Zhao, Citation2020; Yoo, Lee, & Park, Citation2019). Third, R&D investment and company performance may have a non-linear relationship (Ho, Keh, & Omg, 2005). In a study conducted by Xiong et al. (Citation2020), the moderators of financial development and government intervention positively and negatively affect the relationship between R&D investment and company performance in the PRC. Ravšelj and Aristovnik (Citation2020) found that tax incentives and government subsidies can enhance R&D investment in company performance in high-risk environments.
An exciting study serves as an example of revealing the diverse nature of the relationship between R&D investment and company performance. Ho et al. (Citation2005) found that R&D investment does not affect the nonmanufacturing company’s stock value, whereas it positively impacts the manufacturing company’s stock value.
As the results are mixed, we propose to reconfirm the following hypothesis:
Hypothesis 4a: Increased R&D investment yields increasing sales.
Marketing expenses
Marketing expenses are an essential expenditure for businesses needed to attract customers.
We can summarize the literature in four areas. The first area relates to marketing expenses with company performance (Konak, Citation2015; Memarista & Gestanti, Citation2018; Sharma & Husain, Citation2015; Tudose & Alexa, Citation2017; Van Triest, Bun, van Raaij, & Vernooij, Citation2009; O’Neill, Hanson & Mattila, Citation2008). We defer discussion of this area to Section 3.2.1.2, which pertains to its relationship with company performance.
The second area looks into the efficiency of marketing expenses. Papadimitriou and Prachalias (Citation2009) examined global telecom companies’ capability to maximize the input factors’ efficiency, including marketing expenses. Treating marketing expenses as a marketing strategy forms the third area. Luo (Citation2008) argued that prudent investors might be better to pick ‘star’ IPO if they can track pre-IPO marketing expenses. Parida’s (Citation2018) study investigating the impact of market competition on mutual fund marketing expenses represents the fourth area. We regard this as one of the rare studies which treat marketing expenses as a dependent variable.
Most of the studies in the above four areas do not explicitly define marketing expenses. To be consistent, we follow and adopt the definition suggested by Ptok et al. (Citation2018), Traina (Citation2018), and Mishra and Ewing (Citation2020). In this study, marketing expenses are the total expenses spent on advertising and promotion and related marketing activities, including selling, general, and administrative expenses (SGA) in marketing in listed healthcare companies.
Relationship between R&D investment and marketing expenses
Previous studies have revealed that both R&D investment and marketing expenses work together to produce significant positive company performance (Akyüz & Berberoğlu, Citation2016; Zhu et al., Citation2020). However, the result is mixed. According to Akyüz and Berberoğlu (Citation2016), an increase in R&D investment reduces advertising expenses. Similarly, a decrease in R&D investment results in more considerable advertising expenses. According to a longitudinal study in the PRC, where marketing was considered part of the absorptive capacity, this direct absorptive capacity serves as a significant moderating variable between R&D investment and its performance (Zhu et al., Citation2020). Lee (Citation2013) has reported that increasing R&D investment yields a higher brand value for market-driven companies. Since the results are mixing, we need to reexamine the relationship between R&D investment and marketing expenses. Hence, the following hypothesis emerges:
Hypothesis 4b: Increased R&D Investment (R&DI) yields increasing Marketing Expenses (MKTE).
Relationship between marketing expenses and sales performance
Long-term customer relationship or customer relationship management has received recognition as a cost-effective marketing tool in the last two decades (Meesala & Paul, Citation2018; Rashwan, Mansi, & Hassan, Citation2019; Trif, Duțu, & Tuleu, Citation2019; Yan, Wang, Cruz Flores, & Su, Citation2019). There is strong evidence that the healthcare industry’s service environment is beneficial to the marketing of services and product awareness, resulting in potential company growth (Yan et al., Citation2019). A research study also found that the health care service provider’s good service can produce better company performance (Meesala & Paul, Citation2018). Listed companies who increased their advertising expenses after shareholder complaints were able to fend off hostile takeovers (Wies, Hoffmann, Aspara, & Pennings, Citation2019).
Despite negative evidence, the relationship between marketing expenses and company performance is positive in most cases. Hence, we propose the following hypothesis:
Hypothesis 4c: Increased Marketing Expenses (MKTE) yield increasing Sales Performance (SALES).
Mediating effect of marketing expenses between R&D investment and sales performance
Since quite a few factors enhance sales in different industries. In our sample of 305 publicly listed companies in the health care industry, we saw that CEOs and their Boards encountered dilemmas when seeking to allocate expenses to R&D and marketing to achieve economic success, such as sales performance. Some companies found that it was a tradeoff between R&D and marketing (Ganguli, Citation2009). We argue that R&D and marketing are not a tradeoff but a synergetic relationship. The healthcare industry is greatly R&D-driven (Zucchi, Citation2019), and marketing plays a significant role (Anning-Dorson, Tackie, & Boadi, Citation2019).
We expect a full mediation (Tsui & Lee, Citation2018) among R&D investment, Marketing expenses, and Sales performance. However, if we reject H4a, a partial mediation will be identified. Often, CEOs need to make a tough decision when allocating the company resources or budget for the R&D department through the marketing department.
Previous studies have found that the joint influence of R&D investment and marketing expenses strongly impact company sales when they are employed simultaneously (Ganguli, Citation2009; Krishnan, Tadepalli, & Park, Citation2009). We posit that the relationship between R&D investment and marketing expenses will give a synergetic result rather than a company’s competing relationship. Even though the healthcare industry is R&D-driven, R&D efforts are likely to increase its marketing expenses. Hence, we propose the following hypothesis:
Hypothesis 4: Marketing Expenses (MKTE) mediate the relationship between R&D Investment (R&DI) and Sales Performance (SALES).
Research methods
Sample and data source
We collected the PRC’s healthcare industry information from the China Stock Market & Accounting Research Database (CSMARD) for 2016–2019. CSMARD has been a reliable source of public information about the listed company’s profiles and performance. Renowned universities such as Hong Kong Polytechnic University, Chicago University, University of Hong Kong, and Tsinghua University have adopted their databases for academic endeavors during the past ten years.
According to Global Industrial Classification Standard (GICS), companies that we selected fell in Sector 35 (Health Care) and industry groups 3510 (Health Care Equipment & Services) and 3520 (Pharmaceuticals, Biotechnology & Life Sciences). The database in this sector comprises 305 listed companies, which we all included for this study. As such, the sample represents the population of the healthcare industry in the PRC.
The healthcare industry provides an ideal setting for testing our model and hypotheses for several reasons. First, R&D is considered an essential investment in the healthcare industry as it has tremendous effects on company performance. Second, board chair and CEO duality are likely crucial decisions for the healthcare industry because of the PRC’s enormous population. Last, the healthcare industry integrates sectors within the economic system that provides goods and services to treat patients with curative, preventive, rehabilitative, and palliative care (WHO, Citation2018).
Third, we note that the industry represents an enormous consumer market of almost 15 billion consumers in the PRC. As its products and services are necessary for day-to-day life, we cannot overlook its importance.
Operationalization of variables
As discussed in Section 3, there are two exogenous variables and four endogenous variables in the proposed model. The following section describes how we operationalize these variables.
Endogenous variables
The four endogenous variables are ICCG, R&DI, SALES, and MKTE, as shown in .
As indicated in , we coded ICCG 1 when the board chair and CEO were similar in Gender and ICCG 2 when the board chair and CEO were heterogeneous.
Table 1. Exogenous and endogenous variables.
R&DI was operationalized as the amount of investment in R&D, representing the amount of know-how (Hennart & Larimo, Citation1998) and private expropriation hazards (Delios & Henisz, Citation2000). SALES was the revenue generated by selling a company’s products and services, whereas MKTE is the amount of money spent on promotion and other marketing activities.
Exogenous variables
We have two exogenous variables in the Model, CHRG, and CEOG, as shown in .
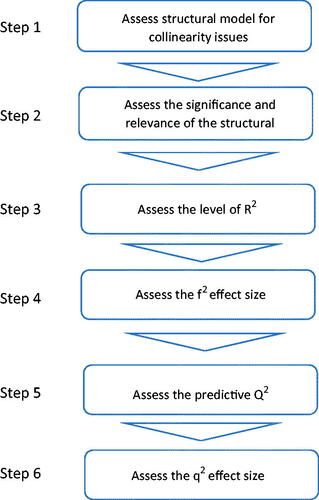
Figure 2. Structural model assessment procedure.
CHRG represents the gender Gender of the board chair, while CEOG defines the gender Gender of the CEO. Both of them are dummy variables in which we coded men as 1 and women as 2.
Analysis methods
The literature on the two streams: the choices of gender in the executive board and R&D & marketing expenses with sales indicates that the regression method and two-stage least square methods are the two most frequently employed techniques in data analysis. However, in this study, we adopt SmartPls 3.3.1, a structural equation modeling software, to test whether the data fit the model and its hypotheses while controlling for the year’s fixed effect. Missing values were first replaced by linear interpolation before we standardized all variables to reduce multicollinearity among variables. There are several justifications for using Smartpls.
First, this paper’s model is an econometric model consisting of a series of regression equations. SmartPls, by itself, is a software to handle structural equation modeling, and it can perform the same job as the two-stage least square regression method, not to mention the simple regression method. Therefore, we consider it appropriate to assess the model we postulated.
Second, even in assessing models without latent variables, the use of SmartPls may help provide extra information on the contribution of an exogenous variable to explaining an endogenous variable (f2 effect size) and the relative predictive relevance (q2 effect size), which other econometric and structural equation modeling software do not provide.
Last, SmartPls has a particular characteristic of handling small samples. Although this study’s sample size (305) is medium, this is yet a specific case. Many other countries may have much smaller sample sizes in the healthcare industry. For example, NYSE has about 90 companies in the healthcare industry. As such, the use of SmartPls serves to help compare the same model across different countries in the future, regardless of their sample sizes.
Results
We present descriptive statistics and correlation coefficients in . The mean of ICCG is −1.65 (S.D. 0.497). On the one hand, the average CHRG is 1.08 (S.D. 0.275), indicating that board chairs are primarily men. On the other hand, CEOG is 1.22 (S.D. 1.045), which shows more men than women. The correlation matrix in indicates that ICCG is significantly correlated with CHRG and CEOG at p = 0.05, respectively. However, its relationship with CHRG is higher than that of CEOG. R&DI has a significant correlation with SALES and MKTE at p < 0.001, whereas MKTE is highly and positively correlated with SALES at p < 0.001. All these relationships are consistent with what we have discussed in Section 2.
Table 2. Descriptive statistics and correlation coefficient matrix (N = 305).
Assessing the model
Testing the model and its hypotheses, we followed the procedures suggested by Hair, Hult, Ringle, and Sarstedt (Citation2016). The process consists of three parts: evaluation of them reflective measurement models, evaluation of formative measurement models, and evaluation of the structural models. Since the model does not deal with endogenous variables with a single reflective measure, we jumped to the third part of evaluating the model’s structural nature, which has the following six steps ().
Step 1. Assess the structural model for collinearity issues
To assess collinearity, we need to examine each predictor separately for each subpart of the structural model. However, since we have standardized all variables before data analysis, the VIF values become 1. Hence, we do not have multicollinearity with VIF higher than 5, and the next thing to do was examine the model fit measures ().
Figure 3. Estimated path coefficients of the conceptual model.
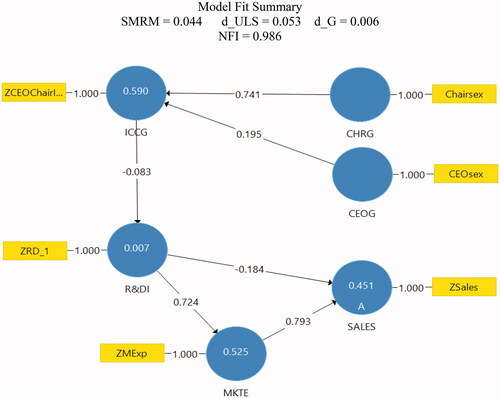
The standardized-root-mean-square-residual (SRMR) was a model fit measure suggested by Henseler et al. (Citation2014). It is the root mean square discrepancy between the observed correlations and the model-implied correlations. When applying Covariance—Structural Equation Modeling (CB-SEM), the threshold for SRMR was set as 0.08. Hair et al. commented that this value would be too low for Partial Least Square - Structural Equation Modeling (PLS-SEM) as the purpose of PLS-SEM is to maximize the explained variance of the endogenous variables or constructs. In assessing the model, we found SRMR 0.055 and NFI 0.999. The former is smaller than the threshold of 0.08, while the latter is larger than the threshold of 0.9.
We found that the d ULS, a model fit index for PLS-SEM, is 0.055, while d_G, another model fit index, is only 0.006. Both indexes indicate that the data fit the model well with a small amount of residual.
Step 2. Assess the significance and relevance of the structural model relationships
Submitting the structural model () to SmartPls, we set the algorithm iteration equal to 500 and bootstrapping samples 5500. and show that the analysis outputs with all paths significant at p < 0,001, except R&DI → SALES. As such, six hypotheses that we postulated were supported. Only H4a that R&DI → SALES was rejected at 0.05 but accepted at 0.100. As such, we conclude that H4a was weakly supported, and further examination of this link seems necessary by using the Sobel Test and mediation analysis by PLS-SEM.
Table 3. Mediation analysis using PLS-SEM.
We further delve into the structural model relationships by examining the total effects and the indirect effects. After testing the seven hypotheses by assessing the direct effects, we found in that the model’s total effects are significant at p < 0.05. shows thirteen indirect effects in the model. Ten indirect effects are statistically significant at p < 0.05, whereas three effects are not.
Table 4. Results of hypotheses testing.
Table 5. Total effects of the model.
We find that the indirect path running from CEOG to SALES [CEOG → ICCG → R&DI → SALES] is not significant at p < 0.05 (t-value of 1.123). This result indicates that CEOG does not impact SALES through ICCG and CEOG, and R&DI.
A similar path runs from CHRG to SALES [CHRG → ICCG → R&DI → SALES] and indicates that both ICCG and CEOG do not increase SALES.
In contrast, the shorter path running from ICCG -> R&DI -> SALES, which is not significant at p < 0.100, indicates that the R&DI is not a good mediator.
Of significant indirect effects, the path R&DI → MKTE → SALES is most relevant to Hypotheses 4a and 4 b. This effect evidences that MKTE is a mediator between R&D and SALES. As R&D does not directly impact SALES, the only way that R&DI can influence SALES is through MKTE (mediation—partial mediation accepted). The next exciting and significant indirect paths are:
CEOG→ICCG→R&DI→MKTE→SALES and
CHRG→ICCG→R&DI→MKTE→SALES.
We can break the model into two parts: the upper part is related to CHRG, CEOG, and ICCG, and the lower part consists of MKTE and SALES. The endogenous variable, R&DI, connects these two parts. If ICCG does not have an impact on R&DI, the model will fall apart.
Overall, as indicated in , all indirect paths are relevant and meaningful, indicating that the model is well-connected among exogenous and endogenous variables.
Table 6. Specific indirect effects.
The next thing to do is to assess the cross-validation of the model. By dividing the dataset into two groups, we coded odd-numbered companies as one (1) and even-numbered companies as two (2). The multigroup procedure of the SmartPls Program was employed to compare whether path coefficients in the model are significantly different across the two groups. shows the results of the cross-validation analysis. Column 4 provides p-values for assessing differences across two groups for all paths in the model. S1 in the header of the column represents the first group, while S2 represents the second group. As the p-values are above 0.377, all path coefficients are not significantly different across the two groups. These indicate that the two samples are statistically insignificant in terms of all path coefficients. Hence, we have successfully cross-validated the model.
Table 7. Two-sample cross-validation.
Step 3. Assess the level of R2
We examine the R2 values of the endogenous variables. As indicated in , the R2 values of ICCG (0.590), MKTE (0.534), SALES (0.453) can be considered moderate. In contrast, the R2 value for R&DI (0.007) is relatively weak.
Step 4. Assessing the f2 effect size
Hair et al. commented that the f2 effect size allows assessing an exogenous variable’s contribution to an endogenous variable’s R2 value. A value of 0.02 represents a small effect, whereas an amount of 0.35 a strong impact.
shows the effect sizes f2 for all combinations of endogenous variables (represented by the columns) and corresponding exogenous variables (defined by the rows). CHRG has a considerable effect size of 1.339 on ICCG, R&DI has a substantial effect size of 1.1475 on MKTE, and MKTE has a medium effect size on SALES (0.544). Further, CEOG has a weak effect size of 0.093 on ICCG and R&DI on SALES (0.029). On the contrary, ICCG does not contribute to R&DI (0.007).
Table 8. f Square endogenous variables.
Step 5. Assess the predictive relevance of Q2
Q2 value is an indicator of a model’s out-of-sample predictive power or predictive relevance, as defined by Hair et al. (Citation2016). When a structural model shows predictive relevance, it accurately predicts data not used in the model estimation. In a structural model, we expect Q2 values larger than zero for a specific endogenous variable, indicating the path model’s predictive relevance for a particular dependent variable. Q2 value equals to or smaller than zero shows a lack of predictive relevance. The blindfolding procedure can be adopted to calculate the Q2 value in two ways: the cross-validated redundancy approach and the cross-validated communality approach. However, to predict eliminated data points, Hair et al. (Citation2016) advised adopting the first approach because it includes the structural and path model’s critical elements.
We applied the blindfolding procedure to the path model shown in and obtained the Q2 values for all endogenous variables, as shown in . All Q2 values are more significant than zero, indicating that all endogenous variables have predictive relevance.
Table 9. Q2 values for predictive relevance.
R&DI has a Q2 value of 0.007, showing a weak predictive relevance. In contrast, ICCG and CEOG, and MKTE show strong predictive relevance as their Q2 values are 0.577 and 0.521, respectively. Further, SALES also has a medium Q2 value of 0.352.
Overall, we have found three out of four endogenous variables with strong and weak predictive relevance. However, having predictive relevance is not enough. We need to find the effect size q2, which measures the relative predictive relevance by comparing the Q2 values obtained after including and excluding the predictors.
Step 6. Assess the q2 effect size
According to Hair et al. (Citation2016), q2 effect size is a measure to assess a predictor variable’s relative predictive relevance on an endogenous construct. We can obtain it through three steps based on the calculation of two different forms of Q2. First, we receive a Q2 value using the blindfolding procedure that measures the path model, including the exogenous variable. We call it Q2 (included). The second step is to get a Q2 value that measures the path model but excluding the exogenous variable. We call it Q2 (excluded). The third step is to calculate q2 using the following formula:[Q2(included) – Q2(excluded)]/(1-Q2(included).
As such, the effect size q2 allows examining an exogenous variable’s contribution to an endogenous variable’s Q2 value. Hair et al. (Citation2016) suggest that q2 values of 0.02, 0.15, and 0.35, respectively, reflect that an exogenous variable has a small, medium, or considerable predictive relevance for a particular endogenous variable.
After applying the blindfolding procedure several times, we obtain the q2 effect size for the model depicted in by alternatively deleting one exogenous variable after another. shows the results of these blindfolding iterations.
Table 10. q2 effect size for relative predictive relevance.
Section summary
We employed SmartPls to assess our model and test the seven hypotheses that we postulated in Section 3. There are several findings worth noting. First, the indicators SRMR and NFI suggest that the data fit the model well. Second, all hypotheses were accepted except Hypothesis 4a at p < 0.05. The f2 effect sizes indicated that exogenous variables have contributed to explaining their endogenous variable with one exception: ICCG does not contribute to R&DI (0.007). Concerning relative predictive relevance, all predictors in the model exhibit medium to considerable strength to predict their respective endogenous variables. Concerning Hypothesis 4, by bringing together the results of testing Hypotheses 4a, 4 b, and 4c, we conclude that MKTE is a partial mediator between R&DI and SALES. This result is further reconfirmed by running a mediation analysis using PLS-SEM, as shown in .
Conclusion
This study examines the effects of board gender composition on China’s healthcare companies’ sales performance. Using the China Stock Market & Accounting Research Database (CSMARD) for 2016-2019, we have shown that board gender composition significantly affects sales performance through R&D investment decision-making. The results seem to provide evidence that a board chair and CEO of the same Gender increase R&D investment while if they are of different genders, they appear to reduce R&D investments. Besides, marketing expenses play a mediating role between R&D investment and sales performance. Marketing is not only for sales but also for the R&D team to guide future demand. Our study appears to demonstrate that board gender composition itself has little impact on marketing efforts. The mediating effect of marketing efforts means that combined marketing and R&D efforts are outperforming individual effort. Overall, the findings suggest that any board’s gender composition synergy has a more beneficial impact rather than merely the critical mass of women appointed as directors across the industry.
Contributions
This study has contributed to the literature on gender diversity management in healthcare companies in three ways. First, existing research has focused on the effect of female board representation on executive boards. While this may sometimes be a requirement for better company performance, appointing women directors does not guarantee it. However, men and women’s interaction effects (Lee et al., Citation2019) holding the board chair and CEO positions directly impact essential operations, such as R&D investment and marketing activity.
Second, the board gender pairing strategies have different impacts on operations, eventually affecting company profitability (Tran, Phung, Yang, & Wang, Citation2020). found that women-led ventures are more likely to fail than men-led ventures in the Asia business environment. In contrast, our study finds that combined men and women-led ventures are outperforming a single-gendered board.
Third, the gender mix compositions affect operation in two ways: the homogeneous ‘gender of board chair and CEO’ increases R&D investment due to group thinking and group pressure. On the contrary, the heterogeneous ‘gender of board chair and CEO’ reduces R&D investment because of their synergy effect.
Management implications
There appear to be several real-world applications of these findings to governance, management, and marketing activities.
First, CEO/Chair duality has been an issue for many years and shows no abating sign (Krause, Semedeni, & Cannella, 2013). CEO duality is the self-conflicting leadership structure hindering the boards from undertaking their duties and managing the corporate effectively and efficiently as board members are restricted in the information they receive. We look beyond duality and argue that implementing the gender mix composition policy could end the long debate of CEO duality. Implementing this policy in a more open, continual, and reciprocal manner than the current rule-based environment can quickly respond to corporate needs. Therefore, Chair–CEO relationships should be dynamic, and this ‘group dynamic’ can create unlimited synergy options for a company’s success (Arena & Braga-Alves, Citation2013). In short, we propose that human resources policy should be encouraging a heterogeneous gender mix for board chair and CEO positions rather than just meeting quotas on boards. (Wearing & Wearing, Citation2004).
Second, most research agrees that we gain a sustainable competitive advantage when investing in both marketing and R&D. A successful company should be producing a leading technology and turning it into a product with attributes better or different than those offered by their competitors (Krishnan et al., Citation2009). We agree with their findings that combined marketing and R&D efforts outperform individual efforts.
Third, from our sample data from PRC publicly listed companies, the marketing effort mediates the link between R&D investment and sales financial performance (Galbreath, Citation2018), implying that marketing should take the lead on the combined R&D and marketing interaction. In other words, the traditional structure of marketing and R&D as two separate departments, each with its budgets, is inefficient. The R&D unit would be a sub-section in the marketing department to enhance the synergy effect of the R&D and marketing functions (Krishnan et al., Citation2009).
Fourth, in the PRC business environment, women CEOs have more human capital than men directors. However, women CEOs receive less favorable personal career success outcomes, and their companies had worse market-based performance than their counterparts but better accounting-based performance (Wang et al., Citation2018). The value of women on-board-company performance remains an issue. We find a positive link with company profitability when male and women directors work together at the executive board level. It is unlikely that companies will reach the gender-balance leadership of males and females soon (Halliday Enyiukwu, Citation2020). However, PRC companies tend to be in the right direction of improving the gender balance of the board of directors. We suggest that women directors shoulder the profitability of listed companies.
Limitations and directions for future research
Our study has several limitations. First, we based our analysis to a large extent on a listed company dataset. Some critical variables, such as board size and women board chair and CEO attributes, were not consistently available.
Second, our study is limited to the healthcare industry in the PRC. We should extend our efforts to other sectors or other countries, i.e., the Fast-moving consumer goods industry, I.T., and service industries in other Asian countries. We can compare our model across various sectors and countries.
Third, a different research area would be a longitudinal analysis, exploring the model’s stability that we have developed. This could capture the changes in CHRG and CEOG on ICCG and R&DI on SALES over time.
Nonetheless, we should consider examining the impact of the length of tenure on the utilization of R&DI, MKTE, and SALES and possibly determine the optimal length of tenure for CEOs in the industry to maximize the company’s performance and the benefits of the stakeholders.
Acknowledgments
The authors thank the anonymous editor who provided insightful guidance in developing and refining this article.
Disclosure statement
No potential conflict of interest was reported by the author(s).
Additional information
Notes on contributors
Anthony S. C. Tsui
Dr. Anthony S.C. Tsui is the founder of Zhuhai Ocean Bright Education Consulting Co., Ltd, an Associate Professor of Business and Management, Director of Academy of Continuing Education of Beijing Normal University-Hong Kong Baptist University, United International College. Dr. Tsui was also a Programme Director for The University of Hong Kong, School of Professional and Continuing Education. He received his Doctor in Business Administration from the University of Newcastle, Australia, Master of Arts, Master of Management from Macquarie University, Australia, and Master of Business Administration (Finance Option) from California State University, USA, as well as several professional titles such as Chartered Marketer, Fellow Chartered Financial Practitioner, and MBTI trainer. Before his academic career, Dr. Tsui has over twenty years of business development experience in the real estate industry in Hong Kong and Canada. In Hong Kong, he was employed as a senior manager by two public listed companies. In Canada, Dr. Tsui was a self-employed SME engaged in health food restaurants, electronic games & entertainment, and real estate & insurance businesses.
Bernard Lee
Dr. Bernard Lee obtained his Doctor of Philosophy (Ph.D.) in Marketing from The University of Nottingham, Doctor of Business Administration (D.B.A.) from The University of Newcastle, Master of Business Administration (M.B.A.) from The University of Edinburgh, and a Master of Science (M.Sc.) from The University of Hong Kong. Having more than ten years of Marketing experience, Dr. Lee is a Chartered Marketer and a Member of The Chartered Institute of Marketing (MCIM), and a Life Member of the Internet Professional Association (iProA). His research interests include Chinese Value, Services Marketing, Consumer Behavior, Marketing Strategy, and Leadership.
Oliver H. M. Yau
Prof. Oliver H. M. Yau is now a Distinguished and Honorary Professor at The Open University of Hong Kong. He is a retired Chair Professor of Marketing at City University of Hong Kong (CityU) where he had served as Associate Dean (Graduate Programmes) of the Faculty of Business for seven years and Head of the Department of Business and Management for two years. After his retirement, he joined the University of Nottingham and had served as a Professor of Marketing at its Ningbo Campus in China during 2014-15. Being an Australian Chinese, he holds a B.B.A. degree with honors and an MBA degree from the Chinese University of Hong Kong, an International Teacher’s Certificate from CESA (now HEC), France, and a Ph.D. degree in marketing from the Management Center, University of Bradford, England.
References
- Adams, S., Gupta, A., Haughton, D., & Leeth, J. (2007). Gender differences in CEO compensation: Evidence from the USA. Female in Management Review, 22(3), 208–224.
- Akyüz, A. M., & Berberoğlu, M. (2016). The moderator effect of R&D expenses on the relationship between companies advertising expenses and market values. Gümüshane University Electronic Journal of the Institute of Social Science/Gümüshane Üniversitesi Sosyal Bilimler Enstitüsü Elektronik Dergisi, 7(17).
- AlHares, A., Elamer, A. A., Alshbili, I., & Moustafa, M. W. (2020). Board structure and corporate R&D intensity: Evidence from Forbes global 2000. International Journal of Accounting & Information Management, 28(3), 445–463. doi:https://doi.org/10.1108/IJAIM-11-2019-0127
- Anning-Dorson, T., Tackie, N. N., & Boadi, M. (2019). Marketing in healthcare management. In Health service marketing management in Africa (pp. 31–44). New York, NY: Productivity Press.
- Appelman, L. A. (2019). Board gender diversity and corporate risk-taking (Master thesis). University of Twente, Enschede, Netherlands.
- Arena, M. P., & Braga-Alves, M. V. (2013). The discretionary effect of CEOs and board chairs on corporate governance structures. Journal of Empirical Finance, 21, 121–131. doi:https://doi.org/10.1016/j.jempfin.2013.01.002
- Bartlett, R., & Miller, T. (1985). Executive compensation: Female executives and networking. AEA Papers and Proceedings, 75(2), 266–271.
- Bernardi, R., & Arnold, D. (1997). An examination of moral development within public accounting by gender, staff level, and company. Contemporary Accounting Research, 14(4), 653–668. doi:https://doi.org/10.1111/j.1911-3846.1997.tb00545.x
- Bernstein, R., Buse, K., & Bilimoria, D. (2016). Revisiting agency and stewardship theories: Perspectives from non-profit board chairs and CEOs. Nonprofit Management and Leadership, 26(4), 489–498. doi:https://doi.org/10.1002/nml.21199
- Bertrand, M., Black, S., Jensen, S., & Lleras-Muney, A. (2014). Breaking the glass ceiling? The effect of board quotas on female labor market outcomes in Norway. NBER Working Paper No. 20256.
- Bertrand, M., & Hallock, K. F. (2001). The gender gap in top corporate jobs. ILR Review, 55(1), 3–21. doi:https://doi.org/10.1177/001979390105500101
- Betz, M., O'Connell, L., & Shepard, J. (1989). Gender differences in proclivity for unethical behavior. Journal of Business Ethics, 8(5), 321–324. doi:https://doi.org/10.1007/BF00381722
- Bøhren, Ø., & Staubo, S. (2014). Does mandatory gender balance work? Changing organizational form to avoid board upheaval. Journal of Corporate Finance, 28, 152–168. doi:https://doi.org/10.1016/j.jcorpfin.2013.12.005
- Braun, M., & Sharma, A. (2007). Should the CEO also be chair of the board? An empirical examination of family-controlled public companies. Family Business Review, 20(2), 111–126. doi:https://doi.org/10.1111/j.1741-6248.2007.00090.x
- Brickley, J. A., Coles, J. L., & Jarrell, G. (1997). Leadership structure: Separating the CEO and chairman of the board. Journal of Corporate Finance, 3(3), 189–220. doi:https://doi.org/10.1016/S0929-1199(96)00013-2
- Budi, P. N. (2019). The role of gender diversity on the board of directors and tax avoidance. Russian Journal of Agricultural and Socio-Economic Sciences, 87(3).
- Burress, J. H., & Zucca, L. J. (2004). The gender equity gap in top corporate executive positions. American Journal of Business, 19(1), 55–63. doi:https://doi.org/10.1108/19355181200400006
- Chieregato, E. (2020). Gender equality and the new economic governance in Europe: The strategic use of women’s employment within labor market reforms in Italy. Social Politics, 27(2).
- Christiansen, L., Lin, H., Pereira, J., Topalova, P., & Turk, M. (2016). Gender diversity in senior positions and firm performance: Evidence from Europe. IMF working paper, W.P./16/50, 1–29.
- Cornforth, C., & Macmillan, R. (2016). Evolution in board chair–CEO relationships: A negotiated order perspective. Nonprofit and Voluntary Sector Quarterly, 45(5), 949–970. doi:https://doi.org/10.1177/0899764015622705
- Daily, C. M., & Dalton, D. R. (1997). CEO and board chair roles held jointly or separately: Much ado about nothing? Academy of Management Perspectives, 11(3), 11–20. doi:https://doi.org/10.5465/ame.1997.9709231660
- Delios, A., & Henisz, W. I. (2000). Japanese firms’ investment strategies in emerging economies. Academy of Management Journal, 43(3), 305–323.
- Dey, A., Engel, E., & Liu, X. (2011). CEO and board chair roles: To split or not to split? Journal of Corporate Finance, 17(5), 1595–1618. doi:https://doi.org/10.1016/j.jcorpfin.2011.09.001
- Diéguez-Soto, J., Manzaneque, M., González-García, V., & Galache-Laza, T. (2019). A study of the moderating influence of R&D Investment on the family management-firm performance relationship: Evidence from Spanish private manufacturing firms. BRQ Business Research Quarterly, 22(2), 105–118. doi:https://doi.org/10.1016/j.brq.2018.08.007
- Dobbin, F., & Jung, J. (2010). Corporate board gender diversity and stock performance: The competence gap or institutional investor bias. NCL, Rev, 89, 809.
- Dwyer, S., Richard, O. C., & Chadwick, K. (2003). Gender diversity in management and firm performance: The influence of growth orientation and organizational culture. Journal of Business Research, 56(12), 1009–1019. doi:https://doi.org/10.1016/S0148-2963(01)00329-0
- Evers, N., Andersson, S., & Hannibal, M. (2012). The Stakeholders in developing marketing capabilities in the internationalizing of SMEs. AIB Academy of International Business Conference, Washington DC, United States, 30 June–July 2012.
- Faccio, M., Marchica, M. T., & Mura, R. (2016). CEO gender, corporate risk-taking, and the efficiency of capital allocation. Journal of Corporate Finance, 39, 193–209. doi:https://doi.org/10.1016/j.jcorpfin.2016.02.008
- Galbreath, J. (2018). Is board gender diversity linked to financial performance? The mediating mechanism of CSR. Business & Society, 57(5), 863–889. doi:https://doi.org/10.1177/0007650316647967
- Ganguli, S. (2009). Impact of R&D versus marketing on sales growth in Indian industrial sectors. IUP Journal of Management Research, 8(2), 55–64.
- Glass, C., Cook, A., & Ingersoll, A. R. (2016). Do women leaders promote sustainability? Analyzing the effect of corporate governance composition on environmental performance. Business Strategy and the Environment, 25(7), 495–511. doi:https://doi.org/10.1002/bse.1879
- Gomez-Mejia, L., Baixauli-Soler, J. S., Belda-Ruiz, M., & Sanchez-Marin, G. (2019). CEO stock options and gender from the behavioral agency model perspective. Management Research: Journal of the Iberoamerican Academy of Management, 17(1), 68–88. doi:https://doi.org/10.1108/MRJIAM-05-2018-0836
- Green, C. P., & Homroy, S. (2018). Female directors, board committees, and firm performance. European Economic Review, 102, 19–38. doi:https://doi.org/10.1016/j.euroecorev.2017.12.003
- Greene, D., Intintoli, V. J., & Kahle, K. M. (2020). Do board gender quotas affect firm value? Evidence from California Senate Bill No. 826. Journal of Corporate Finance, 60, 101526. doi:https://doi.org/10.1016/j.jcorpfin.2019.101526
- Gregory, G. D., Ngo, L. V., & Karavdic, M. (2019). Developing e-commerce marketing capabilities and efficiencies for enhanced performance in business-to-business export ventures. Industrial Marketing Management, 78, 146–157. doi:https://doi.org/10.1016/j.indmarman.2017.03.002
- Gregory‐Smith, I., Main, B. G. M., & O’Reilly, C. A. (2014). Appointments, pay, and performance in U.K. boardrooms by gender. The Economic Journal, 124(574), F109–F128. doi:https://doi.org/10.1111/ecoj.12102
- Guo, L., & Masulis, R. W. (2015). Board structure and monitoring; new evidence from CEO turnovers. Review of Financial Studies, 28(10), 2770–2811. doi:https://doi.org/10.1093/rfs/hhv038
- Hair, J.F., Jr., Hult, G. T. M., Ringle, C., & Sarstedt, M. (2016). A primer on partial least squares structural equation modeling (PLS-SEM). New York: Sage publication.
- Hall, B. H., & Oriani, R. (2006). Does the market value R&D investment by European firms? Evidence from a panel of manufacturing firms in France, Germany, and Italy. International Journal of Industrial Organization, 24(5), 971–993. doi:https://doi.org/10.1016/j.ijindorg.2005.12.001
- Halliday Enyiukwu, P. C. (2020). How women in leadership describe their rise to leadership in Nigeria (Doctor of philosophy thesis). Liberty University.
- Henseler, J., Dijkstra, T. K., Sarstedt, M., Ringle, C. M., Diamantopoulos, A., Straub, D. W., & Calantone, R. J. (2014). Common beliefs and reality about PLS: Comments on Rönkkö and Evermann (2013). Organizational research methods, 17(2), 182–209.
- Hennart, J. F., & Larimo, J. (1998). The impact of culture on the strategy of multinational enterprises: Does national origin affect ownership decisions? Journal of International Business Studies, 29(3), 515–538. doi:https://doi.org/10.1057/palgrave.jibs.8490005
- Hermalin, B. E., & Weisbach, M. S. (2003). Boards of directors as an endogenously determined institution: Aa survey of the economic literature. FRBNY Economic Policy Review, 9, 7–26.
- Hersch, J. (1998). Compensating differentials for gender-specific job injury risks. The American Economic Review, 88(3), 598–607.
- Ho, Y. K., Keh, H. T., & Ong, J. M. (2005). The effects of R&D and advertising on firm value: An examination of manufacturing and nonmanufacturing firms. IEEE Transactions on Engineering Management, 52(1), 3–12. doi:https://doi.org/10.1109/TEM.2004.839943
- Hsu, S. T., & Cohen, S. K. (2020). Revisiting the R&D investment–performance relationship: The moderating effects of factor market characteristics. Journal of Engineering and Technology Management, 57, 101570. doi:https://doi.org/10.1016/j.jengtecman.2020.101570
- Jianakoplos, N., & Bernasek, A. (1998). Are females more risk-averse? Economic Inquiry, 36(4), 620–630. doi:https://doi.org/10.1111/j.1465-7295.1998.tb01740.x
- Karl-Heinz, L. (2005). Managing and reporting intangible assets in research technology organizations. R&D Management, 35(2), 235–256.
- Khan, W. A., & Vieito, J. P. (2013). CEO gender and firm performance. Journal of Economics and Business, 67, 55–66. doi:https://doi.org/10.1016/j.jeconbus.2013.01.003
- Konak, F. (2015). The effect of marketing expenses on firm performance: Empirical evidence from the BIST textile, leather index. Journal of Economics, Business, and Management, 3(1), 1068–1071.
- Konrad, A. M., & Kramer, V. W. (2006). How many women do boards need? Harvard Business Review, 84(12), 22.
- Krause, R., Semadeni, M., & Cannella, A. A. Jr. (2014). CEO duality: A review and research agenda. Journal of Management, 40(1), 256–286. doi:https://doi.org/10.1177/0149206313503013
- Krishnan, G., & Parsons, L. (2008). Getting to the bottom line: An exploration of gender and earnings quality. Journal of Business Ethics, 78(1–2), 65–76. doi:https://doi.org/10.1007/s10551-006-9314-z
- Krishnan, H. A., Tadepalli, R., & Park, D. (2009). R&D intensity, marketing intensity, and organizational performance. Journal of Managerial Issues, 232–244.
- Lam, K. C., McGuinness, P. B., & Vieito, J. P. (2013). CEO gender, executive compensation, and firm performance in Chinese‐listed enterprises. Pacific-Basin Finance Journal, 21(1), 1136–1159. doi:https://doi.org/10.1016/j.pacfin.2012.08.006
- Lantz, J. S., & Sahut, J. M. (2005). R&D investment and the financial performance of technological firms. International Journal of Business, 10(3), 251.
- Lee, B., Tsui, A.S.C., & Yau, O.H.M. (2019). Higher-order goals, trust-in-leader, and self-efficacy as moderators of transformational leadership performance: The case of multi-level marketing organizations in China. Journal of Euromarketing, 28(3–4), 76–97.
- Lee, J. Y. (2013). How customer-centric structures leverage the effects of advertising and R&D on brand equity and firm performance (Doctor of philosophy dissertation). The University of Washington, Seattle, WA.
- Lee, N. (2019). R&D accounting treatment, firm performance, and market value: Biotech firms case study. Journal of International Studies, 12(2), 66–81. doi:https://doi.org/10.14254/2071-8330.2019/12-2/4
- Levi, M., Li, K., & Zhang, F. (2014). Director genders and mergers and acquisitions. Journal of Corporate Finance, 28, 185–200. doi:https://doi.org/10.1016/j.jcorpfin.2013.11.005
- Liao, Z., Zhang, M., & Wang, X. (2019). Do female directors influence firms' environmental innovation? The moderating role of ownership type. Corporate Social Responsibility and Environmental Management, 26(1), 257–263. doi:https://doi.org/10.1002/csr.1677
- Lu, X., Sheng, Y., & Wang, J. (2020). The influence of executive compensation incentives on R&D investment: The moderating effect of executive overconfidence. Technology Analysis & Strategic Management, 32(10), 1169–1181. doi:https://doi.org/10.1080/09537325.2020.1748184
- Luo, X. (2008). When marketing strategy first meets wall street: Marketing spendings and firms' initial public offerings. Journal of Marketing, 72(5), 98–109.
- Ma, X. (2019). Impact of leverage buyouts on target companies (Doctoral dissertation). Massachusetts Institute of Technology, Cambridge, MA.
- Mcguinness, P. B., Vieito, P., & Wang, M. (2017). CSR performance in China: The role of board gender and foreign ownership. Journal of Corporate Finance, 42, 75–99. doi:https://doi.org/10.1016/j.jcorpfin.2016.11.001
- Meesala, A., & Paul, J. (2018). Service quality, consumer satisfaction, and loyalty in hospitals: Thinking for the future. Journal of Retailing and Consumer Services, 40, 261–269. doi:https://doi.org/10.1016/j.jretconser.2016.10.011
- Memarista, G., & Gestanti, L. (2018). Sunk Cost dilemma behavior: The contribution of marketing expenses towards financial performance. Jurnal Keuangan dan Perbankan, 22(4), 625–642. doi:https://doi.org/10.26905/jkdp.v22i4.1871
- Mishra, S., & Ewing, M. T. (2020). Financial constraints and marketing investment: Evidence from text analysis. European Journal of Marketing, 54(3), 525–545. doi:https://doi.org/10.1108/EJM-01-2019-0090
- Molero, E. (2011). Are workplaces with many females in management run differently? Journal of Business Research, 64, 385–393.
- Morikawa, M. (2016). What types of companies have female directors? Evidence from Japan. Japan and the World Economy, 37–38, 1–7. doi:https://doi.org/10.1016/j.japwor.2015.09.001
- Muller-Kahle, M. I., & Schiehll, E. (2013). Gaining the ultimate power edge: Women in the dual role of CEO and Chair. The Leadership Quarterly, 24(5), 666–679. doi:https://doi.org/10.1016/j.leaqua.2013.05.001
- Murphy, M., & Cullen, P. (2015). Reversing the Paradox–Promoting gender-balanced leadership. In The Proceedings of the Conference jointly organized by Ibec and the Department of Justice and Equality with the assistance of the European Commission (pp. 1–47).
- Nadeem, M., Suleman, T., & Ahmed, A. (2019). Women on boards, firm risk, and profitability nexus: Does gender diversity moderate the risk and return relationship? International Review of Economics & Finance, 64, 427–442. doi:https://doi.org/10.1016/j.iref.2019.08.007
- Negru, E., & Buzgurescu, O. L. P. (2019). The correlation between financial performance and the risks assumed by companies. Economy & Business Journal, 13(1), 128–135.
- Niessen, A., & Ruenzi, S. (2006). Sex matters: Gender and mutual funds. Manuscript, University of Cologne.
- Oliver, A. G., Krause, R., Busenbark, J. R., & Kalm, M. (2018). B.S. in the boardroom: Benevolent sexism and board chair orientations. Strategic Management Journal, 39(1), 113–130. doi:https://doi.org/10.1002/smj.2698
- O’Neill, J. W., Hanson, B., & Mattila, A. S. (2008). The relationship between sales and marketing expenses to hotel performance in the United States. Cornell Hospitality Quarterly, 49(4), 355–363. doi:https://doi.org/10.1177/1938965508324634
- Papadimitriou, A. C., & Prachalias, C. P. (2009). Estimating the efficiency of marketing expenses: The case of global telecommunication operators. Journal of Economics and Business, 12(2), 23–41.
- Parida, S. (2018). Impact of competition on mutual fund marketing expenses. International Journal of Financial Studies, 6(1), 29. doi:https://doi.org/10.3390/ijfs6010029
- Poletti-Hughes, J., & Briano-Turrent, G. C. (2019). Gender diversity on the board of directors and corporate risk: A behavioral agency theory perspective. International Review of Financial Analysis, 62, 80–90. doi:https://doi.org/10.1016/j.irfa.2019.02.004
- Post, C., & Byron, K. (2015). Women on boards and firm financial performance: A meta-analysis. Academy of Management Journal, 58(5), 1546–1571. doi:https://doi.org/10.5465/amj.2013.0319
- Powell, M., & Ansic, D. (1997). Gender differences in risk behavior in financial decision making: An experimental analysis. Journal of Economic Psychology, 18(6), 605–628. doi:https://doi.org/10.1016/S0167-4870(97)00026-3
- Prevost, A., & Upadhyay, A. (2018). Board gender diversity and CEO inside debt compensation. Working paper, University of Vermont, Burlington, VT.
- Ptok, A., Jindal, R. P., & Reinartz, W. J. (2018). Selling, general, and administrative expense (SGA)-based metrics in marketing: Conceptual and measurement challenges. Journal of the Academy of Marketing Science, 46(6), 987–1011. doi:https://doi.org/10.1007/s11747-018-0589-2
- Rashwan, H. H. M., Mansi, A. L. M., & Hassan, H. E. (2019). The impact of the E-CRM (expected security and convenience of website design) on E-loyalty field study on commercial banks. Journal of Business and Retail Management Research, 14(1).
- Ravselj, D., & Aristovnik, A. (2019). The impact of R&D accounting treatment on firm’s market value: Evidence from germany. The Social Sciences, 14(6), 247–254.
- Ravšelj, D., & Aristovnik, A. (2020). The impact of public R&D subsidies and tax incentives on business R&D expenditures. International Journal of Economics and Business Administration, 8(1), 160–179.
- Saeed, A., Belghitar, Y., & Yousaf, A. (2016). Firm-level determinants of gender diversity in the boardrooms: Evidence from some emerging markets. International Business Review, 25(5), 1076–1088. doi:https://doi.org/10.1016/j.ibusrev.2016.01.002
- Schubert, M., Brown, M., & Brachinger, H. (2000). Gender-specific attitudes towards risk and ambiguity: An experimental investigation. Working Paper, Center for Economic Research, Swiss Federal Institute of Technology Zürich, Zürich.
- Schwartz, L., Miller, R., Plummer, D., & Fusfeld, A. R. (2011). Measuring the effectiveness of R&D. Research-Technology Management, 54(5), 29–36. doi:https://doi.org/10.5437/08956308X5405008
- Sharma, J. K., & Husain, S. (2015). Marketing expenses & profitability: Evidence from the telecom sector in the Kingdom of Saudi Arabia. Marketing, 7(35), 69–70.
- Sharma, P., Davcik, N. S., & Pillai, K. G. (2016). Product innovation as a mediator in the impact of R&D expenditure and brand equity on marketing performance. Journal of Business Research, 69(12), 5662–5669. doi:https://doi.org/10.1016/j.jbusres.2016.03.074
- Smith, N., Smith, V., & Verner, M. (2006). Do females in top management affect firm performance? A panel study of 2500 Danish Firms. International Journal of Productivity and Performance Management, 55(7), 569–593. doi:https://doi.org/10.1108/17410400610702160
- Špacek, M., & Vacík, E. (2016). Company value creation through effective innovation process management. Journal of Innovation Management, 4(3), 65–78. doi:https://doi.org/10.24840/2183-0606_004.003_0006
- Spyropoulou, S., Katsikeas, C. S., Skarmeas, D., & Morgan, N. A. (2018). Strategic goal accomplishment in export ventures: The role of capabilities, knowledge, and environment. Journal of the Academy of Marketing Science, 46(1), 109–129. doi:https://doi.org/10.1007/s11747-017-0519-8
- Sun, S. L., Zhu, J., & Ye, K. (2015). Board openness during an economic crisis. Journal of Business Ethics, 129(2), 363–377. doi:https://doi.org/10.1007/s10551-014-2164-1
- Sun, W., & Ding, Y. (2020). Corporate social responsibility and cash flow volatility: The curvilinear moderation of marketing capability. Journal of Business Research, 116, 48–59. doi:https://doi.org/10.1016/j.jbusres.2020.05.016
- Terjesen, S., Couto, E. B., & Francisco, P. M. (2016). Does the presence of independent and female directors impact firm performance? A multi-country study of board diversity. Journal of Management & Governance, 20(3), 447–483. doi:https://doi.org/10.1007/s10997-014-9307-8
- Traina, J. (2018). Is aggregate market power increasing? Production trends using financial statements. Production trends using financial statements. New Working Paper, Series No. 17. The University of Chicago, Chicago, IL.
- Tran, C. D., Phung, M. T., Yang, F. J., & Wang, Y. H. (2020). The role of gender diversity in downside risk: Empirical evidence from Vietnamese listed firms. Mathematics, 8(6), 933. doi:https://doi.org/10.3390/math8060933
- Trif, S. M., Duțu, C., & Tuleu, D. L. (2019). Linking CRM capabilities to business performance: Aa comparison within markets and between products. Management & Marketing. Challenges for the Knowledge Society, 14(3), 292–303. doi:https://doi.org/10.2478/mmcks-2019-0021
- Tse, A. C.B., Sin, L., Yau, O.H.M., Lee, J., & Chow, R. (2003). Market orientation and business performance in a Chinese business environment. Journal of Business Research, 56(3), 227–239. doi:https://doi.org/10.1016/S0148-2963(01)00230-2
- Tsui, A.S.C., & Lee, B. (2018). Higher-order goals, trust-in-leader, and self-efficacy as mediators of transformational leadership performance: The case of multi-level marketing organizations in China. Journal of Information Technology Applications and Management, 25 (4), 79–114.
- Tudose, M. B., & Alexa, L. (2017). The effect of marketing expenses on car sales–an empirical analysis. In MATEC Web of Conferences (Vol. 126, p. 04004). EDP Sciences. doi:https://doi.org/10.1051/matecconf/201712604004
- Ullah, I., Fang, H., & Jebran, K. (2019). Do gender diversity and CEO gender enhance the firm’s value? Evidence from an emerging economy. Corporate Governance: The International Journal of Business in Society, 20(1), 44–66. https://www.emerald.com/insight/content/. doi:https://doi.org/10.1108/CG-03-2019-0085/full/html
- Valls Martinez, M. D. C., Cruz Rambaud, S., & Parra Oller, I. M. (2019). Gender policies on board of directors and sustainable development. Corporate Social Responsibility and Environmental Management, 26(6), 1539–1553.
- Van Triest, S., Bun, M. J., van Raaij, E. M., & Vernooij, M. J. (2009). The impact of customer-specific marketing expenses on customer retention and customer profitability. Marketing Letters, 20(2), 125–138. doi:https://doi.org/10.1007/s11002-008-9061-2
- Walls, J. L., Berrone, P., & Phan, P. H. (2012). Corporate governance and environmental performance: Is there really a link? Strategic Management Journal, 33(8), 885–913. doi:https://doi.org/10.1002/smj.1952
- Wang, G., Holmes, R. M., Jr., Devine, R. A., & Bishoff, J. (2018). CEO gender differences in careers and the moderating role of country culture: A meta-analytic investigation. Organizational Behavior and Human Decision Processes, 148, 30–53. doi:https://doi.org/10.1016/j.obhdp.2018.04.002
- Wang, M., & Kelan, E. (2013). The gender quota and female leadership: Effects of the Norwegian gender quota on board chairs and CEOs. Journal of Business Ethics, 117 (3), 449–466. doi:https://doi.org/10.1007/s10551-012-1546-5
- Wang, Y., Du, R., Koong, K. S., & Fan, W. (2017). Effects of R&D policy choice on accounting performance and market value. R&D Management, 47(4), 545–556.
- Wearing, C. A., & Wearing, B. (2004). Between glass ceilings: Female non-executive directors in the UK quoted companies. International Journal of Disclosure and Governance, 1(4), 355–371. doi:https://doi.org/10.1057/palgrave.jdg.2040036
- Wei, X. (2007). Wage Compensation for job-related illness: Evidence from a matched employer and employee survey in the U.K. Journal of Risk and Uncertainty, 34(1), 85–99. doi:https://doi.org/10.1007/s11166-006-9000-7
- Wies, S., Hoffmann, A. O. I., Aspara, J., & Pennings, J. M. (2019). Can advertising investments counter the negative impact of shareholder complaints on firm value? Journal of Marketing, 83(4), 58–80. doi:https://doi.org/10.1177/0022242919841584
- Withers, M. C., & Fitza, M. A. (2017). Do board chairs matter? The influence of board chairs on firm performance. Strategic Management Journal, 38(6), 1343–1355. doi:https://doi.org/10.1002/smj.2587
- Wolfers, J. (2006). Diagnosing discrimination: Stock returns and CEO gender. Journal of the European Economic Association, 4(2–3), 531–541. doi:https://doi.org/10.1162/jeea.2006.4.2-3.531
- World Health Organization. (2018). Continuity and coordination of care: a practice brief to support implementation of the WHO Framework on integrated people-centred health services.
- Wu, C., Guang, H., Xu, J., & Wang, S. (2019). The effects of female executives on corporate philanthropy in China. Corporate Social Responsibility and Environmental Management, 26(3), 628–643. doi:https://doi.org/10.1002/csr.1708
- Wu, S. S., Fernando, K., Allerton, C., Jansen, K. U., Vincent, M. S., & Dolsten, M. (2020). Adopting a logical framework model to help achieve a balanced and healthy vaccine R&D portfolio. Wellcome Open Research, 4, 64. doi:https://doi.org/10.12688/wellcomeopenres.15168.2
- Xiong, Z., Wang, P., & Zhao, Y. (2020). Re-innovation from failure, institutional environmental differences, and firm performance: Evidence from China. Anfiteatro Economic, 22(53), 197–219.
- Yan, M. R., Wang, C. H., Cruz Flores, N. J., & Su, Y. Y. (2019). Targeting open market with strategic business innovations: A case study of growth dynamics in essential oil and aromatherapy industry. Journal of Open Innovation: Technology, Market, and Complexity, 5(1), 7. doi:https://doi.org/10.3390/joitmc5010007
- Yau, O. H.M., Chow, R. P.M., Sin, L. Y.M., Tse, A. C.B., Luk, C.L., & Lee, J. S.Y. (2007). Developing a scale for stakeholder orientation. European Journal of Marketing, 41(11/12), 1306–1327. doi:https://doi.org/10.1108/03090560710821198
- Ye, D., Deng, J., Liu, Y., Szewczyk, S. H., & Chen, X. (2019). Does board gender diversity increase dividend payouts? Analysis of global evidence. Journal of Corporate Finance, 58, 1–26. doi:https://doi.org/10.1016/j.jcorpfin.2019.04.002
- Yoo, J., Lee, S., & Park, S. (2019). The effect of the firm life cycle on the relationship between R&D expenditures and future performance, earnings uncertainty, and sustainable growth. Sustainability, 11(8), 2371. doi:https://doi.org/10.3390/su11082371
- Yung, W., Lin, W., & Gan, M. (2019). The influence of internationalization degree on the performance of industry-specific companies: A case study of Taiwan (2001–2017). International Journal of Economics and Financial Issues, 9(4), 212–227. doi:https://doi.org/10.32479/ijefi.8191
- Zhang, Y., & Jia, Y. (2020). A discriminant analysis of the financial indicators of innovative pharmaceutical enterprises. E&ES, 440(2), 022039.
- Zhu, H., Zhao, S., & Abbas, A. (2020). Relationship between R&D grants, R&D investment, and innovation performance: The moderating effect of absorptive capacity. Journal of Public Affairs, 20(1), 1–10.e1973. doi:https://doi.org/10.1002/pa.1973
- Zucchi, K. (2019). Investing in the healthcare sector. Investopedia. Retrieved from https://www.investopedia.com/articles/stocks/08/investing-in-healthcare.asp.