
ABSTRACT
While transfer-RNAs (tRNAs) are known to transport amino acids to ribosome, new functions are being unveiled from tRNAs and their fragments beyond protein synthesis. Here we show that phosphorylation of 90-kDa RPS6K (ribosomal proteins S6 kinase) was enhanced by tRNALeu overexpression under amino acids starvation condition. The phosphorylation of 90-kDa RPS6K was decreased by siRNA specific to tRNALeu and was independent to mTOR (mammalian target of rapamycin) signaling. Among the 90-kDa RPS6K family, RSK1 (ribosomal S6 kinase 1) and MSK2 (mitogen-and stress-activated protein kinase 2) were the major kinases phosphorylated by tRNALeu overexpression. Through SILAC (stable isotope labeling by/with amino acids in cell culture) and combined mass spectrometry analysis, we identified EBP1 (ErbB3-binding protein 1) as the tRNALeu-binding protein. We suspected that the overexpression of free tRNALeu would reinforce ErbB2/ErbB3 signaling pathway by disturbing the interaction between ErbB3 and EBP1, resulting in RSK1/MSK2 phosphorylation, improving cell proliferation and resistance to death. Analysis of samples from patients with breast cancer also indicated an association between tRNALeu overexpression and the ErbB2-positive population. Our results suggested a possible link between tRNALeu overexpression and RSK1/MSK2 activation and ErbB2/ErbB3 signaling.
KEYWORDS:
Introduction
Transfer-RNAs (tRNAs), aminoacyl-tRNA synthetases (ARSs), and amino acids are the essential elements for protein synthesis. ARSs ligate tRNAs with cognate amino acids, after which aminoacyl-tRNAs participate in translation, transporting precursor amino acids to the ribosome.Citation1 Although one tRNA is usually charged with only one of the 20 different amino acids, the human tRNAome is very complicated, and consists of more than 500 interspersed tRNA genes and 51 anticodon families.Citation2 Most tRNA groups incorporate isoacceptors that are charged with the same amino acid, but have different anticodons. In addition, sequence similarities do not guarantee the equal function or expression of tRNAs.Citation3,Citation4
For a long time, tRNAs have been considered as merely house-keeping RNAs; however, recent studies have suggested that tRNAs and their fragments may have diverse roles. For example, Mey et al. had reported that several tRNAs could bind to cytochrome C, inhibiting caspase activation and cell apoptosis upon apoptotic stimuli.Citation5 Initiator tRNAs are unique in that they can initiate translation; overexpression of initiator tRNAs was reported to change the translational efficiency of specific genes and alter the global tRNA expression, resulting in cell proliferation, enhanced cancer metastasis, and invasion.Citation6,Citation7 Various stimuli have been reported to cause tRNA digestion, generating small tRNA-derived fragments (tRFs).Citation8 tRFs can be derived from pre-tRNAs or mature tRNAs and are similar in size to microRNAs. Our understanding of the diverse functions of tRFs has improved recently; tRFs are now known to participate in translation regulation, neuroprotection, cell proliferation, tumourigenesis, and RNA silencing similarly to microRNAs.Citation9-Citation13
In addition, overexpression of tRNAs has been observed in various cancer cell lines and tissues, although their biogenesis and translational requirements remain obscure.Citation4,Citation14,Citation15 Given that tRNA abundance is correlated with protein synthesis,Citation16 it has been hypothesized that tRNA content may affect the rate of translation, globally or for a subset of proteins based on codon usage.Citation17 A recent study had revealed that breast cancer metastasis was promoted by tRNAGlu UUC and tRNAArg CCG.Citation4 This study demonstrated that overexpression of specific tRNAs could modulate protein expression in a codon-dependent manner, resulting in metastatic behavior. It also shed light on the importance of quantitative changes in tRNAs. However, it is still debated whether tRNA abundance and codon usage are under concerted regulation of translation rate and efficiency.Citation18-Citation20 In fact, several studies have suggested that preferentially used codons are not translated faster, and that tRNA variation might play an adaptive role in coping with environmental changes. Analysis of human tRNAs using microarrays have revealed that tRNAs could be biasedly induced toward different cell programs such as proliferation and differentiation.Citation20,Citation21 Taken together, these reports suggested that more studies would be required for understanding the relationship between tRNAs and translational need.
The ribosomal protein S6 kinase (RPS6K) is a family of proteins which have the ability to phosphorylate a 40S ribosomal subunit component and mediate key intracellular signaling.Citation22 RPS6K shares a hydrophobic motif and representative phosphorylation site among the family members and it comprises 4 RSKs (ribosomal S6 kinases, RSK1–4), 2 MSKs (mitogen-and stress-activated protein kinases, MSK1–2), S6K1 and S6K2 proteins.Citation23,Citation24 Among them, p70 S6K and p85 S6K are two splice variants of S6K1, which have been well studied due to the roles under mTOR (mammalian target of rapamycin) signaling.Citation25
In this study, we overexpressed tRNAs to investigate their effects on cell phenotypes, and found that several tRNAs, especially tRNALeu, enhanced resistance to cell death under amino acid starvation. We investigated the signal pathways in which tRNALeu participates and found that tRNALeu overexpression induced RSK1 and MSK2 phosphorylation enhancing cell proliferation. Our study showed that mature and free tRNALeu could control cell proliferation without growth stimuli, suggesting a possible role of tRNALeu in cancer.
Results
tRNALeu overexpression promotes cell proliferation
We cloned genomic DNA fragments containing the representative tRNAs into the pGEM-T Easy vector (Table S1 and S2). The fragments contained at least 200 bp each upstream and downstream of the endogenous tRNA gene, which included all the regulatory elements necessary for tRNA transcription.Citation26,Citation27 We transfected several tRNA vectors into mammalian cells and confirmed the overexpression of these tRNAs via RT-PCR (Fig. S1A). As many studies have reported novel functions of tRNAs or tRFs in cell proliferation or apoptosis,Citation5-Citation7,Citation10,Citation11,Citation28,Citation29 we wondered whether the overexpression of these tRNAs would affect any cell phenotypes. Interestingly, the overexpression of tRNAs enhanced cell proliferation, based on [3H]thymidine incorporation and cell number count; tRNALeu CAG was found to show the most significant effects (). Protein synthesis, measured by [35S]Met incorporation, also showed significant changes after the overexpression of tRNALeu CAG and tRNAMet CAU, but not so much as cell proliferation (). The results of cell cycle analysis also supported those of [3H]thymidine incorporation and cell number count, showing increased S-phase upon overexpression of tRNALeu CAG ().
Figure 1. Overexpression of tRNAs enhanced the cell proliferation. (A) Relative levels (percentage) of cell number, thymidine incorporation, and methionine incorporation after overexpression of each tRNA were compared with those in EV (empty vector)-transfected control. Values are presented as means ± standard deviations (n = 3). *, P < 0.05; ***, P < 0.001. (B) Change in cell cycle after tRNA transfection was compared with that in control. (C) Real-time proliferation of HEK 293T cells transfected with different tRNAs was monitored under different culture conditions. Values are presented as means ± standard errors (n = 9). Values for tRNALeu CAG and negative control (NC) are repeated in all the graphs for the comparison. Cell viability was calculated as the relative percentage of confluency. CM, complete media; SF, serum free; AA, amino acids.
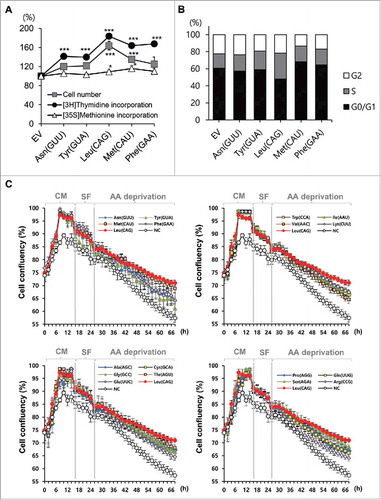
As there are at least 20 tRNA isotypes that are charged by different amino acids, we compared the effect of overexpression of the different tRNA isotypes. We transfected each tRNA isotype into cells and monitored the cell growth in real time using the Incucyte Live Cell Analysis System. All the HEK 293T cells transfected with the different tRNA isotypes showed enhanced proliferation, compared with the negative control, under sufficient nutrition conditions, even under serum-free (SF) conditions (). Very little difference was observed among the tRNA isotypes. However, under amino acid starvation, the isotypes of the overexpressed tRNAs seemed to have different effects on the resistance of cells to death; the cells overexpressing tRNALeu CAG showed the highest viability (). Based on the expression levels of tRNA investigated by qRT-PCR (Table S2, Fig. S1B), the highest expression level did not correspond to the highest cell viability, suggesting that the effect on cell proliferation was unique for each tRNA isotype.
tRNALeu increases phosphorylation of 90-kDa RPS6K under amino acid starvation
After observing the effect of tRNALeu on cell proliferation, we decided to explore the relationship between tRNALeu and the mTOR pathway, because the mTOR pathway is known to control amino acid signaling, cell proliferation, and cell cycle regulation.Citation30-Citation32 In addition, leucyl-tRNA synthetase (LRS), which uses tRNALeu as the substrate, has also been reported to be a leucine sensor of mTOR,Citation33,Citation34 which is another reason to explore the relation between tRNALeu and the mTOR pathway. Therefore, we investigated the phosphorylation of p70 S6K and 4E-BP (eukaryotic translation initiation factor 4E binding protein), both of which are key effectors of mTOR signaling.Citation23,Citation35 Interestingly, the overexpression of tRNAs (Fig. S2A) had very little effect on the phosphorylation of 4E-BP and p70 S6K (70 kDa), whereas phosphorylation was clearly detected in the 90-kDa-sized protein using a specific antibody against p70 S6K phosphorylated at T389 (). We harvested the cells 48 h after subculture without changing the medium, where almost all amino acid had been consumed. To avoid the effect of amino acids, the experiment was performed under amino acid starvation. As expected, we detected induced phosphorylation in the 90-kDa-sized protein (p90 protein) under amino acid depletion, whereas in the presence of amino acids, phosphorylation was induced in the p90 protein even in the EV (empty vector)-transfected cells (). These results suggested that tRNA-mediated induction of phosphorylation would require uncharged tRNAs. Since tRNALeu CAG was the strongest inducer of p90 protein phosphorylation, we incubated cells in a leucine-depleted medium, and found that the p90 protein phosphorylation was induced by overexpression of tRNALeu CAG only when leucine was absent (). The absence of amino acids was not a cue for the transcriptional induction of tRNAs (Fig. S2B), indicating that the effect of tRNALeu had originated from the already overexpressed free tRNALeu CAG. All these data emphasized again that free surplus tRNAs had the ability to induce p90 protein phosphorylation in the absence of amino acids, and tRNALeu was the most sensitive responder or the strongest inducer.
Figure 2. Overexpression of tRNALeu induced the phosphorylation of 90-kDa RPS6K under amino acid starvation. (A and B) Western blot analysis of HEK 293T cells transfected with different tRNAs. Phosphorylation of S6K and 4E-BP, P-S6K and P-4E-BP, respectively, were analyzed without media change (A) and after incubation under amino acid-deprivation for 3 h as well as after addback of amino acids and further incubation for 1.5 h (B). Phosphorylation signals in the 90-kDa (p90) and 70-kDa (p70) sizes detected by p70 S6K specific antibody (P-S6K) are shown. tRNA-like pseudo RNA was also included. −AA, amino acid starvation; +AA, amino acid supplementation. Tubulin, total S6K, or total 4E-BP were used as controls. (C) P-S6K was analyzed via western blot with HEK 293T cell lysates transfected with tRNA for 24 h, and then incubated with leucine-free media for 3 h. (D) Western blot and RT-PCR analyses for the cell lysates transfected with tRNALeu isotypes. Two tRNALeu AAG vectors with different flanking sequences, but the same tRNA gene, were included. P-S6K and ERK phosphorylation (P-ERK) were detected after overexpression of each tRNA. Tubulin and GAPDH were used as controls. (E) Western blot analysis for the tRNALeu CAG-overexpressing cell lysates transfected with tRNALeu CAG-specific siRNA (si-Leu). Two different si-Leu sequences were used here. −AA, amino acid starvation; +AA, amino acid supplementation. (F) Gel shift assay to monitor the formation of the complex between tRNALeu CAG and si-Leu. si-Cont, si-Control.
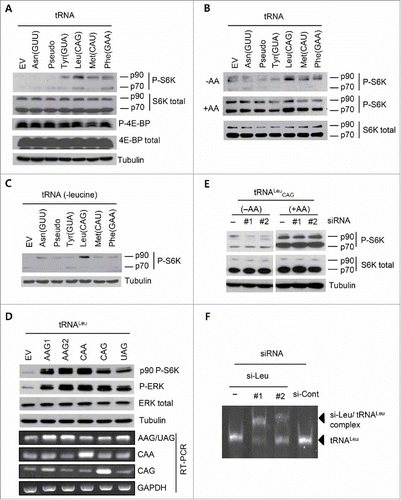
We wondered whether the observed effect of tRNALeu CAG would be common among the isoacceptors. We transfected 4 different tRNALeu isoacceptors, tRNALeu CAG, tRNALeu CAA, tRNALeu AAG, and tRNALeu UAG, and examined p90 protein phosphorylation. All tRNALeu isoacceptors were found to enhance the phosphorylation, although tRNALeu UAG seemed to have the least effect (). We next designed siRNAs (small interfering RNA) specific to tRNALeu CAG (si-Leu) and introduced them into the tRNALeu CAG-overexpressing cells. Treatment with si-Leu reduced the tRNALeu CAG-mediated phosphorylation in response to amino acid deprivation, but was not effective in the presence of amino acids (), suggesting that tRNALeu CAG was not a major inducer for p90 protein phosphorylation in the presence of amino acids. We synthesized tRNALeu CAG through in vitro transcription, and performed native PAGE (polyacrylamide gel electrophoresis) after incubating tRNALeu CAG with si-Leu and si-control RNAs. tRNALeu CAG formed a complex only with si-Leu, resulting in a size shift (), suggesting that si-Leu treatment might have disturbed the generation of mature tRNALeu CAG or the formation of secondary structures in the cells; however, we still do not know whether it induced tRNA decay via conventional RNA-degrading pathways. We compared tRNALeu CAG with other tRNAs and confirmed that tRNALeu CAG was the most efficient in inducing p90 protein phosphorylation (Fig. S2C & S2D).
Mature tRNALeu increases the phosphorylation of 90-kDa RPS6K, and it is independent of mTOR activation
As many studies have suggested different functions of tRFs,Citation8,Citation9,Citation11,Citation28,Citation36,Citation37 we performed northern blotting to check whether the overexpression of tRNALeu would generate corresponding fragments. We used 30-bp radioactive probes to detect the 3 mature isoacceptors of tRNALeu as well as their 3′ and 5′ end-derived fragments. As shown in , a short exposure revealed the overexpression of tRNALeu, compared with the EV-transfected cells. After a long exposure, we detected the 3′ and 5′ fragments of each tRNA in the HeLa cells used as positive controls for tRF detection. However, only very little difference was observed in the detectable tRFs in the HEK 293T cells, regardless of tRNALeu overexpression (). These results indicated that the transfection of tRNA vectors generated a sufficient amount of mature tRNALeu without digestion, and this mature tRNALeu functioned as inducers for the p90 protein phosphorylation.
Figure 3. Phosphorylation of 90-kDa RPS6K was mediated by mature tRNALeu, and it was independent of mTOR activation. (A) Northern blot analysis to detect both mature tRNALeu and its tRFs with 5′ and 3′ radioactive short probes. Expression levels of tRNAs in HEK 293T cells after tRNALeu transfection under different culture conditions were compared with that in the controls. Arrows show the mature tRNA. Upper, short exposure; middle, long exposure; and bottom, EtBr staining of the gel to visualize the loading amounts of total RNA. HeLa cells were used as controls for tRFs. (B and C) Western blot analysis to investigate the effect of LRS knockdown (B) or rapamycin treatment (C) on the tRNA-mediated p90 RPS6K phosphorylation.
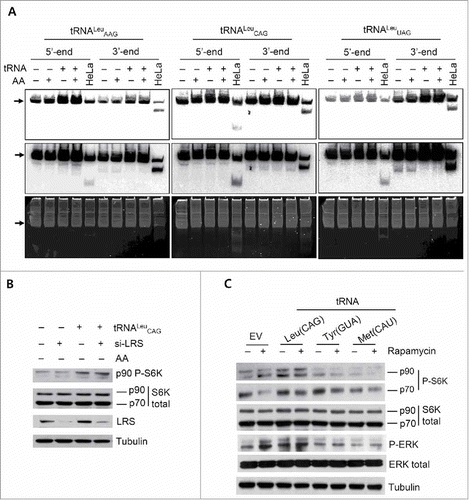
Next, we investigated the possible relationship between tRNALeu CAG and LRS, as well as mTOR. Knockdown of LRS did not affect the level of tRNALeu-induced p90 protein phosphorylation (). When rapamycin, an mTOR inhibitor, was added to the tRNALeu-overexpressing cells, the level of p90 protein phosphorylation was not reduced (). These results suggested that p90 protein phosphorylation required the overexpression of mature tRNALeu, and this step was not controlled by LRS or mTOR.
RSK1 and MSK2 are the p90 RPS6K whose phosphorylation was induced by tRNALeu overexpression
Endogenous S6K1 exists in two isoforms, p70 S6K and p85 S6K.Citation24,Citation30 Initially, we assumed that the p90 protein that we were monitoring was the p85 S6K; however, we had to rule out p85 S6K due to its reactivity to mTOR, unlike the p90 protein of our interest. While searching for other candidates, we came upon a report on RSK and MSK. The authors had detected RSK phosphorylation at S380 by an anti-phosphorylation antibody specific to p70 S6K ().Citation24 They also investigated the induction of phosphorylation of RSK and MSK under amino acid supplementation, although they did not consider the effect of tRNA overexpression.
Figure 4. RSK1 and MSK2 were the 90-kDa RPS6K phosphorylated by tRNALeu CAG overexpression. (A) Sequence alignment of 8 different RPS6 family kinases. The hydrophobic motif and representative phosphorylation sites are shown in gray and indicated by arrows, respectively. The 502 aa and 525 aa sizes in S6K1 indicate p70 S6K and p85 S6K, respectively. (B and C) Effect of tRNA overexpression on the ERK phosphorylation (B) and qRT-PCR analysis to detect tRNA overexpression (C). Values are presented as means ± standard deviations (n = 3). (D) The effect of ERK (U0126), p38 MAPK (SB203580), and JNK (SP600125) inhibitors on the tRNALeu CAG-mediated p90 RPS6K phosphorylation. (E-G) Western blot analysis for the phosphorylation of RPS6K after overexpression of tRNALeu and the different RPS6 family kinases (E), after siRNA transfection specific to p85 S6K and RSK1 (F) as well as RSK2 and MSK2 (G).
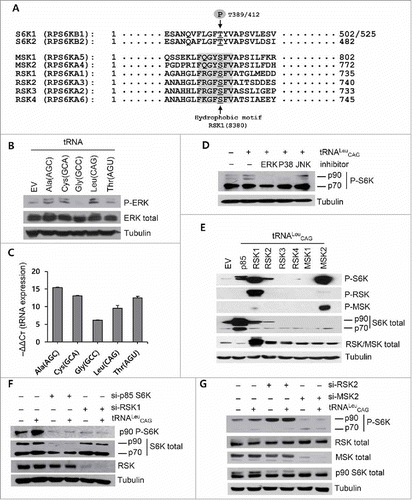
As mentioned before, RSK and MSK are one of the RPS6K, and are activated by ERK (extracellular signal-regulated kinases) and p38 MAPK (mitogen-activated protein kinase).Citation38,Citation39 Therefore, we investigated the activation of ERK as well as the effect of ERK and p38 MAPK inhibitors on the p90 protein phosphorylation. ERK was activated in the presence of surplus tRNAs (, ). The tRNALeu-mediated p90 protein phosphorylation was blocked by ERK and p38 MAPK inhibitors, but not by the JNK inhibitor ().
There were seven candidate proteins for the p90 RPS6K based on the size and sequence homology ().Citation24,Citation39 We transfected p85 S6K, 4 RSKs, and 2 MSKs into HEK 293T cells, along with tRNALeu, and monitored their levels of phosphorylation. We found that p85 S6K, RSK1, and MSK2 were ideal candidates for the p90 protein; the tRNALeu-mediated activation of these proteins was confirmed by detection with specific antibodies (). Although p90 protein phosphorylation was detected in RSK2-transfected cells, it was not detected with antibodies specific to RSK phosphorylation (P-RSK); therefore, we excluded it from serious consideration. We knocked down p85 S6K, RSK1, RSK2, and MSK2 using siRNAs and confirmed that p85 S6K, RSK1, and MSK2 were the real effectors of tRNALeu overexpression ( & ). We used two different sequences of siRNA for the specific depletion of RSK2; neither of them worked well, resulting in very little knockdown effect on RSK2 protein level; we were therefore forced to postpone our conclusion for RSK2.
Taken together, these results suggested that p85 S6K, RSK1, and MSK2 were the p90 proteins whose phosphorylation was induced by tRNALeu overexpression. Considering that tRNALeu-mediated phosphorylation was not affected by mTOR, RSK1 and MSK2 seemed to be the major effectors, rather than p85 S6K.
EBP1 (ErbB3-binding protein 1) is the binding partner of uncharged tRNALeu
Overexpression of tRNALeu also increased the phosphorylation of ERK, an upstream regulator of RSK, implying that tRNALeu had a role in the upper region of the signal cascade. To understand how tRNALeu mediated RSK1 and MSK2 signaling, we performed SILAC (stable isotope labeling by/with amino acids in cell culture) and mass spectrometry analysis to identify the tRNALeu-interacting proteins. For this, we synthesized human tRNALeu CAG in vitro and tagged it with biotin-Phe-DBE (dinitrobenzyl ester) using flexizyme.Citation40 We prepared cell lysates under amino acid starvation, mixed it with the biotinylated tRNALeu CAG, and incubated them together (). Among the co-immunoprecipitated proteins analyzed with LC-MS/MS (liquid chromatography-tandem mass spectrometry) (), we were interested in EBP1, because it was the most enriched protein in the tRNALeu CAG-protein complex except for the RNA helicase-similar protein and it is known to be an RNA/DNA binding protein as well as an ErbB3-binding protein.Citation41-Citation43 To confirm the data obtained from mass spectrometry, we immunoprecipitated EBP1 from the HEK 293T cell lysates harvested after amino acid starvation, and then isolated bound RNAs from the immunoprecipitated beads. We detected several tRNAs from the purified RNA through RT-PCR and qRT-PCR in 2 independent experiments ( and Fig. S3), proving that EBP1 could interact with tRNAs. We investigated direct interactions between EBP1 and radioactively synthesized tRNALeu CAG through non-denaturing PAGE. EBP1 and tRNALeu CAG formed a complex, showing a size-shifted band in a dose-dependent manner ().
Figure 5. Interaction between EBP1 (ErbB3-binding protein 1) and tRNALeu. (A) Schematic diagram for the process of SILAC and LC-MS/MS analysis. Synthesized tRNALeu CAG was biotinylated by incubation with biotin-Phe-DME and flexizyme. After isolating the tRNALeu CAG-associated protein complexes via biotin-streptavidin interaction, the proteins were analyzed by LC-MS/MS. F, Phenylalanine. (B) qRT-PCR analysis to detect the tRNAs associated with immunoprecipitated EBP1 from the HEK 293T cells incubated in amino acid-free media. Values are presented as means ± standard deviations (n = 3). (C) Gel shift assay to detect the formation of the complex between EBP1 and radioactively synthesized tRNALeu CAG. (D) Western blot analysis for the ErbB3 signal pathway of MCF10A cell lines transfected with tRNALeu. −AA, amino acid starvation; +AA, amino acid supplementation.
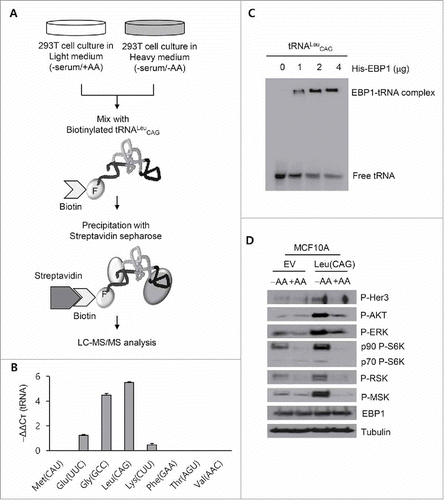
Table 1. LC-MS/MS analysis of tRNALeu CAG-binding proteins.
EBP1 is a DNA- and RNA-binding protein that induces cell cycle arrest by suppressing the transcription of proliferation-associated genes.Citation41 It also suppresses ErbB3 when EBP1 binds to it.Citation42 ErbB3 is an epidermal growth factor receptor (EGFR), and is activated by various growth signals and other EGFR family proteins such as ErbB2. The interactions between EBP1 and ErbB3 are disrupted by the ErbB ligand, heregulin, causing nuclear translocation of EBP1.Citation44 In addition, the overexpression of EBP1 disrupts the ErbB2 and ErbB3 heterodimer, resulting in the inhibition of heregulin-mediated proliferation.Citation44 Interestingly, RSK and MSK are downstream molecules of ErbB2 and ErbB3 signaling pathway, and heregulin causes increased or prolonged signaling through AKT, ERK, RSK, and MSK cascades.Citation39,Citation42 RSK and MSK were phosphorylated by tRNALeu overexpression, without growth stimuli such as serum or amino acids. We therefore hypothesized that free tRNALeu could induce the disruption of the interaction between EBP1 and ErbB3, leading to the inactivation of ErbB3 and/or ErbB2. To verify this, we used the MCF10A cell line which expresses endogenous ErbB2 and ErbB3.Citation45 As expected, the phosphorylation of ErbB3, AKT, ERK, RSK, and MSK were all strongly induced by tRNALeu CAG overexpression under amino acid starvation (), indicating a possible link between tRNALeu-EBP1-ERBB3 and RSK/MSK.
Stable overexpression of tRNALeu and its correlation to Her2 (ErbB2)-positive breast cancer
We prepared NIH3T3 MEF (mouse embryonic fibroblast) cells that stably overexpressed tRNALeu CAG to check whether the effects of tRNALeu CAG were persistent. We used a site-specific recombinase technology to introduce ectopic tRNALeu CAG into the genomic region.Citation46 Thus, the selection marker, blasticidin, of EV was replaced with a cassette containing hygromycin (selection marker) and tRNALeu CAG, ruling out the variations caused by random insertions. The stable tRNALeu CAG-expressing cell line showed faster growth and resistance to cell death than the stable EV-expressing cell line under normal as well as amino acid-depleted conditions (, Fig. S4A & S4B). The investigation of the signaling pathway also revealed that the stable expression of tRNALeu CAG induced RAF, ERK, and p38 MAPK activation, as well as RAS/MSK activation under amino acid starvation (, ). It is worth noting that the tRNALeu CAG-expressing stable cell line was becoming increasingly more dependent on RSK activation, even under normal conditions such as complete medium (CM) culture conditions ().
Figure 6. Characteristics of stable tRNALeu CAG-overexpressing cells. (A) Real-time monitoring of the proliferation of stable NIH3T3 MEF cells expressing tRNALeu CAG. Values are presented as means ± standard deviations (n = 9). (B and C) Western blot analysis of the stable NIH3T3 MEF cells under different culture conditions. Activation of RSK and MSK signaling was compared under SF (serum free) and −AA (amino acid starvation) (B) or under CM (complete media) and −AA (amino acid starvation) conditions (C). (D) Levels of the different tRNALeu isotypes in several cancer cell lines were analyzed using qRT-PCR and then compared with those in normal cell lines (CCD18C0, NHA, M13SV1, and WI-26). Values are presented as means ± standard deviations (n = 3). (E) Comparison of RSK and MSK signaling between MCF7 and BT20 cell lines under amino acid-deprived conditions (−AA).
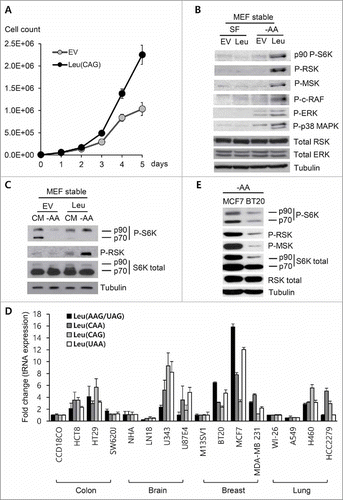
RSK and MSK signaling is important for the maintenance and the malignancy of breast cancer, prostate cancer, and lung cancer, and its upstream molecules, ErbB2 and ErbB3, are also implicated in the causation or sustenance of various cancers, especially breast cancer.Citation38,Citation42,Citation47 We therefore investigated the tRNALeu expression levels in normal and cancer cell lines, based on the tissue origin. According to the results, almost all tRNALeu isoacceptors tested were more highly expressed in cancer cell lines than in normal cells, irrespective of the tissue type (). We chose 2 breast cancer cell lines, MCF7 and BT20, and investigated the activation statuses of RSK and MSK. Interestingly, MCF7, with higher levels of tRNALeu isoacceptors, showed stronger phosphorylation of RSK and MSK than BT20 ().
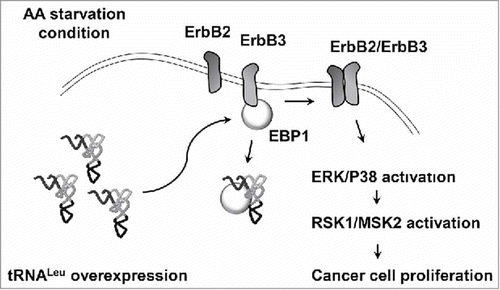
To investigate the possible implications of tRNALeu for human cancers, we analyzed the expression levels of tRNALeu isoacceptors in 95 samples from patients with breast cancer. We investigated the correlation between tRNALeu expression and breast cancer subtypes, expecting the upregulation of tRNALeu in Her2 (ErbB2)-positive breast cancers. ErbB3 usually forms a heterodimer with ErbB2, with a positive correlation between the two molecules,Citation48 and overexpression of tRNALeu might contribute to the strength of the ErbB2 signaling. Based on the analysis, tRNALeu isoacceptors such as tRNALeu CAA, tRNALeu AAG, and/or tRNALeu UAG were significantly increased in the Her2 subtype, but not in other subtypes (). tRNALeu AAG and tRNALeu UAG could not be distinguished, because the same primers detected both isoacceptors simultaneously. This result suggested the possibility that tRNALeu overexpression might be implicated in ErbB2-mediated tumourigenesis via interacting with EBP1 and subsequently activating the RSK1/MSK2 signaling ().
Table 2. Correlation between ErbB2 and tRNALeu in breast cancer patients' sample.
Figure 7. Schematic representation for the role of free tRNALeu. Under amino acid starvation condition, free tRNALeu interacts with EBP1 and enhances the activation of ErbB2/ErbB2 pathway. Finally, the downstream signaling mediated by RSK1/MSK2 facilitates cancer cell proliferation.
Discussion
Recent studies have revealed the diverse roles of tRNAs and their related fragments, extending the functions of tRNAs beyond that of the canonical translation adaptor molecules.Citation49 These new roles of tRNAs have been observed in prokaryotes as well as eukaryotes, and they are involved in various cellular phenomena, including haeme and chlorophyll biosynthesis, antibiotic cellular permeability, energy metabolism, amino acid biosynthesis and protein degradation, reverse transcription of viruses, cell apoptosis and survival, and cancer progression.Citation4-Citation6,Citation10,Citation37,Citation50-Citation55 In this study, we investigated the novel functions of tRNAs, especially tRNALeu, which promoted cell proliferation via RSK/MSK signaling.
Overexpression of tRNALeu enhanced cell proliferation under amino acid starvation. Given that amino acids are essential for normal cell growth, it is an obscure result. Our data indicated that amino acid starvation would determine the uncharged status of tRNALeu, rather than induce cell proliferation in itself, because the activation of RSK/MSK in this condition was independent of mTOR or LRS (, ). We speculated that the overexpression of tRNALeu would gradually induce the activation of RSK/MSK due to amino acid depletion, even under complete media conditions. As there are many signaling pathways to activate RSK/MSK apart from free tRNAs, it is not surprising that RSK/MSK was phosphorylated when amino acids were added back in the medium, irrespective of tRNAs. Upon re-addition of amino acids, there would be enough tRNAs but they would be dedicated to translation, due to the prolonged starvation period (3 h). This may explain why we could not observe the effect of overexpressed tRNAs in the presence of amino acids.
It is interesting that the transfection of a single tRNA induced such a strong signal transduction and cell phenotype change, when there are more than 500 tRNA genes.Citation2 Other research groups have also reported dramatic and significant effects of single tRNA transfection,Citation4,Citation6,Citation7 and we confirmed the same results in stable NIH3T3 MEF cells, where a single copy of tRNALeu CAG was inserted in the genomic region ( and Fig. S4). This result demonstrated that each copy of the tRNA gene might be essential (for some currently unknown reason), despite seemingly appearing overlapped and redundant with each other. However, the activation of RSK and MSK signaling did not seem to be a unique function of tRNALeu, considering that other tRNA isotypes tested also induced the phosphorylation, although in different degrees (, ). EBP1, a tRNALeu CAG-binder, also interacted with several tRNAs besides tRNALeu ( and Fig. S3). EBP1 has Lysine-rich motif in the C-terminal RNA/DNA-binding domainCitation43 and seems to interact with various RNAs and DNAs, as observed in this study. While all the tRNAs share a similar cloverleaf-like secondary structure, eukaryotic tRNALeu and tRNASer have a long variable arm with more than 10 nucleotides, and these are designated as class II tRNAs.Citation56 The differences in structure and sequence length of tRNALeu might contribute to the interaction with EBP1 and explain why tRNALeu was the strong inducer for the phosphorylation of RSK and MSK, while other tRNAs were not. One or more additional factors, however, seem to be required for the signaling induction, considering that the activation of RSK and MSK was not very responsive to tRNASer overexpression (Fig. S2C). The interaction between tRNALeu and EBP1, and their working mechanism need to be further elucidated.
In conclusion, we suggested that free tRNALeu had a novel function in enhancing RSK and MSK signaling via interaction with EBP1. EBP1 is known to be an ErbB3 suppressor, and our data indicated that tRNALeu overexpression reinforced the ErbB2/ErbB3 pathway. It is worth noting that the expression of several tRNALeu isoacceptors was significantly high in ErbB2-positive patients with breast cancer (). The factor that induced the expression of tRNALeu in ErbB2-positive breast cancers is unclear; however, this observation suggested a possible contribution by tRNALeu to the malignancy of ErbB2-positive breast cancer.
Materials and methods
tRNA cloning and antibodies
We performed PCR to amplify the genomic DNA fragments containing the different representative tRNAs using primer pairs (Table S1 and S2) and genomic DNA purified from HEK 293T as templates. The amplified PCR fragments were cloned into pGEM-T Easy vector (Promega, USA), according to the manufacturer's manual. A tRNAHis GUG gene, which was presented in the old tRNA database (http://gtrnadb2009.ucsc.edu) but was removed out in the new database (http://gtrnadb.ucsc.edu), was designated as a pseudo gene.
Primary antibodies were purchased from Cell Signaling Technology (USA). The antibodies used were phosphor (P)-p70 S6K (#9206), S6K (#9202), P-p90-RSK (#9341), P-MSK (#9591), RSK1/RSK2/RSK3 (#9355), MSK2 (#3679), P-ERK1/2 (#9101), and P-SAPK/JNK (#4668). Anti-tubulin antibody (T-5168) was purchased from Sigma-Aldrich (USA). Secondary antibodies, goat anti-rabbit (31460) and goat anti-mouse (Cat. 31430), were purchased from Thermo Fisher Scientific (USA).
Cell culture, tRNA transfection, and kinase inhibitor treatment
HEK293T, NIH3T3 MEF, CCD18C0, HT29, BT20, MCF7, WI-26, and HCC2279 cells were cultured in Dulbecco's modified Eagle's medium (DMEM) supplemented with 10% fetal bovine serum (FBS) and 1% (100 μg/ml) penicillin and streptomycin (PS) at 37°C in a 5% CO2 incubator. For culturing HCT8, NHA, LN18, U343, U87E4, MDA-MB-231, A549, and H460, RPMI 1640 medium with 10% FBS and 1% PS was used. MCF10A and M13SV1 cells were cultured in media described elsewhere,Citation57 and SW620J cells were cultured in Leibovitz's L-15 medium with 10% FBS and 1% PS. For depletion of methionine, we purchased all the culture media and supplements from Hyclone (USA) and amino acid- or leucine-free media from Welgene Inc. (Korea).
HEK 293T cells were transfected with tRNA-expressing pGEM-T Easy vector using Fugene reagent (Promega, USA) for 24 h. HEK 293T cells were pre-incubated in the amino acid-deprivation medium for 3 h and then treated with rapamycin (100 nM), U0126 (ERK inhibitor) (20 mM), SP600125 (JNK inhibitor) (20 mM), and SB203580 (p38 MAPK) (20 mM) for an additional 1.5 h. All the inhibitors were purchased from Calbiochem (USA).
Real-time monitoring of cell proliferation
HEK 293T cells were seeded in 48-well plates at a density of 6 × 10⁵ cells/well. The next day, cells were transfected with 0.5 µg each of tRNA-expressing pGEM-T Easy vector or EV, using Fugene reagent. Real-time growth was monitored using IncuCyte® Live Cell Analysis System (Essen BioScience, USA). Complete medium in the 48-well plates was replaced with SF medium 12 h after transfection, which was then replaced with amino acid-free medium 10 h after the media change. Cells were incubated in the chamber for an additional two days, and cell growth was monitored during the whole incubation period.
Stable cell line generation
Plasmids that expressed tRNALeu CAG (pHAG010) was prepared by cloning the following PCR products digested with Bgl II and SnaB I into the pHAE057 plasmid that was prepared by replacing the puromycin-resistant gene with the hygromycin-resistant gene and deleting the region between TRE and EGF from the pEM791 plasmid (obtained from Dr. Eugene V. Makeyev, Nanyang Technological University, Singapore). PCR was performed for the tRNA genes, using the forward primer (5′-CACAACAACAGATCTTATGCAGCGCC-3′) and reverse primer (5′-TTTGCTGTCTACGTAGTGGCTAATAA-3′).
Stable cell lines expressing tRNA were generated using recombination-mediated cassette exchange (RMCE) technology, as described previously.Citation46 The pEM584 plasmid (kindly provided by Dr. Eugene V. Makeyev) was first transfected into the NIH3T3 cell line, and colonies resistant to blasticidin S (2.5 μg/ml) were isolated, expanded and used as a control. The genomes of these colonies integrated with the RMCE cassette that contained the human EF-1α promoter and a blasticidin resistance gene (Bsd) “floxed” by the mutually incompatible Cre recombinase-specific sites, Lox2272 and LoxP. The plasmid with the tRNALeu CAG (pHAG010) was then co-transfected with pEM784 (pCAGGS-nlCre) into the blasticidin S-resistant cell lines, and colonies resistant to hygromycin (100 μg/ml) and sensitive to blasticidin S were selected.
Thymidine incorporation
H460 cells were transfected with different tRNA isotypes and 12 h later, cells (5 × 10³) were seeded on 24-well dishes. After 12 h, [3H]thymidine (1 μCi/well, PerkinElmer, USA) was added to the wells and incubated for 4 h. Cells were washed thrice with cold PBS and then treated with 5% cold trichloroacetic acid for 10 min. DNA was then extracted with 0.5 M NaOH and the incorporated thymidine was quantified with a liquid scintillation counter (Wallac, PerkinElmer).
Methionine incorporation assay
H460 cells were transfected with different tRNA isotypes. After incubating in a methionine-free medium (Hyclone) for 30 min, 1 µCi [35S]Met (1175 Ci/mmol, PerkinElmer, USA) was added. After 1 h incubation, cells were washed thrice with cold PBS and the radioactive protein was quantified using a liquid scintillation counter and normalized based on cell number.
Cell cycle analysis with FACS
The cells transfected with each tRNA were harvested by trypsinisation, washed twice with cold PBS, and fixed in 70% ethanol for 2 h at 4°C. After fixation, the cells were washed twice with cold PBS and incubated in 500 μl PI (propidium iodide, Sigma-Aldrich) staining solution (1 × PBS, 100 μg/ml RNase A, and 50 μg/ml PtdIns) for 30 min at 37°C in the dark. The samples were analyzed by flow cytometry (BD Biosciences, USA). The percentage of cells in the G0/G1, S, and G2/M phases was estimated using the Cell Quest acquisition software (BD Biosciences).
Gel electrophoresis and immunoblotting
HEK293T cells were lysed with a protein lysis buffer (25 mM Tris-HCl pH 7.4, 0.5% Tripton X-100, 1 mM EDTA, 0.5 mM EGTA, 10 mM NaCl, 1 mM MgCl2, and 0.1% CHAPS) containing phosphatase inhibitor and protease inhibitor (Calbiochem) for 30 min at 4°C. After lysis and protein concentration measurement, the proteins were separated by SDS-PAGE. The proteins were then semi-dry transferred to polyvinylidenefluoride membranes (Millipore, USA), which were subjected to immunoblotting.
Northern blotting
Total RNA (30 µg) was isolated from tRNA-transfected HEK 293T or HeLa cells with the miRNeasy Mini Kit (Qiagen, USA) and then separated with 6.5% PAGE with 8% urea in 0.5% TBE buffer. After EtBr (ethidium bromide) staining, the gel was transferred onto a nylon membrane with a semi-dry transfer apparatus. The 3′ and 5′ end-specific probes were generated by end-labeling of the DNA oligonucleotides with [γ-32P]ATP using T4 polynucleotide kinase (NEB, USA). Northern hybridization was performed using the BrightStar BioDetect kit (Ambion, USA), and the result was exposed for autoradiography. The sequences of the probes were as follows: Leu(CAG) 5′ end probe, 5′-CAGCGCCTTAGACCGCTCGGCCATCCTGAC-3′; Leu(CAG) 3′ end probe, 5′-TGGTGTCAGGAGTGGGATTCGAACCCACGC-3′; Leu(UAG) 5′ end probe, 5′-CAGCGCCTTAGACCGCTCGGCCACACTACC-3′; Leu(UAG) 3′ end probe, 5′-TGGTGGCAGTGGTGGGATTCGAACCCACGC-3′; Leu(AAG) 5′ end probe, 5′-CAGCGCCTTAGACCGCTCGGCCACGCTACC-3′; and Leu(AAG) 3′ end probe, 5′-TGGTGGCAGCGGTGGGATTCGAACCCACGC-3′.
Semi-quantitative RT-PCR
Total RNA was extracted with miRNeasy Mini kit (Qiagen). From the immunoprecipitated sample, RNA was extracted using the TRIzol reagent (Thermo Fisher). The RNA (2 μg) was reverse-transcribed using M-MLV reverse transcriptase (RT), a random hexamer, dNTP, DTT, and reaction buffer. The mixture was heated at 65°C for 5 min, followed by heating at 37°C for 2 min, 25°C for 10 min, 37°C for 50 min, and finally at 70°C for 15 min. For measuring the overexpressed tRNAs, cDNA was amplified by PCR using specific primers (Table S2) and Taq polymerase under the following thermocyclic conditions: one cycle for denaturing at 95°C for 5 min; 30 cycles of amplification at 95°C for 1 min, 60°C for 30 sec, and 72°C for 30 sec; and one cycle of extension at 72°C for 10 min. The amplified PCR products were separated by electrophoresis on a 6% native polyacrylamide gel with 0.5 × TBE.
Quantitative reverse transcription-polymerase chain reaction (qRT-PCR)
Total RNA extraction and cDNA generation were performed as described in previous sections. The transcript levels of tRNAs (target) and GAPDH and Papola (endogenous references) were determined by qRT-PCR using the POWER SYBR green master mix (Bio-rad) and specific primers (Table S2), according to the manufacturers’ instructions. The fold change of each target or -ΔΔCт were presented relative to those of control samples.
RNA interference
For the siRNA experiments, transfection of siRNA was performed using the lipofectamine 2000 transfection reagent (Invitrogen, USA), according to the manufacturer's guidelines. HEK 293T cells were transfected with siRNA for 48 h. A stealth RNAi negative control, medium GC duplexes (Invitrogen), was used as a control. For knocking down the RSK and MSK genes, RNA interference duplexes corresponding to p85 S6K, RSK1, and MSK2 were synthesized (Invitrogen and ST Pharm Oligo Center, Korea). The siRNA sequences were as follows: si-p85 S6K, 5′-GGAGGCGGGACGGCUUUUACC-3′ and 5′-CAGUGGAGGAGAACUAUUU-3′; si-RSK1, 5′-GGACCAAGAUGGAGAGAGACAUCCU-3′ and 5′-GCUAUACCGUCGUGAGAUC-3′; si-RSK2, 5′-AGUUUACUGAUGGAUAUGAAGUAAA-3′ and 5′-AGAAGAAGAUGUCAAAUUCUACUUG-3′; si-MSK2, 5′-GGCUGCUUUGUAAGGAUCCUAAGAA-3′ and 5′-GAGCGGACCUUCUCCUUCUGU-3′; and si-Leu (si-tRNALeu CAG), 5′-GCUGCGUUCAGGUCGCAGU-3′ and 5′-GGGUUCGAAUCCCACUCCU-3′.
In vitro transcription of tRNA and in vitro aminoacylation using flexizyme
The pGEM-T Easy plasmids containing the tRNALeu CAG sequences were used as templates and amplified by PCR for the in vitro transcription of tRNA sequences using corresponding primer pairs (Table S2) and Pfu polymerase. After gel extraction, in vitro transcription was performed using the Riboprobe® in vitro Transcription Systems (Promega). The residual DNA was digested using DNase I, and the tRNAs were purified by phenol/chloroform precipitation. After rehydration with RNase-free destilled water (DW), tRNA was eluted using Illustra NAP columns (GE Healthcare, USA).
For the in vitro biotinylation of the synthesized tRNA, we generated eFx flexizyme, according to the protocol described previously,Citation40 and thus charged the synthesized tRNA with biotin-Phe-DBE.
Gel shift assay
The mixture of in vitro synthesized tRNA and siRNA was pre-incubated at 70°C for 5 min, slowly cooled down to promote secondary structure formation, and then further incubated at 30°C for 30 min. The tRNA and siRNA mixture was separated by a 6% non-denaturing PAGE with 0.5 × TBE (tris borate EDTA) buffer and stained with EtBr.
For analyzing the tRNA and EBP1 complex, the tRNA was synthesized in vitro using [α-32P]ATP and incubated with EBP1 (Sino Biological, China) at 30°C for 30 min. The reaction mixture was then separated by 6% non-denaturing PAGE with 4% urea in 0.5% TBE buffer. After running the gel, it was dried and exposed for autoradiography.
SILAC and LC-MS/MS analysis
For SILAC mass spectrometry, HEK 293T cells were cultured in the different SILAC media (DMEM without L-arginine and L-lysine (Invitrogen) with 10% dialyzed FBS and 1% PS containing 50 mg/ml L-arginine (Arg0) and L-lysine (Lys0) (light), or 13C615N4-L-arginine (Arg10) and 13C615N2-L-Lysine (Lys8) (heavy) for 7 d (at least 5 passages). After amino acid starvation for 1.5 h, cells were lysed in a buffer (50 mM Tris-HCl [pH 8.0], 150 mM KCl, 1 mM DTT, 10% glycerol, and 0.5% Triton X-100) at 4°C for 30 min. After centrifugation at 10,000 x g for 15 min, the total cell extract was added to the biotinylated tRNALeu CAG, which was immobilized on streptavidin beads. After incubation with constant rotation at 4°C for 4 h, streptavidin-conjugated agarose beads (GE Healthcare) were added and further incubated at 4°C for 2 h. The beads were washed twice with 300 mM KCl buffer (20 mM Tris-Cl [pH 8.0], 300 mM KCl, and 0.2 mM EDTA). The proteins were eluted using a 2 × SDS sample buffer and separated with SDS-PAGE. The areas of the gel with the whole protein were cut into several pieces and were subjected to in-gel digestion with trypsin (Promega). LC-MS/MS analysis of eluted peptides was performed by a linear trap quadrupole (LTQ)-Orbitrap Velos mass spectrometer (Thermo Fisher Scientific).
All MS/MS samples were analyzed using Sequest (Thermo Fisher Scientific, version 1.3.0.339). Sequest was set up to search ipi.HUMAN.v3.87.fasta (unknown version, 91464 entries) assuming the digestion enzyme trypsin. Iodoacetamide derivative of cysteine was specified in Sequest as a fixed modification. Deamidation of asparagine and glutamine, C13 label of lysine, C13 and N15 label of arginine, oxidation of methionine, acetylation of lysine and phosphorylation of serine, threonine and tyrosine were specified in Sequest as variable modifications. Scaffold Q+ (version Scaffold 4.7.5, Proteome Software Inc., Portland, OR) was used to quantitate label based quantitation (SILAC) peptide and protein identifications. Peptide identifications were accepted if they could be established at greater than 95.0% probability by the Peptide Prophet algorithm.Citation58 Protein identifications were accepted if they could be established at greater than 99.0% probability and contained at least two identified peptides. Protein probabilities were assigned by the Protein Prophet algorithm.Citation59 Proteins that contained similar peptides and could not be differentiated based on MS/MS analysis alone were grouped to satisfy the principles of parsimony. Normalization was performed iteratively (across samples and spectra) by subtracting the average ratios in log-space. Means were used for averaging. Spectra data were log-transformed, pruned of those matched to multiple proteins, and weighted by an adaptive intensity-weighting algorithm. Of 7,915 spectra in the experiment at the given thresholds, 3,430 (43%) were included in quantitation.
Population of patients with breast cancer and immunohistochemistry staining
Patients diagnosed with primary tumors of the breast and with available clinical and pathological data were selected for this study. Immunohistochemical assessment of estrogen receptor (ER) and progesterone receptor (PR) were performed by an experienced pathologist, using antibodies against ER (1DO5; DAKO, Denmark) and PR (PgR626, DAKO), respectively. The HER2 membranous staining was scored on a scale of 0 to 3+, according to the HercepTest protocol (DAKO). For tissue samples with a HER2 staining score of 2+, additional testing for HER2 was performed using fluorescence in situ hybridization (FISH). The HER2 status was considered positive if the IHC score was 3+ or the gene copy ratio of HER2/CEP17 was more than 2.2.
Tumor samples
Ninety-five primary tumor samples were obtained from breast cancer surgical specimens immediately after resection. Tumor blocks were harvested in gross from the tumor cores and stored in nitrogen tanks at a tissue bank (Laboratory of Breast Cancer Biology, Seoul National University College of Medicine, Seoul, Korea). Informed consent was obtained from all the participants before sampling, and the study was approved by the Institutional Review Board of Seoul National University Hospital (IRB No 1405–088–580, 1704–051–844). Total RNA was extracted from the tissues and used for the analysis of tRNALeu isotypes by qRT-PCR, as mentioned in previous sections.
Statistical analysis of patient data
Independent t-tests and one-way ANOVA analyses were performed to compare the average amounts of tRNALeu isotypes for the different experiments. All statistical analyses were performed using the SPSS Version 23.0 software. Statistical significance was assumed if P < 0.05.
Disclosure of potential conflicts of interest
No potential conflicts of interest were disclosed.
Supplemental_Materials.zip
Download Zip (520 KB)Acknowledgments
This research was jointly supported by the Korea Health Technology R&D Project through the Korea Health Industry Development Institute (KHIDI) funded by the Ministry of Health & Welfare (HI13C21480301 [N.H.K]), the Global Frontier (NRF-M3A6A4–2010–0029785 [S.K.] and NRF-2015M3A6A4065724 [N.H.K]) National Research Foundation funded by the Ministry of Science, ICT & Future Planning (MSIP) of Korea, and a grant from Gyeonggi Research Development Program [S.K.].
We would like to thank Dr. Horoaki Suga for sharing the materials required for eFx synthesis and in vitro biotinylation of tRNA and Dr. Eugene V. Makeyev for providing pEM791 and pEM584 plasmids.
Related Research Data
References
- Kim S, You S, Hwang D. Aminoacyl-tRNA synthetases and tumorigenesis: More than housekeeping. Nat Rev Cancer. 2011;11:708-718. doi:10.1038/nrc3124
- Iben JR, Maraia RJ. tRNA gene copy number variation in humans. Gene. 2014;536:376-384. doi:10.1016/j.gene.2013.11.049
- Goodenbour JM, Pan T. Diversity of tRNA genes in eukaryotes. Nucleic Acids Res. 2006;34:6137-6146. doi:10.1093/nar/gkl725
- Goodarzi H, Nguyen HC, Zhang S, Dill BD, Molina H, Tavazoie SF. Modulated expression of specific tRNAs drives gene expression and cancer progression. Cell. 2016;165:1416-1427. doi:10.1016/j.cell.2016.05.046
- Mei Y, Yong J, Liu H, Shi Y, Meinkoth J, Dreyfuss G, Yang X. tRNA binds to cytochrome c and inhibits caspase activation. Mol Cell. 2010;37:668-678. doi:10.1016/j.molcel.2010.01.023
- Birch J, Clarke CJ, Campbell AD, Campbell K, Mitchell L, Liko D, Kalna G, Strathdee D, Sansom OJ, Neilson M, et al. The initiator methionine tRNA drives cell migration and invasion leading to increased metastatic potential in melanoma. Biol Open. 2016;5:1371-1379. doi:10.1242/bio.019075
- Pavon-Eternod M, Gomes S, Rosner MR, Pan T. Overexpression of initiator methionine tRNA leads to global reprogramming of tRNA expression and increased proliferation in human epithelial cells. RNA. 2013;19:461-466. doi:10.1261/rna.037507.112
- Kumar P, Mudunuri SB, Anaya J, Dutta A. tRFdb: A database for transfer RNA fragments. Nucleic Acids Res. 2015;43:D141-5. doi:10.1093/nar/gku1138
- Ivanov P, Emara MM, Villen J, Gygi SP, Anderson P. Angiogenin-induced tRNA fragments inhibit translation initiation. Mol Cell. 2011;43:613-623. doi:10.1016/j.molcel.2011.06.022
- Ivanov P, O'Day E, Emara MM, Wagner G, Lieberman J, Anderson P. G-quadruplex structures contribute to the neuroprotective effects of angiogenin-induced tRNA fragments. Proc Natl Acad Sci U S A. 2014;111:18201-18206. doi:10.1073/pnas.1407361111
- Honda S, Loher P, Shigematsu M, Palazzo JP, Suzuki R, Imoto I, Rigoutsos I, Kirino Y. Sex hormone-dependent tRNA halves enhance cell proliferation in breast and prostate cancers. Proc Natl Acad Sci U S A. 2015;112:E3816-25. doi:10.1073/pnas.1510077112
- Cole C, Sobala A, Lu C, Thatcher SR, Bowman A, Brown JW, Green PJ, Barton GJ, Hutvagner G. Filtering of deep sequencing data reveals the existence of abundant dicer-dependent small RNAs derived from tRNAs. RNA. 2009;15:2147-2160. doi:10.1261/rna.1738409
- Haussecker D, Huang Y, Lau A, Parameswaran P, Fire AZ, Kay MA. Human tRNA-derived small RNAs in the global regulation of RNA silencing. RNA. 2010;16:673-695. doi:10.1261/rna.2000810
- Pavon-Eternod M, Gomes S, Geslain R, Dai Q, Rosner MR, Pan T. tRNA over-expression in breast cancer and functional consequences. Nucleic Acids Res. 2009;37:7268-7280. doi:10.1093/nar/gkp787
- Marshall L, White RJ. Non-coding RNA production by RNA polymerase III is implicated in cancer. Nat Rev Cancer. 2008;8:911-914. doi:10.1038/nrc2539
- Zouridis H, Hatzimanikatis V. Effects of codon distributions and tRNA competition on protein translation. Biophys J. 2008;95:1018-1033. doi:10.1529/biophysj.107.126128
- Gustafsson C, Govindarajan S, Minshull J. Codon bias and heterologous protein expression. Trends Biotechnol. 2004;22:346-353. doi:10.1016/j.tibtech.2004.04.006
- dos Reis M, Savva R, Wernisch L. Solving the riddle of codon usage preferences: A test for translational selection. Nucleic Acids Res. 2004;32:5036-5044. doi:10.1093/nar/gkh834
- Qian W, Yang JR, Pearson NM, Maclean C, Zhang J. Balanced codon usage optimizes eukaryotic translational efficiency. PLoS Genet. 2012;8:e1002603. doi:10.1371/journal.pgen.1002603
- Subramaniam AR, Pan T, Cluzel P. Environmental perturbations lift the degeneracy of the genetic code to regulate protein levels in bacteria. Proc Natl Acad Sci U S A. 2013;110:2419-2424. doi:10.1073/pnas.1211077110
- Gingold H, Tehler D, Christoffersen NR, Nielsen MM, Asmar F, Kooistra SM, Christophersen NS, Christensen LL, Borre M, Sørensen KD, et al. A dual program for translation regulation in cellular proliferation and differentiation. Cell. 2014;158:1281-1292. doi:10.1016/j.cell.2014.08.011
- Pardo OE, Seckl MJ. S6K2: The neglected S6 kinase family member. Front Oncol. 2013;3:191. doi:10.3389/fonc.2013.00191
- Berven LA, Crouch MF. Cellular function of p70S6K: A role in regulating cell motility. Immunol Cell Biol. 2000;78:447-451. doi:10.1046/j.1440-1711.2000.00928.x
- Casas-Terradellas E, Tato I, Bartrons R, Ventura F, Rosa JL. ERK and p38 pathways regulate amino acid signalling. Biochim Biophys Acta. 2008;1783:2241-2254. doi:10.1016/j.bbamcr.2008.08.011
- Reinhard C, Thomas G, Kozma SC. A single gene encodes two isoforms of the p70 S6 kinase: Activation upon mitogenic stimulation. Proc Natl Acad Sci U S A. 1992;89:4052-4056. doi:10.1073/pnas.89.9.4052
- Geiduschek EP, Kassavetis GA. The RNA polymerase III transcription apparatus. J Mol Biol. 2001;310:1-26. doi:10.1006/jmbi.2001.4732
- Dieci G, Fiorino G, Castelnuovo M, Teichmann M, Pagano A. The expanding RNA polymerase III transcriptome. Trends Genet. 2007;23:614-622. doi:10.1016/j.tig.2007.09.001
- Sharma U, Conine CC, Shea JM, Boskovic A, Derr AG, Bing XY, Belleannee C, Kucukural A, Serra RW, Sun F, et al. Biogenesis and function of tRNA fragments during sperm maturation and fertilization in mammals. Science. 2016;351:391-396. doi:10.1126/science.aad6780
- Lee YS, Shibata Y, Malhotra A, Dutta A. A novel class of small RNAs: tRNA-derived RNA fragments (tRFs). Genes Dev. 2009;23:2639-2649. doi:10.1101/gad.1837609
- Fingar DC, Blenis J. Target of rapamycin (TOR): An integrator of nutrient and growth factor signals and coordinator of cell growth and cell cycle progression. Oncogene. 2004;23:3151-3171. doi:10.1038/sj.onc.1207542
- Laplante M, Sabatini DM. mTOR signaling at a glance. J Cell Sci. 2009;122:3589-3594. doi:10.1242/jcs.051011
- Meijer AJ, Codogno P. Nutrient sensing: TOR's ragtime. Nat Cell Biol. 2008;10:881-883. doi:10.1038/ncb0808-881
- Han JM, Jeong SJ, Park MC, Kim G, Kwon NH, Kim HK, Ha SH, Ryu SH, Kim S. Leucyl-tRNA synthetase is an intracellular leucine sensor for the mTORC1-signaling pathway. Cell. 2012;149:410-424. doi:10.1016/j.cell.2012.02.044
- Lee JH, Cho US, Karin M. Sestrin regulation of TORC1: Is sestrin a leucine sensor? Sci Signal. 2016;9:re5. doi:10.1126/scisignal.aaf2885
- Hay N, Sonenberg N. Upstream and downstream of mTOR. Genes Dev. 2004;18:1926-1945. doi:10.1101/gad.1212704
- Hanada T, Weitzer S, Mair B, Bernreuther C, Wainger BJ, Ichida J, Hanada R, Orthofer M, Cronin SJ, Komnenovic V, et al. CLP1 links tRNA metabolism to progressive motor-neuron loss. Nature. 2013;495:474-480. doi:10.1038/nature11923
- Goodarzi H, Liu X, Nguyen HC, Zhang S, Fish L, Tavazoie SF. Endogenous tRNA-derived fragments suppress breast cancer progression via YBX1 displacement. Cell. 2015;161:790-802. doi:10.1016/j.cell.2015.02.053
- Lara R, Seckl MJ, Pardo OE. The p90 RSK family members: Common functions and isoform specificity. Cancer Res. 2013;73:5301-5308. doi:10.1158/0008-5472.CAN-12-4448
- Anjum R, Blenis J. The RSK family of kinases: Emerging roles in cellular signalling. Nat Rev Mol Cell Biol. 2008;9:747-778. doi:10.1038/nrm2509
- Goto Y, Katoh T, Suga H. Flexizymes for genetic code reprogramming. Nat Protoc. 2011;6:779-790. doi:10.1038/nprot.2011.331
- Zhang Y, Hamburger AW. Heregulin regulates the ability of the ErbB3-binding protein Ebp1 to bind E2F promoter elements and repress E2F-mediated transcription. J Biol Chem. 2004;279:26126-26133. doi:10.1074/jbc.M314305200
- Sithanandam G, Anderson LM. The ERBB3 receptor in cancer and cancer gene therapy. Cancer Gene Ther. 2008;15:413-448. doi:10.1038/cgt.2008.15
- Monie TP, Perrin AJ, Birtley JR, Sweeney TR, Karakasiliotis I, Chaudhry Y, Roberts LO, Matthews S, Goodfellow IG, Curry S. Structural insights into the transcriptional and translational roles of Ebp1. EMBO J. 2007;26:3936-3944. doi:10.1038/sj.emboj.7601817
- Zhang Y, Akinmade D, Hamburger AW. Inhibition of heregulin mediated MCF-7 breast cancer cell growth by the ErbB3 binding protein EBP1. Cancer Lett. 2008;265:298-306. doi:10.1016/j.canlet.2008.02.024
- Beerli RR, Graus-Porta D, Woods-Cook K, Chen X, Yarden Y, Hynes NE. Neu differentiation factor activation of ErbB-3 and ErbB-4 is cell specific and displays a differential requirement for ErbB-2. Mol Cell Biol. 1995;15:6496-6505. doi:10.1128/MCB.15.12.6496
- Khandelia P, Yap K, Makeyev EV. Streamlined platform for short hairpin RNA interference and transgenesis in cultured mammalian cells. Proc Natl Acad Sci U S A. 2011;108:12799-12804. doi:10.1073/pnas.1103532108
- Landemaine T, Jackson A, Bellahcene A, Rucci N, Sin S, Abad BM, Sierra A, Boudinet A, Guinebretière JM, Ricevuto E, et al. A six-gene signature predicting breast cancer lung metastasis. Cancer Res. 2008;68:6092-6099. doi:10.1158/0008-5472.CAN-08-0436
- Lee KS, Koo JY, Chung HC, Suh CO, Lee HD, Lee BC, Jung WH, Yang WI. Immunohistochemical expression of c-erbB2, c-erbB3 and c-erbB4 protein in breast cancer. J Korean Breast Cancer Soc. 1998;1:215-225. doi:10.4048/jkbcs.1998.1.2.215
- Kirchner S, Ignatova Z. Emerging roles of tRNA in adaptive translation, signalling dynamics and disease. Nat Rev Genet. 2015;16:98-112. doi:10.1038/nrg3861
- Karakozova M, Kozak M, Wong CC, Bailey AO, Yates JR, Mogilner A 3rd, Zebroski H, Kashina A. Arginylation of beta-actin regulates actin cytoskeleton and cell motility. Science. 2006;313:192-196. doi:10.1126/science.1129344
- Jahn D, Verkamp E, Soll D. Glutamyl-transfer RNA: A precursor of heme and chlorophyll biosynthesis. Trends Biochem Sci. 1992;17:215-218. doi:10.1016/0968-0004(92)90380-R
- Roy H, Ibba M. RNA-dependent lipid remodeling by bacterial multiple peptide resistance factors. Proc Natl Acad Sci U S A. 2008;105:4667-4672. doi:10.1073/pnas.0800006105
- Miller SB, Yildiz FZ, Lo JA, Wang B, D'Souza VM. A structure-based mechanism for tRNA and retroviral RNA remodelling during primer annealing. Nature. 2014;515:591-595. doi:10.1038/nature13709
- Ruggero K, Guffanti A, Corradin A, Sharma VK, De Bellis G, Corti G, Grassi A, Zanovello P, Bronte V, Ciminale V, et al. Small noncoding RNAs in cells transformed by human T-cell leukemia virus type 1: A role for a tRNA fragment as a primer for reverse transcriptase. J Virol. 2014;88:3612-3622. doi:10.1128/JVI.02823-13
- Rudinger-Thirion J, Lescure A, Paulus C, Frugier M. Misfolded human tRNA isodecoder binds and neutralizes a 3' UTR-embedded Alu element. Proc Natl Acad Sci U S A. 2011;108:E794-802. doi:10.1073/pnas.1103698108
- Soma A, Himeno H. Cross-species aminoacylation of tRNA with a long variable arm between Escherichia coli and Saccharomyces cerevisiae. Nucleic Acids Res. 1998;26:4374-4381. doi:10.1093/nar/26.19.4374
- Moon A, Kim MS, Kim TG, Kim SH, Kim HE, Chen YQ, Kim HR. H-ras, but not N-ras, induces an invasive phenotype in human breast epithelial cells: A role for MMP-2 in the H-ras-induced invasive phenotype. Int J Cancer. 2000;85:176-181. doi:10.1002/(SICI)1097-0215(20000115)85:2%3C176::AID-IJC5%3E3.0.CO;2-E
- Keller A, Nesvizhskii AI, Kolker E, Aebersold R. Empirical statistical model to estimate the accuracy of peptide identifications made by MS/MS and database search. Anal Chem. 2002;74:5383-5392. doi:10.1021/ac025747h
- Nesvizhskii AI, Keller A, Kolker E, Aebersold R. A statistical model for identifying proteins by tandem mass spectrometry. Anal Chem. 2003;75:4646-4658. doi:10.1021/ac0341261