
ABSTRACT
MicroRNAs (miRNAs) are small RNA molecules that post-transcriptionally regulate gene expression through silencing of complementary target mRNAs. miRNAs are involved in many biological processes, including cell proliferation, differentiation, cell signaling and cellular defense responses to infection. Strategies that allow for strong and stable suppression of specific microRNA activity are needed to study miRNA functions and to develop therapeutic intervention strategies aimed at interfering with miRNA activity in vivo. One of these classes of miRNA inhibitors are Tough Decoys (TuD) RNAs, which comprise of an imperfect RNA hairpin structure that harbors two opposing miRNA binding sites. Upon developing TuDs targeting Epstein-Barr virus miRNAs, we observed a strong variation in inhibitory potential between different TuD RNAs targeting the same miRNA. We show that the composition of the ‘bulge’ sequence in the miRNA binding sites has a strong impact on the inhibitory potency of the TuD. Our data implies that miRNA inhibition correlates with the thermodynamic properties of the TuD and that design aimed at lowering the TuD opening energy increases TuD potency. Our study provides specific guidelines for the design and construction of potent decoy-based miRNA inhibitors, which may be used for future therapeutic intervention strategies.
Introduction
miRNAs are a class of small regulatory RNA molecules that induce destabilization and translational inhibition of complementary target mRNAs. miRNAs influence many cellular processes, such as proliferation, differentiation, cell signaling and defense responses to infection [Citation1–Citation3]. miRNAs are expressed by a broad variety of organisms including plants, almost all animal phyla as well as several DNA- and retroviruses [Citation4–Citation8]. In humans, hundreds of miRNAs have been identified of which many are conserved in other animal species [Citation9].
Many pathologies have been linked to aberrant miRNA expression patterns, including cancer, metabolic disorders, heart failure and neurological diseases [Citation10–Citation14]. To study miRNA functioning in biological systems, potent and specific miRNA inhibitors that can be efficiently delivered in the target cell are desired. In addition, future therapies may rely on effective tools to manipulate miRNA levels via these specific inhibitors.
Over the past decade, various classes of miRNA inhibitors have been developed. The first miRNA inhibitors were antisense oligonucleotides [Citation15] that bind to mature miRNA sequences within the cell. To enhance their stability and increase their affinity for a specific miRNA, chemical modifications such as 2ʹO methyl ribose sugars, locked ribose rings (locked nucleic acid, ‘LNA’, nucleotides) and phosphorothioate backbone linkages were employed [Citation16–Citation18]. These reagents were further modified to improve their delivery into cells via the attachment of 3ʹ terminal cholesterol groups, yielding ‘antagomirs’ [Citation19]. Besides exogenous chemical inhibitors, miRNA activity can also be inhibited through the expression of antisense sequences via vector-based delivery approaches. miRNA ‘sponges’ are transcripts harboring repeats of miRNA binding sites [Citation20] that act as miRNA scavengers, thereby effectively blocking their activity. By introducing these sequences in viral vectors, they can interfere with miRNA activity for prolonged periods of time [Citation21]. However, high competitor transcript levels and presence of long repeats of binding sites are required to induce effective miRNA inhibition via these miRNA sponges [Citation22]. More recently, potent miRNA inhibitors were developed that harbor only two miRNA binding sites. These ‘Tough Decoy’ RNAs or TuDs can be expressed within the cell via vector-based delivery [Citation23–Citation25] or transfected as a synthetically produced inhibitor composed of 2ʹ-O-methylated RNA oligonucleotides [Citation26]. When TuDs are expressed from RNA polymerase III promoters, they fold into an imperfect RNA hairpin that contains two opposing miRNA binding sites in a bulge of the structure [Citation23]. TuDs are exported out of the nucleus to the cytoplasm via Exportin 5, where they specifically and potently interfere with miRNA activity [Citation23]. Studies have also shown that RNA polymerase II promoters can be used to efficiently express TuD inhibitors within the cell [Citation24,Citation25]. It has been shown that adeno-associated virus-delivered TuDs induced long-term miRNA inhibition in mice [Citation27,Citation28]. TuDs and sponges are both more effective when the miRNA binding sites are non-complementary to the target miRNA at position 10–11, presumably because Ago2-dependent cleavage of the TuD is prevented [Citation23,Citation25,Citation29]. Whether TuD activity is mediated by miRNA sequestration alone, or also by miRNA degradation remains unclear, since several studies have reported conflicting results [Citation20,Citation23,Citation27]. In comparative studies, TuDs proved more effective miRNA inhibitors than sponges [Citation23,Citation27]. Recently, an AAV-based TuD has been successfully used to restore cardiac function in a murine heart failure model by targeting miR-25 [Citation28]. In addition, introduction of an anti-miR-17 TuD in a MYC-driven hepatocellular carcinoma mouse model significantly inhibited tumor progression [Citation30]. These studies suggest that anti-miRNA TuDs may hold therapeutic potential.
Given the reported effectiveness of TuDs, we set out to generate a comprehensive collection of TuD inhibitors targeting miRNAs encoded by Epstein-Barr virus (EBV). EBV was the first identified virus to produce miRNAs in infected human cells [Citation5]. EBV miRNAs regulate multiple processes in infected cells, such as apoptosis [Citation31–Citation34], EBV-driven cellular transformation [Citation35,Citation36], and immune responses against pathogens [Citation37–Citation42]. As guidelines for the design of the non-complementary TuD sequences are largely lacking, we aimed to determine rules for selecting these nucleotides based on the thermodynamic properties of the TuD structure. We observed that the composition of the TuD bulge sequence impacts TuD activity greatly, where bulge composition aimed at lowering the TuD opening energy enhances the potency of miRNA inhibition.
Materials and methods
Plasmids
To assess functional miRNA expression, single perfect miRNA binding sites were introduced 29 bp downstream the mCherry reporter gene in the lentiviral pSicoR-EF1a-PuroR-T2A-mCherry vector [Citation43]. EBV miRNA clusters were expressed from the intron of the pLenti-Blast-eGFPintron vector [Citation40]. The Tough Decoy expression vector pSicoR-EF1a-ZeoR-T2A-mAmetrine ()) was derived from pSicoR-EF1a-PuroR-T2A-mCherry [Citation44] by replacing the PuroR-T2A-mCherry cassette for a ZeoR-T2A-mAmetrine cassette. TuDs were cloned immediately downstream of the mouse U6 promoter (sequences listed in Table S1). All constructs were sequence-verified by Sanger sequencing (MacroGen Corp., Amsterdam, The Netherlands).
Figure 1. Variations in the TuD RNA bulge sequence impacts its inhibitory potential.(A) Schematic overview of the TuD-expressing pSicoR-EF1a-ZeoR-T2A-mAmetrine lentiviral vector used. The hU6 promoter drives expression of the TuD. The Zeocin-resistance is linked to the mAmetrine gene via a T2A sequence. (b) Co-cultures of control or EBV miRNA-expressing cells were lentivirally transduced with a miR-BART1-3p or miR-BART1-5p mCherry reporter construct (top and bottom histograms, respectively) together with a TuD targeting the corresponding miRNA (left histograms) or a control TuD (right histograms). Cells were analyzed by flow cytometry to assess mCherry reporter levels in eGFP-positive (miRNA+) and mAmetrine-positive (TuD+) cells. (c) Co-cultures of control and EBV miRNA-expressing HK-1 cells were lentivirally transduced with a miRNA reporter and corresponding TuD. Following flow cytometric analysis, mCherry geometric mean fluorescence intensities (gMFI) of miRNA+ and miRNA+TuD+ cells were normalized to those of miRNA− cells. Values are averages of duplicates ±SD of a representative experiment. (d) Co-cultures of control and miR-BART3-expressing HK-1 cells were lentivirally transduced with a miR-BART3-3p mCherry reporter and the indicated TuD. From left to right, cells received either the empty vector control, a miR-BART3-3p TuD with ‘GTCA’ bulge, a miR-BART3-3p TuD with ‘GGAA’ bulge, a TuD with complementary miR-BART3-3p binding sites, or a TuD with four mismatches to positions 9–12 of the miRNA from the miRNA 5ʹ end (see Table S2 for details). Following flow cytometric analysis, mCherry gMFI of miRNA+TuD− and miRNA+TuD+ cells were normalized to those of miRNA− cells. Displayed values are averages of triplicates ±SD. (e) Minimum free energy (MFE) secondary structure predictions, as generated by RNAfold from the ViennaRNA package [Citation45], for the miR-BART3-3p TuD with the ‘GTCA’ bulges (the ‘bad-quality’ TuD, on the left) and the TuD with the ‘GGAA’ bulges (the ‘good-quality’ TuD, on the right). The location of the miRNA binding sites (MBS) are indicated. The colors indicate base-pairing probabilities (paired regions) or likelihood of not being paired (unpaired regions).
![Figure 1. Variations in the TuD RNA bulge sequence impacts its inhibitory potential.(A) Schematic overview of the TuD-expressing pSicoR-EF1a-ZeoR-T2A-mAmetrine lentiviral vector used. The hU6 promoter drives expression of the TuD. The Zeocin-resistance is linked to the mAmetrine gene via a T2A sequence. (b) Co-cultures of control or EBV miRNA-expressing cells were lentivirally transduced with a miR-BART1-3p or miR-BART1-5p mCherry reporter construct (top and bottom histograms, respectively) together with a TuD targeting the corresponding miRNA (left histograms) or a control TuD (right histograms). Cells were analyzed by flow cytometry to assess mCherry reporter levels in eGFP-positive (miRNA+) and mAmetrine-positive (TuD+) cells. (c) Co-cultures of control and EBV miRNA-expressing HK-1 cells were lentivirally transduced with a miRNA reporter and corresponding TuD. Following flow cytometric analysis, mCherry geometric mean fluorescence intensities (gMFI) of miRNA+ and miRNA+TuD+ cells were normalized to those of miRNA− cells. Values are averages of duplicates ±SD of a representative experiment. (d) Co-cultures of control and miR-BART3-expressing HK-1 cells were lentivirally transduced with a miR-BART3-3p mCherry reporter and the indicated TuD. From left to right, cells received either the empty vector control, a miR-BART3-3p TuD with ‘GTCA’ bulge, a miR-BART3-3p TuD with ‘GGAA’ bulge, a TuD with complementary miR-BART3-3p binding sites, or a TuD with four mismatches to positions 9–12 of the miRNA from the miRNA 5ʹ end (see Table S2 for details). Following flow cytometric analysis, mCherry gMFI of miRNA+TuD− and miRNA+TuD+ cells were normalized to those of miRNA− cells. Displayed values are averages of triplicates ±SD. (e) Minimum free energy (MFE) secondary structure predictions, as generated by RNAfold from the ViennaRNA package [Citation45], for the miR-BART3-3p TuD with the ‘GTCA’ bulges (the ‘bad-quality’ TuD, on the left) and the TuD with the ‘GGAA’ bulges (the ‘good-quality’ TuD, on the right). The location of the miRNA binding sites (MBS) are indicated. The colors indicate base-pairing probabilities (paired regions) or likelihood of not being paired (unpaired regions).](/cms/asset/f1231158-04b9-490b-8af0-33d9464f53f5/krnb_a_1537746_f0001_c.jpg)
Cell lines
HK-1 cells were a kind gift from Prof. Dr. G. Tsao (The University of Hong Kong, Hong Kong). HEK293T cells were obtained from the ATCC. HK-1 were maintained in Roswell Park Memorial Institute medium (RPMI 1640; Life Technologies) and HEK293T cells in Dulbecco’s modified Eagle medium (DMEM; Life Technologies), supplemented with 10% FCS (Sigma), 2 mM L-glutamine, 100 U/mL penicillin, and 100 mg/mL streptomycin.
Lentivirus transductions
Lentiviruses were produced in a 24-well format using standard lentiviral production protocols using third-generation VSV-G-pseudotyped packaging vectors. Cells were lentivirally transduced by spin infection at 1,000xg for 1.5 hrs at 33°C in the presence of 4 μg/ml polybrene. Transduced HK-1 cells were selected using 2 µg/ml Puromycin, 10 µg/ml Blasticidin or 100 µg/ml Zeocin three days post-transduction.
miRNA reporter assay
A mix of empty (eGFP-negative) and EBV miRNA-expressing (eGFP-positive) HK-1 cells was lentivirally transduced with a given mCherry 3ʹUTR miRNA reporter construct. Subsequently, these cells were transduced with TuD vectors at low MOI to ensure single integration in the genome. Approximately one week post transduction, cells were fixed and analyzed by flow cytometry to assess mCherry reporter expression levels (BD FACS Canto II). Data analysis was performed using FlowJo (Treestar). Cells were gated for eGFP expression (miRNA+) and mAmetrine expression (TuD inhibitor+). Relative reporter expression values were obtained by dividing the mCherry geometric mean fluorescence intensity (gMFI) of the miRNA+ cells by the gMFIs of the miRNA− cells (shown in ). The percentage of reporter derepression induced by a TuD (TuD potency) was calculated as follows: 10Log (mCherry gMFImiRNA+TuD+/mCherry gMFImiRNA+TuD-)/10Log (mCherry gMFImiRNA-/mCherry gMFImiRNA+TuD-).
Computational analysis TuD thermodynamic properties
RNAup
Free energies of miRNA-TuD interactions were calculated using the RNAup command line tool of the ViennaRNA package version 2.1.9 in ‘interaction mode’ (https://www.tbi.univie.ac.at/RNA/index.html) [Citation45]. Using concatenated miRNA and TuD sequences within the input file (‘&’ is used for concatenation within the input format, see example below) RNAup switches automatically to the ‘interaction mode’, in which the program identifies the optimal region for miRNA-TuD binding with a maximum length of 25 bases. For this optimal region, RNAup computes the opening energy (kcal/mol) of the TuD sequence, the energy of duplex formation (kcal/mol) between the TuD MBS (miRNA binding site) and the miRNA, and the total free energy of binding (kcal/mol). Thus, the computational analysis of the total free energy of binding mentioned throughout this report does not comprise the relatively weak miRNA opening energy. As the ViennaRNA package has been recently updated, we re-calculated the free-energies with version 2.2.4, providing identical values as compared to version 2.1.9 for all TuD sequences.
Example of an RNAup command to calculate the interaction energies between miR-BART3-3p and a given single miR-BART3-3p TuD: RNAup < input_BART3.txt > output.txt, where the input file has the following contents (miR-BART3-3p sequence followed by a single miR-BART3-3p TuD containing two bulges with ‘aaaa’ nucleotides; the ‘&’ separates the two sequences):
CGCACCACTAGTCACCAGGTGT&GACGGCGCTAGGATCatcaacACACCTGGTGACaaaaTAGTGGTGCGcaagtattctggtcacagaatacaacACACCTGGTGACaaaaTAGTGGTGCGcaagATGATCCTAGCGCCGTCTTTTTT
RNAplfold
As the RNAup algorithm scales as O(n^4), it is relatively slow in calculating openings energies in batch format. The RNAplfold tool, also from the ViennaRNA package [Citation45], computes opening energies in cubic time (O(n^3)) [Citation46] thereby reducing the duration of computational analyses. To compare RNAup and RNAplfold side-by-side, we employed RNAplfold to compute opening energies (-O) for both MBS within all 65,536 possible TuDs for miR-BART10-3p and BART18-5p (MBS length (-u) set to 27 for miR-BART10-3p (nucleotides 22–48 = site1 and 75–101 = site2) and 26 for miR-BART18-5p (nucleotides 22–47 = site1 and 74–99 = site2)). We then compared the best MBS opening energy of each TuD calculated with RNAplfold with the RNAup-computed opening energies (Figure S2A). A small fraction (< 1%) of optimal interaction sites computed by RNAup were ‘truncated’ (the interaction was limited to only part of the miRNA sequence), these data points were removed from the analysis. The opening energies for TuDs calculated by both tools were highly correlated. In addition, the TuD potency correlated significantly with the RNAplfold-computed opening energies for the selected LE and HE TuDs from ) (Figure S2B) (as was the case for the RNAup-computer opening energies), showing that RNAplfold can be adapted for TuD opening energy calculations in high-throughput analysis to reduce calculation times.
Figure 2. TuD RNA potency correlates with thermodynamic properties of the decoy.(A) Scatter plots displaying TuD potency versus free energies of 60 different TuDs targeting a total of 31 different EBV miRNAs. HK-1 cells expressing an EBV miRNA cluster and a specific 24 miRNA reporter were lentivirally transduced with a corresponding TuD, followed by flow cytometric analysis of miRNA reporter expression. The TuD opening energy, miRNA-TuD hybridization energy and total free energy (sum of opening energy and hybridization energy) were calculated using RNAup from the Vienna RNA package (Citation45). Each data point represents a single TuD; for some miRNAs multiple TuD variants were analyzed, which contain the same MBS but different 4 nt bulge sequences. Different TuDs targeting the same miRNA (‘families’) are presented using corresponding symbols/colors. For multiple different BART miRNAs we only tested one specific TuD, all these are indicated by the small black dots. The Pearson correlation coefficients and the corresponding P-values (two-tailed) are indicated. (B) HK-1 cells expressing EBV miRNAs were transduced with the miR-BART11-3p or the miR-BART19-3p mCherry reporter and one of multiple TuDs of which only the bulge sequences varied. The scatter plots show TuD potencies versus opening energies of the TuDs.
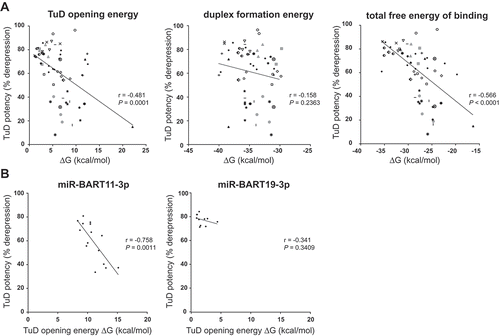
Figure 3. TuD opening energies computed for every possible TuD bulge nucleotide composition.All possible TuD sequences were generated in silico for miR-BART3-3p, miR-BART11-3p and miR-BART19-3p, i.e., TuDs were designed based on the miRNA sequence and the 65,536 (48) different miRNA-non complementary ‘bulge’ nucleotides combinations. Opening energies of the structures of all TuDs were calculated by the RNAup algorithm. The squares indicate the TuDs that were tested experimentally and whose efficiencies are shown in and , respectively.
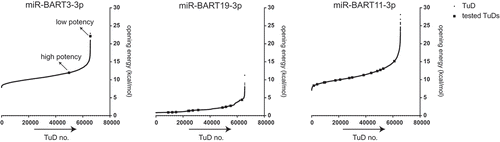
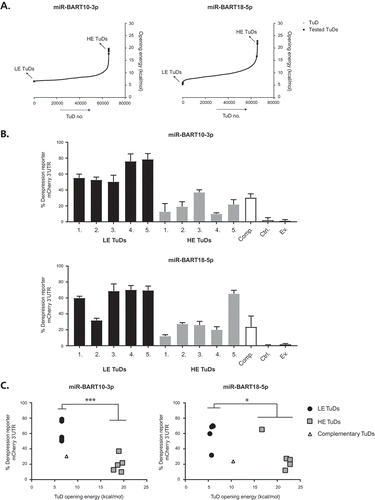
Figure 4. TuD opening energy predicts the inhibitory effect on miRNA functioning.(A) All possible TuD sequences, based on the variable 4 nt bulge sequence, and their corresponding TuD opening energy (y-axis) were generated in silico for miR-BART10-3p and miR-BART18-5p. Predicted low energy (LE) and high energy (HE) TuDs that were selected for in vitro experiments are indicated by the arrows and squares. (b) Percentage of 3ʹUTR reporter derepression, calculated as discussed previously in , for both the selected miR-BART10-3p and miR-BART18-5p TuDs in EBV miRNA-expressing HK-1 cells seven days post-transduction of the corresponding TuD construct. Five predicted LE and HE TuDs are presented in black and grey bars, respectively. Control conditions are: a ‘perfect’ complementary (Comp.) TuD (without 4 nt bulge), the untransduced cells (Ctrl.) and the TuD empty vector backbone (Ev.). Following flow cytometric analysis, mCherry gMFI of miRNA+ and miRNA+TuD+ cells were normalized to those of miRNA− cells. Values presented are the average of biological duplicates, both performed as technical triplicate experiments, ±SD (c) Scatter plots of the TuD opening energy (x-axis; kcal/mol) versus the percentage of 3ʹUTR mCherry reporter derepression (y-axis), regarding the predicted LE (black dots), HE (grey squares) and the perfect complementary (open triangle) TuDs (also presented in ). The asterisks indicate a significant difference between the LE and HE groups (Student’s t-test, unpaired) with: *** = P < 0.001 and * = P < 0.05.
Command lines to compute MBS opening energy with RNAplfold:
miR-BART10-3p: -O -u 27 -W 128 -L 128 – auto-id – id-digits = 5 – id-prefix 10-3pTuDs <input_10-3p.txt
To retrieve the correct opening energy from the generated matrix in the Linux shell:
Site 1: cut -f 1,28 10-3pTuDs*_openen | grep ‘^48’ | cut -f 2 > output_site1.txt
Site 2: cut -f 1,28 10-3pTuDs*_openen | grep ‘^101’ | cut -f 2 > output_site2.txt
miR-BART18-5p: -O -u 26 -W 126 -L 126 – auto-id – id-digits = 5 – id-prefix 18-5pTuDs <input_18-5p.txt
To retrieve the correct opening energy from the generated matrix in the Linux shell:
Site 1: cut -f 1,27 18-5pTuDs*_openen | grep ‘^47’ | cut -f 2 > output_site1.txt
Site 2: cut -f 1,27 18-5pTuDs*_openen | grep ‘^99’ | cut -f 2 > output_site2.txt
Statistics
The Pearson correlation coefficients along with the corresponding two-tailed P-values were calculated using GraphPad Prism software version 7.04.
Results
Tough decoy RNAs inhibit miRNA activity with varying efficiency
We set out to develop potent miRNA inhibitors for all mature EBV miRNAs that locate to the the BamHI A rightward transcripts (BART) Cluster [Citation47]. For this, we cloned TuDs downstream of the mouse U6 promoter in a lentiviral vector that co-expresses the fluorescent mAmetrine and the Zeocin resistance gene ()). Each of the two TuD arms harbored a single miRNA binding site that was complementary to a given miRNA except for a four nucleotide bulge that was inserted between positions 10–11 from the 3ʹ end of the binding site, coined ‘4ntin’ by Haraguchi et al. [Citation23]. Since no clear design rules for the 4ntin bulge were described, we randomly designed a sequence for each of the TuD RNAs to not match the adjacent nucleotides. We subsequently tested the potency of the TuDs in HK-1 cells that ectopically expressed a cluster of EBV miRNAs (vector is described in Hooykaas et al. [Citation40]) together with a specific miRNA reporter for a given EBV miRNA. This reporter consisted of an mCherry reporter gene containing a single EBV miRNA target site in its 3ʹUTR, allowing specific quantification of miRNA activity. Indeed, HK-1 cells transduced with miR-BART1-3p and miR-BART1-5p reporters readily sensed EBV miR-BART1 expression as reporter levels were potently downregulated in EBV miRNA cluster-expressing cells but not in EBV miRNA-negative cells (), compare open dashed histograms with open black histograms). Subsequent lentiviral introduction of TuDs targeting miR-BART1-3p and miR-BART1-5p resulted in a potent upregulation of the corresponding mCherry reporters, indicating that the inhibitors successfully derepressed miRNA targets (), left panels, filled gray histograms). The effect of the TuDs was specific, as control TuDs targeting irrelevant EBV miRNAs did not relieve mCherry expression of the miR-BART1-3p and miR-BART1-5p reporters (), right panels). Also the TuDs targeting all other BART miRNAs were functional, as indicated by the derepression of miRNA reporters () and data not shown) and specific, as expression of the TuD for an irrelevant miRNA did not affect mCherry reporter expression (Figure S1). However, the TuD potency unexpectedly varied greatly between these miRNA inhibitors, ranging from miRNA inhibition of 29% to 92% ()).
Bulge sequence variations in the TuD impact its inhibitory potential
We tested whether we could increase TuD potency of an inefficient inhibitor by altering the 4ntin bulge sequence in the miRNA binding site. For this, we replaced the GTCA bulge from the inefficient miR-BART3-3p TuD with a GGAA bulge (Table S2). Intriguingly, the TuD potency improved the derepression of the mCherry reporter by miR-BART3-3p drastically from 10% for the GTCA-bulge to 66% for the GGAA-bulge variant (), compare white with grey bars). Hence, a 2 nt change in the bulge alone converted an inefficient TuD into an efficient one. Complete removal of the bulge, rendering the TuD fully complementary to its miRNA target, did not increase TuD potency ()). This is in line with the study by Haraguchi et al., suggesting that complementary (or ‘perfect’) TuDs are subject to Ago2 cleavage and are therefore less efficient miRNA inhibitors [Citation23]. Mutating the potential Ago2 cleavage site at positions 9–12 of the ‘perfect’ complementary miR-BART3-3p TuD, generating a miR-BART3-3p TuD that is non-complementary at positions 9–12 (see Table S2), also did not increase TuD potency, but rather reduced the inhibitory capacity ()).
Since target RNA accessibility is of importance for miRNA target recognition [Citation48] and siRNA functioning [Citation49], we hypothesized that the increased inhibitory potential of the GGAA-bulge TuD as compared to the GTCA-bulge TuD may have been caused by an altered and more relaxed secondary TuD structure. A relaxed secondary TuD structure may increase the RNA accessibility compared to a less open structure, which may lead to an increased capacity for scavenging mature miRNA targets. Indeed, the predicted secondary structure of both TuDs was altered in the miRNA binding site (MBS) region. The inefficient TuD with a GTCA-bulge facilitates extensive base pairing between both miRNA binding sites, whereas the efficient TuD is predicted to adopt a more open structure with limited base pairing between the MBSs ()). Therefore, a lack of MBS accessibility of the inefficient TuD may reduce the potential for miRNA binding, resulting in poor TuD potency. This finding is consistent with a report on synthetic TuDs, where strong base pairing between two fully 2′-O-methylated RNA strands impaired the inhibitory potential [Citation26].
Inhibition strength correlates with thermodynamic properties of TuDs
To analyze the thermodynamics of all tested TuDs, we usurped the RNAup algorithm from the Vienna RNA package [Citation45] to calculate the miRNA-TuD binding energy. In interaction mode, the software scans the TuD sequence for the optimal region of interaction with the BART miRNA. RNAup calculates the binding energy of two RNA molecules as the sum of two components: the energy required to open both RNA molecules and the energy gained from duplex formation. Since miRNAs are very short and unstructured, their opening energy is low, contributing only marginally to the score. We therefore only used the opening energy of the TuDs and correlated this to the relative TuD potency as determined by miRNA reporter experiments for 60 different TuDs ()). Indeed, we observed an inverse correlation between the TuD opening energy and its miRNA inhibitory capacity (Pearson correlation coefficient of −0.481, P = 0.0001), i.e.: when the opening energy was high, the efficiency of the TuD was generally low (), left graph). Although we did not observe a significant correlation between miRNA-TuD duplex formation energy and TuD potency (), middle graph), the sum of both energies clearly correlated with TuD strength (Pearson correlation coefficient of −0.566, P < 0.0001; ), right graph).
As our dataset already contained multiple TuDs designed to target the same miRNA, yet with different bulge sequences, we assessed whether these TuDs followed the same trend as described above. Indeed, for the majority of TuDs, we observed that mutating a 4 nt bulge to a variant with a reduced TuD opening energy resulted in enhanced TuD potency (), left graph). This pattern was most apparent when the relative difference in opening energy between TuDs was large. However, the duplex formation energy barely differed per TuD and did not correlate with TuD potency (), middle graph).
We next cloned a larger set of TuD bulge variants for two miRNAs (miR-BART11-3p and miR-BART19-3p) and assessed the extent to which TuD potency could be enhanced for individual miRNA inhibitors. In line with our previous findings, there was a strong inverse correlation between TuD potency and TuD opening energy for the miR-BART11-3p TuD variants with a Pearson correlation coefficient of −0.758 and a P-value of 0.011 (), left graph). However, for miR-BART19-3p TuDs, this correlation was very weak and not significant (), right panel). This difference is likely caused by the already low opening energy of miR-BART19-3p TuD, where mutations in the 4 nt bulge region do not impact the total free energy in an extent that enhanced TuD potency is obtained. For miR-BART11-3p on the other hand, mutations in the bulge have a much stronger effect on the calculated opening energy ()) and will therefore also impact the inhibitory potential of these TuDs more pronounced. Therefore, since the majority of the nucleotides in the miRNA binding sites of a TuD are governed by the sequence of the mature miRNA that is targeted, changes in the 4 nt bulge alone may not increase the potency of TuDs for a subset of miRNAs.
High-throughput computation of TuD opening energies
Since there is a strong correlation between TuD opening energy and inhibitory potential, computation of the opening energies of the full array of possible TuD sequences could aid in the design of effective TuDs. To explore this possibility, TuD opening energies were calculated for all 65,536 potential bulge sequences for miR-BART3-3p, miR-BART11-3p and miR-BART19-3p using the RNAup algorithm. The energy plots for these sequences, as well as the efficiency scores of the TuDs from previous figures (indicated as ‘tested TuDs’), are presented in . Upon examination of the miR-BART3-3p graph, we noted that the low efficiency TuD for miR-BART3-3p from sits at the extreme high end of all calculated opening energies (22.1 kcal/mol), whereas the high efficiency TuD (11.88 kcal/mol) was among many TuDs with much lower opening energy. As many potential TuDs had a lower calculated TuD opening energy, we anticipate that more potent TuDs could be present among these sequences. In agreement with ), changing the 4 nt bulge sequences for the miR-BART19-3p TuD has only limited impact on the calculated TuD opening energies (, middle panel). On the other hand, changing the bulge composition of miR-BART11-3p TuDs has a much broader impact on the calculated opening energy for these TuDs (, middle and right panel). Together, we show that the TuD opening energy is an important determinant for its inhibitory potential. Therefore, computational design to identify TuD sequences conferring low opening energy may facilitate the selection of potent TuD miRNA inhibitors.
TuD opening energy robustly predicts potent miRNA inhibitors
We reasoned that we could increase the likelihood of identifying potent TuD RNAs by selecting those TuDs containing 4 nt bulge sequences that result in low opening energy of the molecule. To test this, we calculated the opening energies for all potential bulge sequence variants for two EBV miRNAs, miR-BART10-3p and miR-BART18-5p using RNAup ()). From these variants, we selected 5 TuDs with a low opening energy (LE), and five TuDs with a high opening energy (HE). Subsequently, we analysed the potency of the selected TuDs in a 3ʹUTR miRNA reporter system. As expected, all predicted LE TuDs targeting miR-BART10-3p potently inhibited miR-BART10-3p (ranging from 50–80% derepression), whereas all predicted HE TuDs inhibited miR-BART10-3p to a much lesser extent (~ 10–38% derepression). This resulted in a strong inverse correlation of the selected LE and HE TuDs with the calculated opening energies (Pearson correlation coefficient of −0.884, P-value = 0.0007). A perfect complementary miR-BART10-3p TuD (Comp. in ) and open triangle in 4C) that lacks the 4 nt bulge only induced moderate levels of miRNA derepression, which is in line with previous findings [Citation23]. Also for miR-BART18-5p TuDs the majority of selected sequences acted as expected. A strong 3ʹUTR derepression occurred in four out of five LE TuDs (), lower panel and ), right panel), and moderate repression occurred in four out of five HE TuDs. However, as one LE TuD unexpectedly induced moderate miRNA derepression and one HE TuD induced potent derepression, the prediction of TuD potency based on opening energy is not fully accurate and suggests that other parameter also play a role in determining TuD potency. However, as we could accurately predict 9 out of 10 potent TuDs based on opening energy prediction upon bulge alteration, our model aids in enriching for potent TuD RNAs.
Altogether, our results indicate that the TuD opening energy is a reliable predictor of the TuD functionality in derepressing the corresponding miRNA. When designing a potent TuD one should select TuD constructs with a low opening energy, based on the variation in the 4 nt bulge sequence, which translates into a relaxed, accessible RNA structure that is more superior in scavenging miRNA molecules.
Discussion
miRNAs are important post-transcriptional regulators of gene expression. By destabilizing mRNA transcripts and inducing inhibition of translation they repress protein expression. Many diseases have been linked to aberrant miRNA expression, therefore, interference with miRNA function is a promising target for the development of new therapeutics. Several strategies have been developed to interfere with miRNA activity. Of these, the TuD RNAs have been identified as one of the most specific and potent miRNA inhibitors [Citation23,Citation25]. Recently, TuDs have been exploited as therapeutic agents in in vivo mouse models [Citation28,Citation30], showing promising results regarding long-term target inhibition.
Haraguchi and co-workers assessed what TuD structure provides the most potent anti-miRNA activity [Citation23]. These studies mainly focused on the architecture of the TuD outside the scope of the miRNA target site, and no guidelines were provided regarding the requirements for the 4 nt bulge in the miRNA binding site. Their studies did suggest that ‘perfect’ complementary binding of miRNAs to the MBS resulted in less potent TuDs as compared to MBS containing a 4 nt bulge. This effect is likely caused by direct cleavage of the perfect complementary TuDs, which does not occur in the ‘bulged’ TuD RNAs [Citation23]. Grimm and colleagues, however, did not observe a significant difference in inhibitory capacity of anti-miR-122 TuDs containing ‘perfect’ complementary MBS sites or a 4 nt bulge upon co-transfection with a corresponding luciferase reporter. In the same study, TuDs containing complementary ‘perfect’ RNA binding sites outperformed 4 nt bulge-containing TuDs when targeting short hairpin (sh)RNAs [Citation50]. In line with Haraguchi et al., we show that the 4 nt bulge introduction in the MBS enhances TuD activity (, (b) and 4(c)). The different results might be due to the mode of delivery; whereas Grimm et al. delivered the TuDs by transient transfection when comparing the differently designed TuD constructs, which often results in high expression levels [Citation50], we used a lentiviral delivery strategy which results in stable, yet lower, expression of TuDs [Citation23]. It has been proposed that perfectly complementary TuD might be sensitive to Ago2 cleavage, thereby decreasing the inhibitory potential of the miRNA inhibitor. In line with this hypothesis, we observed the inability of the ‘perfect’ complementary miR-BART3-3p TuD to inhibit miR-BART3-3p functioning efficiently ()). Mutating the potential Ago2 cleavage site (position 9–12) within the miR-BART3-3p TuD did not rescue the inhibitory capacity ()), but rather lowered the TuD inhibitory activity. This indicates the importance of these nucleotides in binding to the target miRNA. Additionally, we observed that the 4 nt bulge sequence is an important contributor to the opening energy of the TuD hairpin structure and that the calculated TuD opening energy inversely correlated with its efficiency (). Since accessibility of miRNA target sites is important in miRNA functioning [Citation48], it suggests that a low opening energy induces a more relaxed TuD structure, which may enable enhanced MBS exposure and more efficient miRNAs scavenging. This is in line with a report on synthetic TuDs, in which the authors showed that strong base pairing between two fully 2′-O-methylated RNA strands impaired the inhibitory potential. By introducing a point mutation or a 4 nt insertion within the MBS to increase TuD accessibility the authors observed increased target miRNA inhibition [Citation26]. In our study, no correlation between TuD activity and the energy produced through duplex formation upon miRNA binding to the TuD (), middle graph). However, by combining both energies, the sum of both the TuD opening energy and the duplex formation energy, we again observed an inverse correlation (), right graph), since the TuD opening energy is the factor that weighs the heaviest due to the relatively high variability.
For a subset of miRNAs, such as for miR-BART19-3p () and ), we did not observe strong enhanced TuD potency upon changes introduced in the 4 nt bulge sequence. It appears that in these cases, the opposing MBS’s already adopt a relaxed structure of the TuD as cis interactions between the MBSs are limited. As such, these TuDs already have a ‘native’ low opening energy and the contribution of the 4 nt bulge to the opening energy is limited. However, as these TuDs are likely potent miRNA inhibitors, a further enhancement of their potency may not be required. Indeed, the efficiency of all miR-BART19-3p TuDs tested was very high, and no strong correlation was observed between TuD opening energy and its inhibitory potential ()).
Two out of ten anti-miR-BART18-5p TuDs did not act as expected based on their calculated opening energies. One ‘low energy’ TuD induced only weak derepression of miRNA activity, whereas one ‘high energy’ TuD induced strong miRNA derepression ()). This suggests that either the opening energy values as calculated by the ViennaRNA package are not fully accurate, or that other, yet unknown, factors contribute to TuD potency. It would be interesting to target additional miRNAs and generate larger sets of TuD bulge-variants to assess how well these act in functionally derepressing miRNA activity and how accurate our model can predict potent TuDs over non-potent ones.
Concluding, in this report we show that miRNA inhibitors based on the TuD design can vary strongly in efficiency when the 4 nt bulge sequence is randomly designed. The thermodynamic properties are accountable for this phenomenon, since the TuD opening energy correlated inversely with the TuD efficiency. A low TuD opening energy leads to a more relaxed RNA structure, which enhances the anti-miRNA activity of the TuD. We recommend to perform computational analysis of all possible TuD sequences using tools provided by the ViennaRNA package for a given miRNA to select those variants that have a low TuD opening energy and are therefore more likely to act as a highly active miRNA inhibitor.
Supplemental Material
Download PDF (538.7 KB)Acknowledgments
We would like to thank all the members of the Wiertz and Lebbink group for the fruitful discussions and suggestions regarding this manuscript.
Disclosure statement
No potential conflict of interest was reported by the authors.
Supplementary Material
Supplemental data for this article can be accessed here.
Additional information
Funding
References
- Inui M, Martello G, Piccolo S. MicroRNA control of signal transduction. Nat Rev Mol Cell Biol. 2010;11:252–263.
- Lodish HF, Zhou B, Liu G, et al. Micromanagement of the immune system by microRNAs. Nat Rev Immunol. 2008;8:120–130.
- Shenoy A, Blelloch RH. Regulation of microRNA function in somatic stem cell proliferation and differentiation. Nat Rev Mol Cell Biol. 2014;15:565–576.
- Grimson A, Srivastava M, Fahey B, et al. Early origins and evolution of microRNAs and Piwi-interacting RNAs in animals. Nature. 2008;455:1193–1197.
- Pfeffer S, Zavolan M, Grasser FA, et al. Identification of virus-encoded microRNAs. Science. 2004;304:734–736.
- Berezikov E. Evolution of microRNA diversity and regulation in animals. Nat Rev Genet. 2011;12:846–860.
- Kincaid RP, Sullivan CS. Virus-encoded microRNAs: an overview and a look to the future. PLoS Pathog. 2012;8:e1003018.
- Voinnet O. Origin, biogenesis, and activity of plant microRNAs. Cell. 2009;136:669–687.
- Bartel DP. Metazoan MicroRNAs. Cell. 2018;173:20–51.
- Calin GA, Croce CM. MicroRNA signatures in human cancers. Nat Rev Cancer. 2006;6:857–866.
- Rottiers V, Naar AM. MicroRNAs in metabolism and metabolic disorders. Nat Rev Mol Cell Biol. 2012;13:239–250.
- Rao P, Benito E, Fischer A. MicroRNAs as biomarkers for CNS disease. Front Mol Neurosci. 2013;6:39.
- Esteller M. Non-coding RNAs in human disease. Nat Rev Genet. 2011;12:861–874.
- Wahlquist C, Jeong D, Rojas-Munoz A, et al. Inhibition of miR-25 improves cardiac contractility in the failing heart. Nature. 2014;508:531–535.
- Lennox KA, Behlke MA. Chemical modification and design of anti-miRNA oligonucleotides. Gene Ther. 2011;18:1111–1120.
- Hutvagner G, Simard MJ, Mello CC, et al. Sequence-specific inhibition of small RNA function. PLoS Biology. 2004;2:E98.
- Meister G, Landthaler M, Dorsett Y, et al. Sequence-specific inhibition of microRNA- and siRNA-induced RNA silencing. Rna. 2004;10:544–550.
- Elmen J, Lindow M, Schutz S, et al. LNA-mediated microRNA silencing in non-human primates. Nature. 2008;452:896–899.
- Krutzfeldt J, Rajewsky N, Braich R, et al. Silencing of microRNAs in vivo with ‘antagomirs’. Nature. 2005;438:685–689.
- Ebert MS, Neilson JR, Sharp PA. MicroRNA sponges: competitive inhibitors of small RNAs in mammalian cells. Nat.Methods. 2007;4:721–726.
- Ebert MS, Sharp PA. MicroRNA sponges: progress and possibilities. Rna. 2010;16:2043–2050.
- Brown BD, Gentner B, Cantore A, et al. Endogenous microRNA can be broadly exploited to regulate transgene expression according to tissue, lineage and differentiation state. Nat Biotechnol. 2007;25:1457–1467.
- Haraguchi T, Ozaki Y, Iba H. Vectors expressing efficient RNA decoys achieve the long-term suppression of specific microRNA activity in mammalian cells. Nucleic Acids Res.. 2009;37:e43.
- Hollensen AK, Thomsen R, Bak RO, et al. Improved microRNA suppression by WPRE-linked tough decoy microRNA sponges. Rna. 2017;23:1247–1258.
- Bak RO, Hollensen AK, Primo MN, et al. Potent microRNA suppression by RNA Pol II-transcribed ‘Tough Decoy’ inhibitors. Rna. 2013;19:280–293.
- Haraguchi T, Nakano H, Tagawa T, et al. A potent 2ʹ-O-methylated RNA-based microRNA inhibitor with unique secondary structures. Nucleic Acids Res. 2012;40:e58.
- Xie J, Ameres SL, Friedline R, et al. Long-term, efficient inhibition of microRNA function in mice using rAAV vectors. Nat.Methods. 2012;9:403–409.
- Jeong D, Yoo J, Lee P, et al. miR-25 tough decoy enhances cardiac function in heart failure. Mol Therapy: Journal Am Soc Gene Ther. 2018;26:718–729.
- Kluiver J, Gibcus JH, Hettinga C, et al. Rapid generation of microRNA sponges for microRNA inhibition. PLoS One. 2012;7:e29275.
- Dhanasekaran R, Gabay-Ryan M, Baylot V, et al. Anti-miR-17 therapy delays tumorigenesis in MYC-driven hepatocellular carcinoma (HCC). Oncotarget. 2018;9:5517–5528.
- Marquitz AR, Mathur A, Nam CS, et al. The epstein-barr virus BART microRNAs target the pro-apoptotic protein Bim. Virology. 2011;412:392–400.
- Kang D, Skalsky RL, Cullen BR. EBV BART MicroRNAs target multiple pro-apoptotic cellular genes to promote epithelial cell survival. PLoS Pathog. 2015;11:e1004979.
- Bernhardt K, Haar J, Tsai MH, et al. A viral microRNA cluster regulates the expression of PTEN, p27 and of a bcl-2 Homolog. PLoS Pathog. 2016;12:e1005405.
- Choy EY, Siu KL, Kok KH, et al. An epstein-barr virus-encoded microRNA targets PUMA to promote host cell survival. J Exp Med. 2008;205:2551–2560.
- Feederle R, Linnstaedt SD, Bannert H, et al. A viral microRNA cluster strongly potentiates the transforming properties of a human herpesvirus. PLoS Pathog. 2011;7:e1001294.
- Feederle R, Haar J, Bernhardt K, et al. The members of an epstein-barr virus microRNA cluster cooperate to transform B lymphocytes. J Virol. 2011;85:9801–9810.
- Xia T, O’Hara A, Araujo I, et al. EBV microRNAs in primary lymphomas and targeting of CXCL-11 by ebv-mir-BHRF1-3. Cancer Res. 2008;68:1436–1442.
- Nachmani D, Stern-Ginossar N, Sarid R, et al. Diverse herpesvirus microRNAs target the stress-induced immune ligand MICB to escape recognition by natural killer cells. Cell Host Microbe. 2009;5:376–385.
- Haneklaus M, Gerlic M, Kurowska-Stolarska M, et al. Cutting edge: miR-223 and EBV miR-BART15 regulate the NLRP3 inflammasome and IL-1beta production. J Immunol. 2012;189:3795–3799.
- Hooykaas MJG, van Gent M, Soppe JA, et al. EBV MicroRNA BART16 Suppresses Type I IFN Signaling. J Immunol. 2017;198:4062–4073.
- Tagawa T, Albanese M, Bouvet M, et al. Epstein-Barr viral miRNAs inhibit antiviral CD4+ T cell responses targeting IL-12 and peptide processing. J Exp Med. 2016;213:2065–2080.
- Albanese M, Tagawa T, Bouvet M, et al. Epstein-Barr virus microRNAs reduce immune surveillance by virus-specific CD8+ T cells. Proc Natl Acad Sci U S A. 2016;113:E6467–E6475.
- Hooykaas MJ, Kruse E, Wiertz EJ, et al. Comprehensive profiling of functional Epstein-Barr virus miRNA expression in human cell lines. BMC Genomics. 2016;17:644.
- Lebbink RJ, Lowe M, Chan T, et al. Polymerase II promoter strength determines efficacy of microRNA adapted shRNAs. PLoS One. 2011;6:e26213.
- Lorenz R, Bernhart SH, Siederdissen HZ, et al. ViennaRNA Package 2.0. Algorithms for Molecular Biology: AMB. 2011;6:26.
- Bernhart SH, Muckstein U, Hofacker IL. RNA Accessibility in cubic time. Algorithms for Molecular Biology: AMB. 2011;6:3.
- Longnecker RM, Kieff E, Cohen JI. Epstein-Barr Virus. In: Knipe DM, Howley PM, editors. Fields Virology. 6th ed. Philadelphia (PA): Lippincott Williams & Wilkins; 2013. p. 1898–1959.
- Kertesz M, Iovino N, Unnerstall U, et al. The role of site accessibility in microRNA target recognition. Nat Genet. 2007;39:1278–1284.
- Tafer H, Ameres SL, Obernosterer G, et al. The impact of target site accessibility on the design of effective siRNAs. Nat Biotechnol. 2008;26:578–583.
- Mockenhaupt S, Grosse S, Rupp D, et al. Alleviation of off-target effects from vector-encoded shRNAs via codelivered RNA decoys. Proc Natl Acad Sci U S A. 2015;112:E4007–4016.