
ABSTRACT
The validation of microRNAs (miRNAs) identified by next generation sequencing involves amplification-free and hybridization-based detection of transcripts as criteria for confirming valid miRNAs. Since respective validation is frequently not performed, miRNA repositories likely still contain a substantial fraction of false positive candidates while true miRNAs are not stored in the repositories yet. Especially if downstream analyses are performed with these candidates (e.g. target or pathway prediction), the results may be misleading. In the present study, we evaluated 558 mature miRNAs from miRBase and 1,709 miRNA candidates from next generation sequencing experiments by amplification-free hybridization and investigated their distributions in patients with various disease conditions. Notably, the most significant miRNAs in diseases are often not contained in the miRBase. However, these candidates are evolutionary highly conserved. From the expression patterns, target gene and pathway analyses and evolutionary conservation analyses, we were able to shed light on the complexity of miRNAs in humans. Our data also highlight that a more thorough validation of miRNAs identified by next generation sequencing is required. The results are available in miRCarta (https://mircarta.cs.uni-saarland.de).
Introduction
MicroRNAs (miRNAs) have been in the focus of thousands of manuscripts over the past two decades. Experimental as well as bioinformatics techniques have continuously improved such that researchers can now choose from a broad spectrum of wet-lab and in silico tools for the detection and downstream analysis of miRNAs [Citation1,Citation2]. However, there is still an ongoing discussion regarding how to determine which of the identified miRNAs are actually true positives and which ones are artifacts introduced, for example, by amplification in high-throughput sequencing studies. In addition to the standard reference database miRBase [Citation3–Citation5], several other repositories for miRNAs have been recently created. These repositories include databases that are very specific, such as miRGeneDB [Citation6], which focuses on miRNAs that are likely true positives, or databases that are trimmed for sensitivity, such as miRCarta [Citation7]. The latter class of databases lists all potential miRNA candidates instead of only the very likely candidates. Consequently, the more sensitive databases are one to three orders of magnitude larger than the specific repositories. Given these and other developments (e.g. bias due to low-quality samples [Citation8]), there is an increasing demand for higher standards in the validation of miRNAs. Especially, if further downstream analysis approaches are applied to false positive miRNA candidates, errors in miRNA prediction can lead to misleading results. For example, a target gene set could be inferred from a false positive miRNA candidate, and a target pathway could be pursued from the target gene set that lacks biological relevance.
Among the hallmark studies on miRNAs, in 2003, Ambros and co-workers defined five criteria to characterize miRNAs as validated miRNAs [Citation9]. These criteria include two expression criteria (the detection of a distinct ~22-nt RNA transcript by hybridization to a size-fractionated RNA sample and the identification of the ~22-nt sequence in a library of cDNAs made from size-fractionated RNA) and three additional biogenesis criteria. While the latter of the two expression criteria can be fulfilled in high-throughput studies based on massive parallel sequencing, the miRNA candidate sets from these results are often not validated by hybridization-based approaches. Northern blotting was originally used as a validation approach; however, this strategy is difficult to perform for tens of thousands of candidates. Microarray hybridization and amplification-free detection of the candidates represents one reasonable alternative. In addition to the sole detection of candidates, analyses of differential expression of the candidates in different tissues [Citation10], cell types [Citation11,Citation12] or between patients and controls [Citation13] can provide additional evidence for new miRNAs.
In previous studies, our group as well as others [Citation11,Citation14,Citation15] presented large sets of potentially new miRNAs from next generation sequencing (NGS) datasets. However, the miRNA results from NGS are error-prone and heavily dependent on the sample quality or RNA integrity [Citation8,Citation14,Citation16]. We previously used these NGS-based discovery studies to build a microarray containing 11,877 miRNA candidates and tested this array with different tissues (e.g. testis, heart, brain, among others) and body fluids (e.g. plasma) as well as blood cells [Citation17]. From the resulting profiles, we generated a second array containing the most reliable miRNAs. This array consists of 558 miRNAs from miRBase v21 and 1,709 miRNA candidates from other studies. For the miRNAs showing positive signals, the first expression criterion by Ambros (the hybridization-based detection) has already been fulfilled.
Therefore, for the next step, we examined the expression levels of the miRNA candidates in human pathologies to identify those that showed varying expression as a strategy to determine biologically relevant and functional miRNAs. We thus hybridized samples from 187 individuals on microarrays. We selected diseases affecting two different organs known to have different tissue and blood miRNA repertoires [Citation18], namely the lung and the brain. For the lung, we selected non-small cell lung cancer (NSCLC), small cell lung cancer (SCLC) and non-tumor lung disease (NTLD) such as chronic obstructive pulmonary disease (COPD). For brain we selected Parkinson’s disease (PD) as an example of a neurodegenerative disorder. After evaluation of the 187 individual miRNomes, we identified candidates for a second stage validation by Northern blotting. For all miRNA candidates, a downstream analysis has been performed as already available for miRNAs in the miRBase. This includes target gene and target pathway prediction as well as the analysis of evolutionary conservation. Finally, we used the results of the present study, i.e. the disease associations, predicted target genes and target pathways and the degree of evolutionary conservation, to improve the quality and the scope of our previously published miRNA database miRCarta. The workflow of the research project is presented in .
Figure 1. Schematic of the study flow [Citation1]. We mined miRNA candidates from next generation sequencing experiments from the literature [Citation2]. We designed a custom microarray using these candidates [11,877] and hybridized different tissues and blood to assess which candidates are more likely real miRNAs [Citation3]. From the identified high confidence miRNAs [2,267], we built a second custom microarray, which was used in the current study to measure the differential expression in patients with different diseases and controls [Citation4]. We performed statistical evaluation and added the results to our miRNA repositories and analysis pipelines [Citation5]. We selected several candidate precursors to perform validation with Northern blotting. PD = Parkinson’s disease; NSCLC = non-small cell lung cancer; SCLC = small cell lung cancer; NTLD = non-tumor lung disease.
![Figure 1. Schematic of the study flow [Citation1]. We mined miRNA candidates from next generation sequencing experiments from the literature [Citation2]. We designed a custom microarray using these candidates [11,877] and hybridized different tissues and blood to assess which candidates are more likely real miRNAs [Citation3]. From the identified high confidence miRNAs [2,267], we built a second custom microarray, which was used in the current study to measure the differential expression in patients with different diseases and controls [Citation4]. We performed statistical evaluation and added the results to our miRNA repositories and analysis pipelines [Citation5]. We selected several candidate precursors to perform validation with Northern blotting. PD = Parkinson’s disease; NSCLC = non-small cell lung cancer; SCLC = small cell lung cancer; NTLD = non-tumor lung disease.](/cms/asset/d81ea19a-b5c5-4c9a-8826-70b96d559d9e/krnb_a_1559689_f0001_c.jpg)
Results
In this study, we aimed to provide new information on the validity of miRNAs by hybridization-based detection, disease associations, evolutionary conservation and target gene and target pathway information.
Hybridization-based detection of mirna candidates
We established a microarray containing probes for measuring the expression of 2,267 miRNAs and miRNA candidates that showed expression in at least one of eight different tissues or blood/plasma samples in a pre-screening using the same array-based technology () [Citation17,Citation19]. This set consists of 558 miRNAs from miRBase (predominantly from the earlier versions 1–12 of this database) and 1,709 additional miRNA candidates from previous studies not yet annotated in miRBase [Citation11,Citation14,Citation19]. Using this microarray, we profiled the expression of miRNAs and miRNA candidates in 187 samples from patients with NSCLC, SCLC, NTLD (mostly COPD) or PD as well as controls. To assess the quality and replicability of the array, we also hybridized four process controls. The selection of these cohorts allows addressing clinical questions in an increasing degree of specificity: using this approach, we can identify which miRNAs and miRNA candidates show 1) differential expression between diseases and controls in general; 2) differential expression between diseases of different organs, i.e. lung disease vs. neurological disease; and 3) differential expression between diseases of the same organ, i.e. lung cancers vs. NTLD.
To assess the quality of the sample processing and hybridization, we used four process controls (each on a different chip). The four samples were technical replicates that were labeled and hybridized coming from the same miRNA stock pool. We computed the pairwise correlations of the raw expression values of these samples, which showed that the process controls are highly correlated (minimum: 99.7%; maximum: 99.8%; average: 99.7%) and which demonstrates that the results are well reproducible.
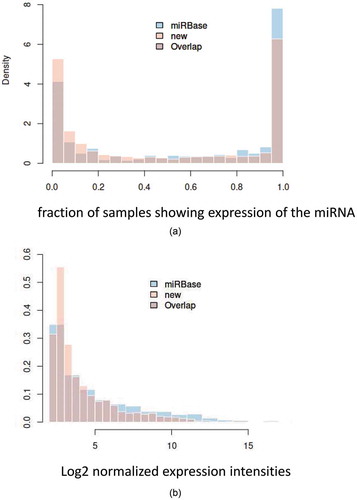
We next analyzed the total number of expressed miRNAs and miRNA candidates in our samples. When the expression of a miRNA was defined by a significant signal above background in at least one of the tested samples (least stringent criterion), the results detected the expression of 524 of 558 (93.9%) miRNAs from miRBase and 1,594 of 1,709 of miRNA candidates (93.3%). If the analysis was limited to miRNAs that were present in at least 5% of all tested samples (more stringent criterion), the results still detected 444 of 558 miRBase miRNAs (79.6%) and 1,288 of 1,709 of miRNA candidates (75.4%). On the other extreme, 218 of 558 miRNAs from miRBase (39.1%) and 536 of 1,709 (31.4%) miRNA candidates were present in at least 95% of all tested samples. Although the frequency of detectable miRNAs from miRBase was significantly higher (p = 1.8x10⁻⁵ in one-tailed Wilcoxon rank sum test), our results suggest a complex miRNA repertoire in human pathologies, going far beyond the miRNAs known from miRBase. The distribution of miRNAs that can be detected in 0% to 100% of samples (in intervals of 5%) is presented as a histogram in . Like the frequency, the expression of miRBase miRNAs was also significantly higher compared with the expression of miRNA candidates (p = 2.1x10⁻⁹ in one-tailed Wilcoxon rank sum test). However, despite the significantly lower expression of new miRNA candidates in general, still a substantial fraction of these candidates showed log2 expression intensities in the higher expression range (). These results suggest a highly complex situation with respect to both the quality and the quantity of the human miRNome. In particular, the extent to which miRNAs and miRNA candidates are expressed in control and disease samples was far above what is known to date.
Figure 2. Expression density plot a: Histogram showing the distribution of the detection frequency of miRNAs annotated in miRBase (miRBase) and miRNA candidates not annotated in miRBase (new). The x-axis represents 0% to 100% of samples in intervals of 5%. The y-axis represents the relative fraction of miRNAs and miRNA candidates with the respective frequency in the 187 samples. b: Histogram showing the abundance level of miRNAs annotated in miRBase (miRBase) and miRNA candidates not annotated in miRBase (new). The x-axis represents log2 of normalized microarray expression levels. The y-axis represents the relative fraction of miRNAs and miRNA candidates with the respective expression level in the 187 samples.
Disease-association of mirna candidates
Our study set-up allows for comparison of miRNA expression levels between patients with specific diseases and controls, between patients with diseases of different organs and between patients with diseases of the same organ. Volcano plots that provide an overview and show the quantification and comparison of the results from these analyses are presented in –E.
Figure 3. Volcano plots for the series of comparisons. For each comparison, the log2 fold change is shown on the x-axis and the negative decadic logarithm of the raw p-value (Wilcoxon rank sum; two-tailed) is shown on the y-axis. Nominally significant miRNAs are highlighted in red or green, depending on whether their expression levels are downregulated or upregulated, respectively, in the second comparison group compared with the first. P-values that were significant after adjustment are shown in dark green and red. The volcano plots on top shown broader comparisons, while the scatter plots at the bottom show results for specific comparisons. NTLD = non-tumor lung disease; LC = lung cancer; PD = Parkinson’s disease; LD = lung disease; SCLC = small cell lung cancer; NSCLC = non-small cell lung cancer.
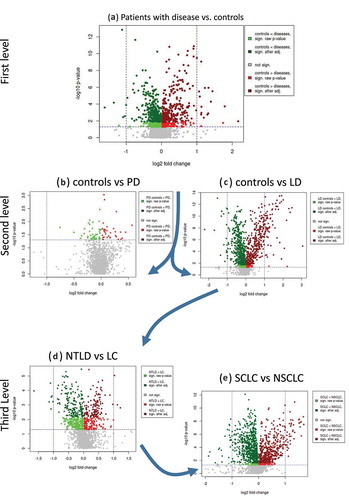
We first compared the levels of miRNAs and miRNA candidates in the heterogeneous set of all 116 patients with the 71 controls (). After adjustment for multiple testing, 602 miRNAs (185 miRBase, 417 miRNA candidates) were identified as differentially expressed between patients with disease and controls (p < 0.05; two-tailed Wilcoxon rank sum test; FDR adjustment). The miRNA with the lowest adjusted p-value of 3.3 × 10⁻¹⁰ was a candidate deposited in miRCarta with the ID of m-4408 that was proposed by Londin et al. [Citation11]. Most interestingly, four of the 10 most significant identified miRNAs were miRNA candidates not yet annotated in miRBase ().
Table 1. The top 10 significant differentially expressed miRNAs/miRNA candidates in patients with disease (all diseases combined, n = 116) compared with controls (all controls combined, n = 71).
For the second level of analysis, we compared PD patients (n = 34) versus controls (n = 34) as well as patients suffering from lung diseases (n = 82) to controls (n = 37) (). We observed smaller effect sizes in the evaluation of PD patients versus controls compared with the analysis of patients with lung diseases versus controls. After correction for multiple testing, no miRNAs were identified as significantly deregulated in this comparison of PD patients and controls. In contrast, in comparing patients with lung diseases with controls, we identified 914 miRNAs (277 known; 637 candidate) that were significantly differentially expressed. As shown in , the 10 most significant miRNAs are known from miRBase v21 and predominantly show a downregulation in patients with lung disease.
Table 2. The top 10 significant differentially expressed miRNAs/miRNA candidates in controls (n = 37) versus lung diseases (n = 82).
In the third level of the disease analysis, we compared 58 lung cancer patients (NSCLC and SCLC) with 24 patients with NTLD and identified 301 significantly deregulated miRNAs and candidates (). Here, four of the most significant markers (miRCarta IDs: m-6186, m-3711, m-4507, m-2646) were not known from miRBase and were discovered in the study by Londin et al. [Citation11]. We observed that the significantly deregulated miRNAs showed predominantly upregulated expression in cancer patients.
Finally, the most specific comparison was carried out in the last level of the analysis between 30 NSCLC and 28 SCLC patients (). In this case, the identified miRNAs showed very significant p-values and again, the most significant miRNA was not annotated in miRBase v21 (miRCarta-ID m-16905, adjusted p-value of 1.8 × 10⁻⁹) but has been identified by our group [Citation19]. Among the ten most significant miRNAs in this comparison are seven miRNA candidates not annotated in miRBase v21. The complete results of the comparisons are shown in Table S1.
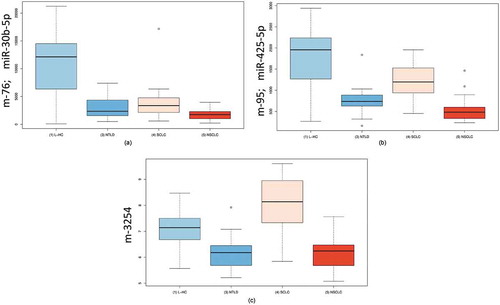
Since the miRNA expression was highly variable in the patients and especially between the different lung diseases, we additionally performed ANOVA for the following four groups [Citation1]: controls [Citation2], NSCLC patients [Citation3], SCLC patients and [Citation4] patients with NTLD. The significance values of the ANOVA were substantially lower compared with the already highly significant p-values in the respective pairwise comparisons. Furthermore, 9 of the 10 most significant miRNAs were already annotated in miRBase and since miRBase v11 or earlier. The two most significant miRNAs, hsa-miR-30b-5p () and hsa-miR-30c-5p (adjusted p-value < 10−17), were downregulated in all lung diseases compared with controls. Hsa-miR-425-5p (, p = 7.2x10⁻¹⁸) was mostly downregulated in NSCLC patients, while SCLC patients showed almost the expression as the controls. The most significant miRNA candidate not yet annotated in miRBase was miRCarta-ID m-3254 (p-value 1.1 × 10⁻¹⁵) that was identified in the Londin study [Citation11] (). The results of the ANOVA analysis are shown in Table S2.
Figure 4. Boxplots resulting from an ANOVA. a: Boxplots for miRNA-30c-5p in four groups of patients. This miRNA was significantly downregulated in patients of all diseases compared with unaffected controls. b: Boxplots for miRNA-425-5p in four groups of patients. This miRNA showed the most significant downregulation in NSCLC patients. c: Boxplots for m-3254 in four groups of patients. This miRNA, which is not annotated in the miRBase, was most significantly upregulated in SCLC patients. L-HC = matched controls for the lung cancer samples; NTLD = non-tumor lung disease; SCLC = small cell lung cancer; NSCLC = non-small cell lung cancer.
Evolutionary conservation
A further important evidence factor of miRNAs is their evolutionary conservation. To assess the evolutionary conservation of the miRNAs and candidates included on the chip, we mapped their sequences without mismatches against the genomes of 148 organisms integrated in miRCarta and counted a hit for an organism if we found the sequence at least one time in its genome. On average, we found matches for an individual sequence in 7.5 organisms for the miRNAs and candidates. We next investigated whether the evolutionary conservation was higher for the miRNAs that were significantly differentially expressed in the comparisons that are described in the previous section. For all pairwise comparisons described in this manuscript (see and Table S1), we extracted the significantly deregulated miRNAs (two-tailed Wilcoxon rank sum test; adjusted p-value < 0.05) and the remaining miRNAs on the chip and counted the number of organism hits per miRNA for both miRNA sets as above. We assessed the significance with a one-tailed Wilcoxon rank sum test. For the first comparison of controls versus diseases, we found on average 8.7 organism hits for significantly deregulated miRNAs versus 7.1 hits for non-significant miRNAs (p-value: 0.002). We see similar tendencies for the comparison of patients with lung disease compared with controls (9.3 versus 6.3 average hits, p-value = 8.6x10⁻¹²) and patients with NTLD versus lung cancer (9.6 versus 7.2 average hits, p-value = 0.0004). The comparison of patients with SCLC versus NSCLC showed an almost equal distribution of hits (7.5 versus 7.6 average hits, p-value not significant). When we combined all significantly deregulated miRNAs of the pairwise comparisons, we found that these miRNAs have more organism hits on average (7.8 versus 6.5), although the difference in the distributions was not statistically significant (p-value = 0.078). For cases in which we observed significant p-values, the average numbers of organism hits were well above the average number of hits for the chip, suggesting that miRNAs that showed significant differential expression in our comparisons were more conserved compared with the other miRNAs on the chip.
Target genes and target pathways
To examine whether the disease-specific miRNAs target similar biological pathways as the non-significant miRNAs identified in our comparisons, we next performed target predictions for the 2,267 total miRNAs using TargetScan 7.1 [Citation20]. The prediction resulted in 16,773,110 miRNA-target interactions, which translates to roughly 7,400 targets per miRNA. To reduce the number of potential false positive targets, we set a threshold at −0.625 for the context++ score of TargetScan (corresponding to the first quartile of scores for the prediction) and only considered predicted targets with a lower (better) context++ score. This reduced the number of predicted targets to 4,190,506 and to approximately 1,800 targets per miRNA on average. A closer examination revealed that the known miRNAs from miRBase had more predicted targets sites than the novel candidates (one tailed Wilcoxon rank sum test, p-value = 4.7x10⁻¹¹).
To obtain a general overview as to which KEGG pathways are enriched for this target set, we performed Gene Set Enrichment Analysis (GSEA) with GeneTrail2 [Citation21] using the target list sorted by the context++ score. We found that the ECM-receptor interaction, Focal adhesion, ABC transporters, and Axon guidance enriched pathways were enriched, among others. We then performed the same analysis for the targets of the candidate miRNAs and the miRBase miRNAs on the chip in separate analyses. For the candidate miRNAs, we also found that the four above-mentioned pathways were enriched in this set. For the miRBase miRNAs, we found that ECM-receptor interaction, Focal adhesion and ABC transporter pathways were enriched, but not Axon guidance. These results suggest that the target sets with the best prediction scores were very similar for the known and candidate miRNAs.
We next examined if the significant miRNAs of the pairwise comparisons were enriched for specific pathways by performing an over-representation analysis (ORA) against the targets of all miRNAs on the chip as reference. Since the translation of miRNAs into their predicted targets was very unspecific, we did not find any enriched pathways for the significant miRNAs of any comparison. To obtain more specific results, we also performed ORA with the top 10 significant miRNAs from the controls versus disease comparison. This analysis yielded two significantly enriched pathways: miRNAs in cancer and ErbB signaling pathway. In general, we observed similarities between the target sets of miRNAs and candidates. However, a more detailed analysis of the targets of significantly deregulated miRNAs would require target predictions that are more specific and yield less false positive annotations. To visualize the results of target predictions for single candidate miRNAs, we updated our databases miRCarta and miRPathDB accordingly. The miRNA candidates of the chip are linked in miRCarta to the corresponding results in miRPathDB, which lists the predicted targets, significant categories if available and similarities in sequence, target genes and pathways to other miRNA candidates.
Validation of mirnas in cell culture
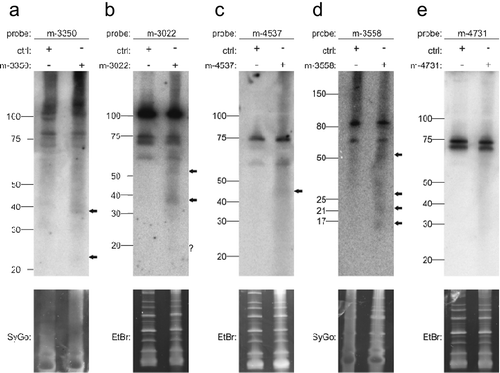
In addition to the two expression criteria proposed by Ambros et al. [Citation9], three additional criteria involved the biogenesis of miRNAs. Validation evidence can be obtained by several experimental approaches, such as the knockout of genes that are required for the processing of miRNAs, e.g. Drosha, Dicer, or Exportin-5, or detection of the mature form using Northern blotting. We decided to use Northern blots. Since the endogenous expression levels of miRNA candidates may be too low, we cloned the predicted precursors and flanking genomic regions into pSG5 expression vectors and transfected these vectors into HEK293T cells. RNA isolated from these cells was used for Northern blotting and mature miRNA candidates were detected using specific, radiolabeled hybridization probes. We selected five miRNA candidates that were significantly deregulated in the comparison of NSCLC versus SCLC. We selected candidates with the highest significance values as well as candidates with adjusted p-values closer to 0.05. The most significant miRNA that was stably expressed above the background was m-3350 (p = 5.04x10⁻⁷), for which we detected a stronger signal at about 40 nt and a weak signal at about 22 nt (). Similarly, as observed with three other miRNAs (m-3022, p = 5.0x10⁻⁶; m-4537, p = 0.014; m-3558, p = 0.003), weak signals at different heights were detected (). The only miRNA candidate that did not yield any signal in the validation experiments was m-4731 (p = 0.007) (). In sum, the careful pre-selection of candidates resulted in a high validation success rate.
Figure 5. Northern blot detection of miRNA candidates m-3350 (a), m-3022 (b), m-4537 (c), m-3558 (d) and m-4731 (e) using radiolabeled probes in HEK293T cells transfected with the respective overexpression constructs. Ctrl indicates transfection of pSG5 vector alone. SYBR Gold (SyGo) or ethidium bromide (EtBr) was used to confirm equal loading. Markers were used to confirm RNA ladders sizes (shown on the left of each gel). Arrows indicate specific signals.
Discussion
Parallel sequencing allows the identification of many potential miRNAs, even if no reference genomes are available [Citation22]. The miRNAs discovered by high-throughput sequencing require validation as several steps may lead to false positive miRNA candidates, including library preparation, amplification and sequencing steps. Northern blot analysis was originally used to validate miRNAs; however, when obtaining very large sets of miRNAs, array-based and amplification-free validation strategies represent a reasonable first alternative to narrow down candidates for low-throughput testing using conventional Northern blot. In this study, we collected a set of 2,267 miRNAs and miRNA candidates from different repositories and the literature and measured their expression in 187 clinical samples. One strategy in defining the cohort of patients would be to focus on one specific analytical comparison, such as low stage non-small cell lung tumors against tumor-free COPD patients. This strategy would make sense especially for diagnostic studies. We aimed to determine the heterogeneity and specificity of miRNA abundance, and thus we examined patients affected by diseases of different organs. We found that the miRNome, affected target genes and target pathways in patients and controls was far more complex as suggested by the miRBase miRNAs alone.
Generally, the variability of miRNA expression was higher in lung cancer patients. This, in addition with the comparably small number of PD cases and controls (n = 34) as well as the large number of features resulted in nominally significant miRNAs not being significant after adjustment for multiple testing. Thus, larger cohorts are required to confirm the results in PD. Focusing on lung diseases, we observed a strong upregulation of significant miRNAs in lung cancer compared with NTLD. While the comparison of SCLC to NSCLC revealed that many markers not annotated in miRBase were highly significant, ANOVA of the overall lung cohort (controls, NSCLC, SCLC and non-tumor lung diseases) highlighted many well-known lung cancer miRNAs. Zhong et al. also observed a downregulation of miR-30b and miR-30c, the two most significant miRNAs that were downregulated in peripheral blood from NSCLC patients in our study, in NSCLC tissue specimens compared with adjacent non-tumor tissues [Citation23]. Furthermore, both miRNAs target and down-regulate Rab18 expression such that increased levels of miR-30b/c finally inhibit NSCLC cells proliferation [Citation23]. In addition, the promotion of invasion in NSCLC by inducing epithelial mesenchymal transition is promoted by low abundance of miR-30c [Citation24]. Moreover, miR-425-5p might be a driver for tumor formation, growth and progression to higher staging [Citation25]. These examples are only representatives, and a more complete picture of the role of miRNAs in lung cancer is available in several reviews [Citation26,Citation27].
Other important factors of miRNAs are genomic clustering and evolutionary conservation [Citation28]. Both factors were investigated in the original miRCarta publication [Citation7] and our examination of the human non-coding transcriptome [Citation17], in which the expected patterns for new miRNAs were observed. Here, we specifically asked if significant miRNAs show a higher rate of evolutionary conservation compared with nonsignificant miRNAs. Indeed, we were able to determine higher rates of evolutionary conservation in most comparisons of miRNAs; the most significant conservation rate was observed in the comparison of lung diseases against controls.
Of course, the validation of miRNAs does not stop by providing information on the expression using hybridization-based approaches. Knowledge on the biological function of miRNAs as regulators of gene expression can support the validity. For example, functional cross-linking followed by Argonaute immunoprecipitation and sequencing [Citation11] can be performed. To determine whether miRNAs are processed according to the canonical biogenesis, important proteins such as Drosha, Dicer, or Exportin 5 can be knocked out. However, some canonical miRNAs can still be produced without Dicer or Exportin 5 [Citation29]. Here we used a different strategy: we cloned the precursor and flanking regions and overexpressed the miRNA in in HEK293T cells. We then provided evidence for the expression of the radioactively labeled mature miRNA by Northern blot analysis. Low-throughput experiments are only feasible for validation of a small set of new miRNAs. In our experiments, we obtained signals for 4 of the 5 tested miRNA candidates. While in some cases, we obtained clear signals matching the expected size of miRNAs, in other cases the signals were less strong and did not completely match the expected size of mature miRNAs.
In conclusion, here we provide evidence for a significantly more complex human miRNome that is affected by and affects human pathological processes. Our results also contribute to the evidence that a thorough validation of new miRNA candidates is essential to foster the translation of miRNAs to clinical care.
Materials and methods
Design of the microarray
We previously described the set-up of a microarray containing 11,877 probes of human miRNAs, as sketched in the upper part of [Citation17]. In brief, the 11,877 miRNAs and miRNA candidates were evenly distributed across five microarrays since a single array did not contain enough spots to measure the miRNAs in the recommended number of 20 replicates. This high number of replicates is essential for a stable overall signal intensity estimation. The custom microarrays were manufactured by Agilent (Santa Clara, CA, USA). We next hybridized the custom microarrays with RNA samples from brain, kidney, liver, testis and heart tissue samples as well as PAXgene blood and plasma. From the results of our initial experiments, we selected the miRNAs that can be measured in blood and plasma without amplification using hybridization and created a new array tailored for the measurement of such miRNA profiles. This second array (manufactured by Agilent) is commercially available from Hummingbird Diagnostics GmbH (Heidelberg, Germany) for biomarker studies and contains a total of 2,267 miRNAs, including 558 miRNAs from miRBase and 1,709 miRNA candidates from other studies. For each miRNA and miRNA candidate, the number of replicates as increased to 40 replicates per miRNA.
Study participants
We selected a study set-up that allows quantifying the variability of the potential new miRNAs in increasing levels of specificity and includes diseases affecting two organs: the lung and the brain. For the lung specimens, we collected whole blood samples of patients with NSCLC, SCLC and NTLD as well as controls in PAXgene tubes (PreAnalytiX) from the Saarland University Hospital (Homburg, Germany). The regional ethics board approved the study and all patients consented to participate in the study. We also selected PD as a neurodegenerative disorder; the National Centre of Excellence in Research on PD in Luxemburg provided the PAXgene samples on PD patients and controls from their biobank. The local ethics committee approved the study and the patients consented to participate in the study. The total cohort of 187 participants consisted of the following: 30 NSCLC patients, 28 SCLC patients, 24 NTLD patients (mostly COPD) and 37 controls; and 34 PD patients and 34 controls. In addition, we hybridized four times a process control, which consists of a pool of extracted RNAs (PAXgene miRNA Kit Qiagen, Hilden, Germany) from seven whole blood samples. The four technical replicates were processed independently and distributed on four different chips to assess the replicability and quality of the sample preparation step.
Sample preparation and microarray measurement
RNA was extracted from all samples using the PAXgene miRNA Kit (Qiagen) according to the manufacturer’s instructions. RNA quality and quantity were evaluated using a Bioanalyzer 2100 Instrument (Agilent Technologies) and NanoDrop ND-1000. Microarray screening of high-quality RNA samples was performed on Agilent’s SureScan DX Microarray Scanner following the manufacturer’s instructions and as described previously [Citation10,Citation30,Citation31].
Bioinformatics
Features representing single miRNA measurements were extracted according to the manufacturer’s instructions and using the software provided by Agilent. All downstream analyses were performed using R. To make the microarray data sets comparable to each other, quantile normalization was first carried out. All miRNA identifiers were mapped to the miRCarta-ID (information on the miRCarta-ID and the database have been published by Backes et al. [Citation7]). For pairwise comparisons, we used the non-parametric Wilcoxon rank sum test as not all miRNA measurements were normally distributed according to Shapiro-Wilk test. For comparisons including more than two groups, analysis of variance (ANOVA) was performed. If not mentioned explicitly, p-values in the manuscript have been adjusted for multiple testing using the Benjamini-Hochberg [Citation32] method and p values of 0.05 were used to indicate the significance level. To assess the evolutionary conservation of miRNAs, we mapped all sequences of miRNAs spotted on the chip without mismatches to 148 reference genomes of organisms available in miRCarta. We computed targets of the miRNAs and candidates on the chip with TargetScan 7.1 [Citation20]. We acquired the official source code comprising three Perl scripts, all untranslated region sequences as 84-way alignments and ORF sequences as 84-way alignments from the corresponding project website (http://www.targetscan.org/vert_71/). We then filtered both files to keep only the sequences from Homo sapiens. Similar to the approach described in the TargetScan publication, we organized the miRNAs into seed families by their seed identity, excised from position 2 to 8 (7-mer) starting at the 5′ end of each miRNA [Citation20]. To predict targets, we applied the three Perl scripts in the order recommended by the authors using standard parameters, in addition to the required preprocessing as described in the README files. Finally, we used the context++ score to sort the predicted targets in decreasing order, since the more negative the context++ score is, the higher is the evidence of capturing a true target.
Validation by northern blot analysis
HEK293T cells were purchased from Leibniz Institute DSMZ (German Collection of Microorganisms and Cell Cultures, Braunschweig, Germany). Candidate miRNA precursor sequences including flanking regions were synthesized by Eurofins Genomics (Ebersberg, Germany) and subcloned into the pSG5 vector (Stratagene, now Agilent Technologies). HEK293T cells (2.4 x 10⁶) were seeded and transiently transfected using PolyFect Transfection Reagent (Qiagen) according to the manufacturer’s instructions. After 48 h, total RNA (including miRNAs) was purified from transfected HEK 293T cells using the miRNeasy Mini Kit (Qiagen) according to the manufacturer’s instructions. Quantity and quality of isolated total RNA including miRNA was determined using the NanoDrop 2000 UV-Vis Spectrophotometer (ThermoFisher Scientific, Waltham, MA, USA) with A260/280 ≥ 2 and A260/230 ≥ 1.8 and Bioanalyzer 2100 (Agilent) with RIN > 8. For Northern blot analysis, 20 µg total RNA including miRNA was separated in 12% denaturing urea-polyacrylamide gels using the SequaGel UreaGel System (National Diagnostics, Nottingham, UK) and 1x TBE running buffer. A small RNA marker was used to estimate the sizes of RNA bands (RiboReadyTM Color Micro RNA ladder, VWR, Radnor, PA, USA; or low range ssRNA Ladder and microRNA Marker, New England Biolabs, Frankfurt am Main, Germany). The gel was stained with ethidium bromide (10 mg/ml in 1x TBE) or 1x SYBRTM Gold (Invitrogen/ThermoFisher Scientific) and processed with a ChemiDoc Touch Imaging System (Bio-Rad, Munich, Germany). For semi-dry electroblotting, the RNA was transferred to a Hybond-N nylon membrane (GE Healthcare Life Sciences, Freiburg, Germany) for 30 min at 15 V and chemically crosslinked using N-(3-dimethylaminopropyl)-N′-ethylcarbodiimide hydrochloride (Sigma-Aldrich, Munich, Germany) for 2 h at 55ºC. The radiolabeled RNA probes were generated using the miRVana miRNA Probe Construction Kit (Ambion/ThermoFisher Scientific) following the manufacturer’s instructions. The DNA template was in vitro transcribed using T7 RNA polymerase and radiolabeled uracil or guanine if the probe only contained two or fewer uracils (Hartmann Analytic, Braunschweig, Germany). The template DNA was removed by DNase I digestion. Hybridization of radiolabeled probes was performed at 55°C with overnight rotating. The next day, the blots were washed twice for 15 min in 5x SSC, 1% SDS and twice for 15 min in 1x SSC, 1% SDS at 55°C and exposed to a storage phosphor screen overnight. The screens were processed using a typhoon scanner (GE Healthcare Life Sciences, Freiburg, Germany); contrast and brightness were automatically adjusted according to the darkest spot on the scanned area. Northern blot images in this manuscript were further manually optimized in terms of contrast and brightness.
Disclosure of Potential Conflicts of Interest
TL, MK, AD, HS, JK are employed by Hummingbird Diagnostics. AK is consultant for Hummingbird Diagnostics.
Supplemental Material
Download Zip (1 MB)Acknowledgments
We acknowledge The Michael J. Fox Foundation for Parkinson’s Research for support (grant 14446). This study has been further financed by Saarland University and Hummingbird Diagnostics as well as the EU FP7 Project BestAgeing. This work was further supported by a grant from the Luxembourg National Research Fund (FNR) within the National Centre of Excellence in Research on Parkinson’s Disease (NCER-PD).
We appreciate the technical support of Anna Anbarcılar und Cassandra Zabler, Hummingbird Diagnostics GmbH as well as the proofreading support of Sabine Lessel, Saarland University. We thank Edanz Group (www.edanzediting.com/ac) for editing a draft of this manuscript.
Supplemental material
Supplemental data for this article can be accessed here.
Additional information
Funding
Related Research Data
References
- Akhtar MM, Micolucci L, Islam MS, et al. Bioinformatic tools for microRNA dissection. Nucleic Acids Res. 2016;44:24–44.
- Mestdagh P, Hartmann N, Baeriswyl L, et al. Evaluation of quantitative miRNA expression platforms in the microRNA quality control (miRQC) study. Nat Methods. 2014;11:809–815.
- Griffiths-Jones S. The microRNA Registry. Nucleic Acids Res. 2004;32:D109–111.
- Griffiths-Jones S. miRBase: the microRNA sequence database. Methods Mol Biol. 2006;342:129–138.
- Griffiths-Jones S, Saini HK, van Dongen S, et al. miRBase: tools for microRNA genomics. Nucleic Acids Res. 2008;36:D154–158.
- Fromm B, Billipp T, Peck LE, et al. A Uniform System for the Annotation of Vertebrate microRNA Genes and the Evolution of the Human microRNAome. Annu Rev Genet. 2015;49:213–242.
- Backes C, Fehlmann T, Kern F, et al. miRCarta: a central repository for collecting miRNA candidates. Nucleic Acids Res. 2017;46(Database issue):D160–D167.
- Backes C, Sedaghat-Hamedani F, Frese K, et al. Bias in High-Throughput Analysis of miRNAs and Implications for Biomarker Studies. Anal Chem. 2016;88:2088–2095.
- Ambros V, Bartel B, Bartel DP, et al. A uniform system for microRNA annotation. Rna. 2003;9:277–279.
- Ludwig N, Leidinger P, Becker K, et al. Distribution of miRNA expression across human tissues. Nucleic Acids Res. 2016;44:3865–3877.
- Londin E, Loher P, Telonis AG, et al. Analysis of 13 cell types reveals evidence for the expression of numerous novel primate- and tissue-specific microRNAs. Proc Natl Acad Sci U S A. 2015;112:E1106–1115.
- Juzenas S, Venkatesh G, Hubenthal M, et al. A comprehensive, cell specific microRNA catalogue of human peripheral blood. Nucleic Acids Res. 2017;45:9290–9301.
- Leidinger P, Backes C, Deutscher S, et al. A blood based 12-miRNA signature of Alzheimer disease patients. Genome Biol. 2013;14:R78.
- Backes C, Meder B, Hart M, et al. Prioritizing and selecting likely novel miRNAs from NGS data. Nucleic Acids Res. 2016;44:e53.
- Friedlander MR, Mackowiak SD, Li N, et al. miRDeep2 accurately identifies known and hundreds of novel microRNA genes in seven animal clades. Nucleic Acids Res. 2012;40:37–52.
- Ludwig N, Becker M, Schumann T, et al. Bias in recent miRBase annotations potentially associated with RNA quality issues. Sci Rep. 2017;7:5162.
- Fehlmann T, Backes C, Alles J, et al. A high-resolution map of the human small non-coding transcriptome. Bioinformatics. 2017;34(10):1621–1628.
- Fehlmann T, Ludwig N, Backes C, et al. Distribution of microRNA biomarker candidates in solid tissues and body fluids. RNA Biol. 2016;13:1084–1088.
- Fehlmann T, Backes C, Kahraman M, et al. Web-based NGS data analysis using miRMaster: a large-scale meta-analysis of human miRNAs. Nucleic Acids Res. 2017;45:8731–8744.
- Agarwal V, Bell GW, Nam JW, et al. Predicting effective microRNA target sites in mammalian mRNAs. Elife. 2015;4:1–38.
- Stockel D, Kehl T, Trampert P, et al. Multi-omics enrichment analysis using the GeneTrail2 web service. Bioinformatics. 2016;32:1502–1508.
- Vitsios DM, Kentepozidou E, Quintais L, et al. Mirnovo: genome-free prediction of microRNAs from small RNA sequencing data and single-cells using decision forests. Nucleic Acids Res. 2017;45:e177.
- Zhong K, Chen K, Han L, et al. MicroRNA-30b/c inhibits non-small cell lung cancer cell proliferation by targeting Rab18. BMC Cancer. 2014;14:703.
- Zhong Z, Xia Y, Wang P, et al. Low expression of microRNA-30c promotes invasion by inducing epithelial mesenchymal transition in non-small cell lung cancer. Mol Med Rep. 2014;10:2575–2579.
- Wang J, Li Z, Ge Q, et al. Characterization of microRNA transcriptome in tumor, adjacent, and normal tissues of lung squamous cell carcinoma. J Thorac Cardiovasc Surg. 2015;149:1404–1414 e1404.
- Inamura K, Ishikawa Y. MicroRNA In Lung Cancer: novel Biomarkers and Potential Tools for Treatment. J Clin Med. 2016;5.
- Leidinger P, Keller A, Meese E. MicroRNAs - Important Molecules in Lung Cancer Research. Front Genet. 2011;2:104.
- Altuvia Y, Landgraf P, Lithwick G, et al. Clustering and conservation patterns of human microRNAs. Nucleic Acids Res. 2005;33:2697–2706.
- Kim YK, Kim B, Kim VN. Re-evaluation of the roles of DROSHA, Export in 5, and DICER in microRNA biogenesis. Proc Natl Acad Sci U S A. 2016;113:E1881–1889.
- Leidinger P, Backes C, Meder B, et al. The human miRNA repertoire of different blood compounds. BMC Genomics. 2014;15:474.
- Leidinger P, Backes C, Blatt M, et al. The blood-borne miRNA signature of lung cancer patients is independent of histology but influenced by metastases. Mol Cancer. 2014;13:202.
- Benjamini Y, Hochberg Y. Controlling the false discovery rate - a practical and powerful approach to multiple testing. J R Stat Soc Ser B-Methodol. 1995;57:289–300.