
 ?Mathematical formulae have been encoded as MathML and are displayed in this HTML version using MathJax in order to improve their display. Uncheck the box to turn MathJax off. This feature requires Javascript. Click on a formula to zoom.
ABSTRACT
The envisioned application of miRNAs as diagnostic or prognostic biomarkers calls for an in-depth understanding of their distribution and variability in different physiological states. While effects with respect to ethnic origin, age, or gender are known, the inter-individual variability of miRNAs across the four seasons remained largely hidden. We sequentially profiled the complete repertoire of blood-borne miRNAs for 25 physiologically normal individuals in spring, summer, fall, and winter (altogether 95 samples) and validated the results on 292 individuals (919 samples collected with the Mitra home sampling device) by RT-qPCR. Principal variance component analysis suggests that the largest variability observed in miRNA expression is due to individual variability and the individuals’ gender. But the results also highlight a deviation of miRNA activity in samples collected during spring time. Following adjustment for multiple testing, remarkable differences are observed between spring and fall (77 miRNAs). The two most dys-regulated miRNAs were miR-181c-5p and miR-106b-5p (adjusted p-value of 0.007). Other significant miRNAs include miR-140-3p, miR-21-3p, and let-7c-5p. The dys-regulation was validated by RT-qPCR. Systems biology analysis further provides strong evidence for the immunological origin of the signals: dys-regulated miRNAs are enriched in CD56 cells and belong to various signalling and immune-system-related pathways. Our data suggest that besides known confounding factors such as age and sex, also the season in which a test is conducted might have a considerable influence on the expression of blood-borne miRNAs and subsequently might interfere with diagnosis based on such signatures.
KEYWORDS:
Introduction
The clinical utility of small non-coding RNAs such as microRNAs (miRNAs) has been claimed for over a decade. Both tissue-based and circulating miRNA patterns have been discovered and partially validated. The set of diseases for which at least proof-of-concept applications have been proposed ranges from oncology (lung cancer, breast cancer, prostate cancer, colon cancer, and others) [Citation1–Citation5] over cardiovascular disorders (heart failure, acute cardiomyopathies, and others) [Citation6–Citation8], neurodegenerative diseases (Parkinson’s Disease, Alzheimer’s disease, and others) [Citation9–Citation11] to infectious diseases (HIV, tuberculosis, and others) [Citation12–Citation14].
In parallel to biomarker discovery, challenges of respective tests have been widely discussed. Besides the general applicability in clinical care and technical challenges (bias depending on the platform that is used, effects of transportation, humidity, or freeze-thaw cycles) [Citation15], also confounding of miRNA biomarkers has been investigated. It is known that smoking has an influence on the miRNA expression [Citation16], likewise age- and gender-dependent variability is known [Citation17]. Further, the ethnic background has a substantial influence on the variability of miRNAs [Citation18]. Importantly, physical activity, for example strength and endurance training, has an influence on the miRNA patterns [Citation19].
Another factor that has been only marginally considered so far is the variability of miRNAs over the four seasons. There is already evidence of seasonal expression of miRNAs in different tissues in animals. For example, miR-132 and miR-212 have been shown to be seasonally expressed in specific brain areas of songbirds and mice, and seem to modulate seasonal adaptation [Citation20,Citation21]. In sheep, several miRNAs are differentially expressed in ovaries during the breeding season [Citation22]. Consequently, it seems reasonable to assume that there might also be blood miRNAs showing seasonal expression patterns. Even more so, as there is evidence of seasonal gene expression patterns in human blood. A large study published in Nature Communications showed that of genes in human peripheral blood mononuclear cells (PBMC) show seasonal expression patterns with either high expression in summer and low expression in winter or vice versa [Citation23]. As they found opposing expression patterns for seasonally expressed genes in populations from the northern and southern hemisphere, these expression differences might be related to the daytime lengths and duration of sun exposure. One possible explanation for the observed seasonal expression patterns in PBMCs is the difference of vitamin D status during the four seasons, which has an impact on energy metabolism in these cells [Citation24].
Even human immune system function as a whole seems to be subjected to seasonal changes, which might be one factor for the seasonality of human infections [Citation25]. The cellular composition of blood changes during the course of a year, with high counts of monocytes, neutrophils, and white blood cells and low counts of lymphocytes in spring [Citation23]. These seasonal fluctuations in blood composition are mirrored in seasonal gene expression profiles of whole blood samples collected in PAXGene tubes [Citation26,Citation27]. Therefore, also blood-borne miRNAs collected with these tubes might be influenced by these seasonal effects. In order to be useful in a clinical setting the influence of the season of blood collection on miRNA expression profiles has to be determined more closely.
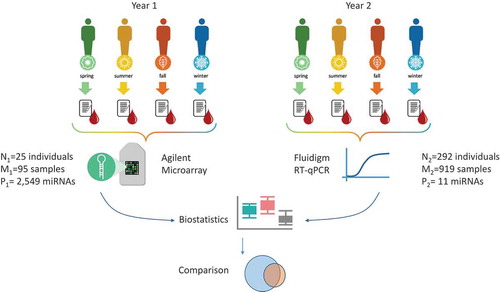
The aim of this study is to provide a comprehensive analysis on how blood-borne miRNA expression varies over the course of four seasons. For identification of seasonally expressed miRNAs, we chose a study set-up based on longitudinal monitoring of the same individuals in order to minimize the impact of inter-individual variability of miRNA expression (). To this end, we collected blood samples from individuals during the course of one year with one sample in each of the four seasons. Subsequently, miRNA profiles were measured using microarrays and evaluated using bioinformatics techniques. For a subset of the relevant miRNAs identified by the microarray screening, we performed a validation study using RT-qPCR and an independent validation sample set. For this set, we used blood collected from
volunteers during the Infit trial (https://www.my-infit.com/). These samples were collected in four rounds during one year using a home microsampling device (Mitra tip) and sent by standard mail to our lab (
samples in total). Since the results between both the primary and the validation study were significantly concordant, our study may be of relevance for basic research studies as well as studies on blood-borne biomarkers that are partially already in clinical translation.
Figure 1. Workflow of the primary study. For individuals, blood samples have been collected in each season over the course of one year. The time interval between two consecutive blood draws for one individual was approximately
weeks. For
of the
individuals, all four seasonal measurements were available, for the remaining people, one season was missing. For a total of
blood samples collected over the study, genome-wide miRNA signatures of
miRNAs were generated. In a second year, for
individuals, blood samples using microsampling devices have been collected in each season. Here, for a total of
blood samples collected over the study,
miRNAs were measured. Both data sets were evaluated individually from each other and the significant miRNAs in both studies were compared.
Methods
Study set-up and individuals
For individuals, seasonal miRNA profiles were generated from blood samples (). While for
individuals at least one measurement per season and four time points in total were available, for further
individuals at least three time points were collected. Altogether,
blood samples have been evaluated in this study.
Of the samples, were from male and
from female individuals. The average age of individuals was
years with a standard deviation of
years.
In addition to the primary study, we carried out a validation with similar demographic parameters as in the initial study sketched above. In the validation cohort, the mean age was years (standard deviation of
years),
of all individuals were females, and
were males. To obtain the required large number of participants, we made use of home sampling microcontainers (Mitra tips) collected from 292 individuals. The individuals had
weeks to return the samples to ensure that the time points matched. Four sampling rounds in the course of one year have been carried out. In total, we obtained
samples that were measured using RT-qPCR.
Blood sample collection and RNA extraction
For the primary study, blood samples were collected in PAX Gene Tubes (BD Biosciences, Franklin Lakes, NJ USA) and total RNA was isolated using PAX Gene Blood miRNA kit (PreAnalytix, Hombrechtikon, Switzerland) according to the manufacturer’s protocol. RNA quality and quantity were measured with Nanodrop 2000 (ThermoFisher Scientific, Waltham, MA, USA) and Bioanalyzer RNA Nano Chip (Agilent Technologies, Santa Clara, CA, USA). Per sample, we reached an average RNA concentration of ng/µl. The quality of the RNA has been checked considering the RNA integrity number (RIN) values. On average, the RIN was
at a standard deviation of
, indicating the overall high quality of the RNA used for this study.
Mirna profiling using microarrays
Total miRNA expression profile was measured using SurePrint Human miRNA microarrays and miRNA complete labelling and hybridization kit (Agilent Technologies, Santa Clara, CA, USA) according to the manufacturer’s recommendations. In short, 300 ng total RNA was dephosphorylated, labelled with Cy3-pCp, and hybridized to the array for 20 h at 55°C. After washing and drying, arrays were scanned using an Agilent microarray scanner. Raw expression data were extracted using Agilent Feature Expression software. The distribution of miRNAs and quality of the microarrays were checked by using the manufacturer’s software. All samples passed this quality control step. Raw data was quantile normalized and log-transformed using R scripts (see Data Science section).
Microsampling, RNA extraction, and quality control
For RNA extraction from micro-sampling devices, two Mitra tips (Neoteryx, California, USA) filled 10 µl blood were used as input. Extraction of total RNA incl. miRNA was performed using the miRNeasy Serum/Plasma kit (Qiagen, Hilden, Germany). For quantification and RNA quality control of purified samples, the Small RNA Kit (Agilent Technologies, Santa Clara, USA) and Agilent 2100 Bioanalyzer instrument were used according to the manufacturer’s instructions.
RT-qPCR analysis
Quantification of miRNA levels of Mitra samples was performed on the Fluidigm Biomark HD system using the 96.96 IFC controller and dynamic arrays according to manufacturer’s instructions (Fluidigm, California, USA). In the validation experiments, we originally performed 40 cycles. According to manufacturer’s advice and based on our own experience, values exceeding 25 tend however to be too close to the background and become error prone. We thus used a threshold of 25 cycles. For normalization and inter-plate comparison, one exogenous (cel-miR-39) and four endogenous RNA controls (RNU44, RNU48, RNU6b, and RPL21) as well as a Mitra standard pooled control sample were measured on each dynamic array. Each miRNA and each control were measured in triplicates. Reverse Transcription, pre-amplification, and RT-qPCR reaction were carried out according to the manufacturer’s protocols (Fluidigm, California, USA).
Data science
The data analysis has been performed in the freely available programming environment R (version 3.3.2. for MacOS). To normalize the microarray data, we applied standard quantile normalization to make the distribution of expression values identical in all samples[Citation28]. The miRNA expression values are sorted for each sample and then the average of all values having the same rank is assigned. Thereby, the highest value in all samples is assigned the average of the highest values. The second highest value is assigned the average of all second highest expression values. This process is iterated over all human mature miRNAs. Then an offset to correct for negative values was added. All further calculations were done on the pre-processed expression intensity values. If not mentioned explicitly, unpaired two-tailed t-tests have been computed for pairwise comparisons. Since not all miRNAs were normally distributed, additionally Wilcoxon Mann–Whitney test, likewise two tailed and unpaired, was conducted. Significance values were adjusted for multiple testing by controlling the false discovery rate and using the Benjamini–Hochberg method. Further, comparisons of the four seasons have been performed by an analysis of variance (ANOVA) as implemented in the R package stats [Citation29]. To estimate the influence of different factors such as gender, season, the individuals and others, principal variance component analysis was performed. Also, clustering was applied using modified scripts from the Heatplus package [Citation30]. In detail, hierarchical clustering of miRNAs was carried out relying on the Euclidean distance after transforming the expression values of the miRNAs to a mean value of and standard deviation of
(z-scores). To reduce the influence of low abundant miRNAs, we removed those having a normalized expression value below 10 before the transformation. The computed dendrogram of the miRNA clusters was cut at a depth of 2/3 of the maximal height of the dendrogram, resulting in 36 distinct clusters. For each of these clusters, we computed a p-value by using an unpaired two-tailed t-test for the z-scores in the two groups we wanted to compare, eg spring versus other seasons. Pathway and target analysis was accomplished with the tools miEAA [Citation31], miRTargetLink [Citation32] and catchMir (https://www.ccb.uni-saarland.de/catchmir). For the miEAA analysis, we uploaded the miRNAs from the microarray sorted by increasing p-values from the ANOVA analysis and performed a miRNA enrichment analysis with default parameters (FDR adjustment of p-values; significance level: 0.05; threshold for minimal numbers of miRNAs per category: 2) for all available functional categories in miEAA. For assessing the enrichment of functional categories for the 36 clusters, we performed for each an over-representation analysis (ORA) with miEAA using the
miRNAs from the microarray as reference set and the same default options as described before.
Results
The influence of different variables on the miRNA expression
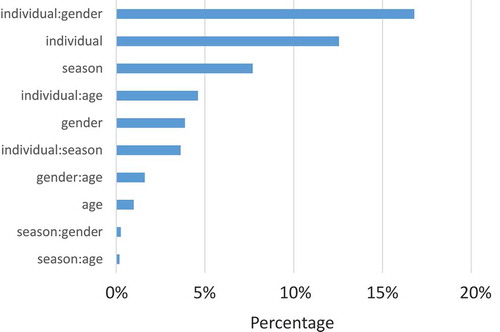
First, we explored the overall influence of the season in direct comparison to other known confounding factors. To this end, we used principal variance component analysis that is usually applied to estimate batch effects. In our case, we investigated the four seasons as four experimental batches. Other groups were defined by gender and age. In the latter case, participants were partitioned into six discrete age classes of equal size. Additionally, we considered each individual as an own group. As detailed in , the largest part of variance in miRNA expression is reflected by the combination of individual and gender, followed by the individual itself. Only the third largest influence is reflected by the season and accounts for of the overall variance. This essentially means that differences between the genders and even more between different individuals are substantially higher when compared to the seasonal variability. The age had an astonishingly low influence on the miRNA expression. This is due to the age range in our study that was intentionally kept very small. Only age ranges exceeding several decades have shown a substantial influence in previous studies [Citation17]. A standard principal component analysis has identified one sample as potential outlier in the scatter plot of the first versus second component. Since the quality control of the original data from the microarray scanner did however not identify any challenges with this sample and the removal of this sample did also not have a significant impact on the results, we decided to show the results without removing any samples.
Figure 2. Result of the principal variance component analysis. The plot shows the influence of several response variables that are considered to be confounding factors. The bars are sorted with decreasing influence. The bar length corresponds to the percentage of variance explained by this variable or the respective combination of variables as depicted by the colon separated identifiers.
Significant seasonal differences
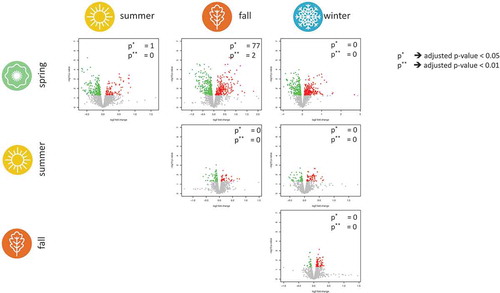
That the seasons overall have a limited influence on miRNAs does not necessarily mean that there is no impact of the season on one or several specific miRNAs. To identify specific miRNAs that are influenced by the season, we performed all six pair-wise comparisons as illustrated in . The only miRNA that showed a significant expression difference in spring compared to summer was miR-140-3p (raw p-value of , adjusted p-value of
). In the comparison spring versus fall,
miRNAs remained significant after adjustment for multiple testing, with miR-181c-5p showing the most significant expression difference (up-regulated in spring, raw p-value of
, adjusted p-value of
). In total,
miRNAs were elevated and
miRNAs were decreased in fall compared to spring. In the four remaining comparisons, no miRNA remained significant following adjustment for multiple testing. As the volcano plot highlights, the largest deviations are observed between spring and the other seasons.
Figure 3. Volcano plots for each of the six pair-wise combinations of the four seasons. For each miRNA, the transformed p-values on the y-axis and the
expression value of the fold change on the x-axis is shown. Nominally significant miRNAs are coloured red for up-regulation and green for down-regulation in a season on the horizontal axis. The two numbers in each of the volcano plots provide the number of significant miRNAs following adjustment for multiple testing using thresholds of
and
. For example, we found two significantly deregulated miRNAs between spring and fall for the latter threshold, namely the miRNAs hsa-miR-181c-5p and hsa-miR-106b-5p.
In addition to these pair-wise analyses, ANOVA was carried out to present a direct comparison of miRNA expression in the four seasons. Following adjustment for multiple testing, miRNAs showed significant expression differences during the course of one year, ie let-7b-5p, miR-21-3p, miR-30e-5p, miR-4455, miR-106b-5p, miR-6509-5p, miR-574-5p, let-7c-5p, miR-6749-5p, miR-5739, miR-140-3p, miR-664b-5p, and miR-29c-3p.
Individual miRNA profiles
The analyses that were presented above rely on unpaired test statistics. However, one advantage of our study is that for individuals, we were able to obtain one sample for each season, enabling us to perform paired statistical analyses. For each miRNA, we investigated the concordance of expression level changes in the course of the four seasons in these individuals. We plotted not only the course for the
individuals but also for those
individuals where single measurements are missing. From the above miRNAs, miR-106b-5p showed a similar expression course in
of the
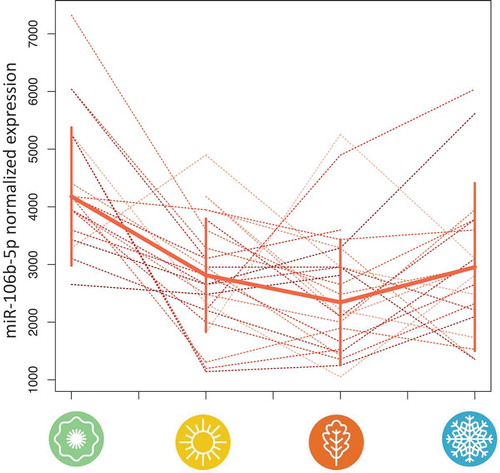
individuals (). The same tendency (U-like shape) was also observed for the individuals for whom one data point was missing. Expression of miR-106b-5p was highest in spring, decreasing over summer to its lowest expression in fall, and starting to increase again over the winter time.
Figure 4. Time course of miR-106b-5p expression in each individual over the course of one year as measured on microarrays. We selected miR-106b-5p as one representative of miRNAs that showed significant deregulation over the course of the year in the ANOVA. In
of
individuals, expression of miR-106b-5p decreased from spring to summer and from summer to fall and increased again in winter. The solid line represents the median and the solid vertical lines the standard deviations at the respective season.
Biological relevance
Given these considerable effects and the number of miRNAs differentially expressed in blood during the four seasons, we also explored potential causes and the cells of origin of these miRNAs. Here, we build on our experience of over miRNA profiles measured with the same technology and further
NGS data sets available via the miRCarta database [Citation33]. Specifically, we made use of our miEAA tool to find biological categories or ontology terms enriched in the data [Citation31]. This tool gets as input either a sorted list or a subset of miRNAs and then searches for significantly enriched categories. Altogether, over
miRNA sets corresponding to KEGG pathways, tissues, cell types, Gene Ontology categories, target genes, and diseases are contained in miEAA. We applied a methodology adapted from gene set enrichment analysis and relied on the full list of
miRNAs sorted with respect to their increasing ANOVA p-value (for more details, see Methods).
The – by several orders of magnitude – most important categories were related to immune cells: CD56 expressed (), CD15 expressed (
), CD19 expressed (
), CD14 expressed (
), and CD3 expressed (
) were found to be enriched in our miRNA list. Further Gene Ontology categories with still highly significant p-values (
) can be summarized as heterogeneous mixture of different cellular compartments (eg mitochondrion), DNA binding, protein binding, immune response, and signalling cascades. Remarkably, all of these categories were rather complex, partially containing several hundred miRNAs. If we focus on more specific and smaller categories, eg of a size below
miRNAs, we also discovered significant enrichment of miRNA-targeted genes. The three most significant genes were VWA9 (p =
), AFF4, and MSANTD2 (both with p-value of
) that are all targeted by let-7b-5p.
Besides analysing the functional enrichment, we also compared the targetomes of the miRNAs with the most significant dys-regulation. To this end, we contrasted the target genes of let-7c-5p and miR-106b-5p using the target prediction tool catchMiR (https://www.ccb.uni-saarland.de/catchmir). As a result, the mitochondrially encoded gene SOD2 was found to be a likely target that is shared between the two microRNAs, affirming our preceding enrichment analysis with respect to cellular compartments. Finally, we had a closer look on the target sites of the two microRNAs, located within the 3ʹ UTR of SOD2 (Ensembl Transcript ID ENST00000538183). For each we could extract binding sites with extensive Watson-Crick complementary and favourable minimum free energies of the predicted miRNA-target duplex using RNAfold (Supplemental Figure 1). These findings not only promote a stable binding of the examined miRNAs on the 3ʹ UTR of SOD2, but suggest a gene regulatory interaction that is supported by experimental evidence from TarBase 8.0 [Citation34] and miRTarBase 7.0 [Citation35].
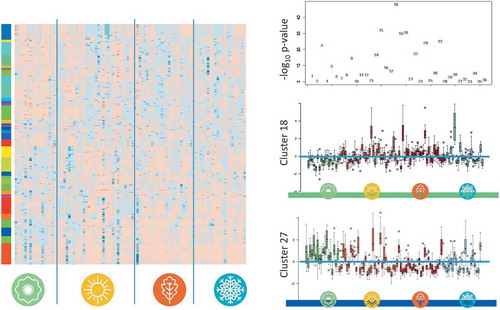
Seasonal clustering of miRNAs
It is well known that miRNAs belonging to the same family often follow similar expression patterns. The patterns are partially even conserved in case of diseases [Citation36]. Therefore we asked, whether miRNAs cluster together according to their seasonal expression patterns. After transforming the expression to z-scores and limiting the influence of low abundant miRNAs (focusing on miRNAs with normalized expression intensity above
), the miRNAs were clustered by hierarchical clustering. The samples (columns) were ordered with respect to the season and have not been clustered. Next, the row dendrogram has been cut at a depth of
of the maximal height of the dendrogram, revealing
clusters. These are presented as colour bars together with the heat map in the left part of . For each cluster, we calculated the p-value with respect to the overall dys-regulation in spring when compared to the other seasons. The negative decadal logarithm for each cluster is presented in the upper right panel of , highlighting highly significantly dys-regulated clusters. The most significant cluster showing a low expression in spring and a higher expression in the other seasons was cluster
with a p-value of
. The cluster contains
miRNAs, including let-7d-5p (details are provided in Supplemental Table 1). The expression values of all miRNAs in this cluster for each individual are shown as bar plot in the middle right panel of . The lower right panel of this Figure presents the same data for cluster 27, with the most significant cluster showing a high expression in spring and lower expression in the remaining seasons (p-value of
). In this cluster,
miRNAs were grouped, including other members of the let-7 family, ie let-7b-5p, let-7c-5p, and let-7i-5p. Interestingly, although being members of the same family, these miRNAs showed a substantially different expression pattern when compared to let-7d-5p in cluster
. Altogether,
clusters showed p-values below
, indicating a strong clustering of the seasonal miRNA profiles, partially independent of the family membership. Of these clusters,
show the pattern of high expression in spring and lower expression in the other seasons, and
show the contrary pattern of low expression in spring and higher expression in the other seasons. A list of miRNAs belonging to all clusters is available in Supplemental Table 1. Furthermore, we wanted to analyse if the same or different functional categories are enriched in the
clusters. To this end, we applied an over-representation analysis (ORA) for each cluster versus the miRNAs on the chip as background set (more details in Methods). To reduce the amount of significant categories and to focus only on the categories that are most commonly enriched, we filtered the results for the categories that were significant in at least four clusters. This yielded a matrix of 56 rows (categories) and 36 columns (clusters), where position
is
if category
is significant for cluster
, and
otherwise. Using this matrix, we performed a hierarchical clustering (Euclidean distance, complete linkage) for the previously defined
clusters (columns). Supplemental Figure 2 shows the resulting heatmap with the column dendrogram. Interestingly, most of the clusters are not significantly enriched for the most common categories, meaning that most of these clusters are study-driven, showing enrichment for very heterogeneous categories. However, there are also some exceptions. The previously defined clusters
,
,
and
are grouped together in the dendrogram and show the largest overlap in significantly enriched categories.
Figure 5. Hierarchical clustering of miRNAs depending on their seasonal expression. The left part of the figure contains a color-coded heat map, where blue stands for high expression and orange for low expression. The profiles for the four seasons are presented without reordering while the miRNAs have been clustered according to matching expression patterns. The panel on the left of the heat map separates all miRNAs in distinct expression-based clusters, each with its own colour. The top panel on the right-hand side presents the negative decadal logarithm for dys-regulation of each expression-based cluster, colour coded in green and red are expression-based clusters with lowest expression and highest expression in spring, respectively. The middle and lower right panels show a box-plot of individual expression of all miRNAs belonging to expression-based cluster 18 and 27, respectively.
RT-qPCR based validation
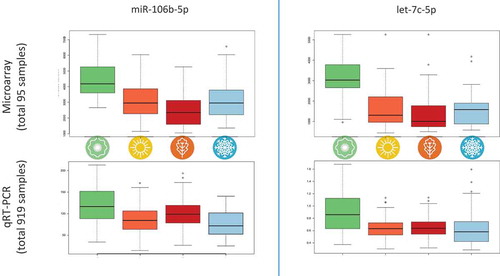
Especially the large effects in spring time call for an in-depth validation. We decided to perform validation of the observed differences in a significantly larger cohort using a second, independent technology. To facilitate this scale up, we used a recently developed protocol that allows sample collection at home and shipment by standard mail. We enrolled individuals at public events such as fares and sent them the Mitra collection device at four time points over the course of one year. At each time point, the individuals had to return their samples within two weeks of obtaining the Mitra device. Altogether, we collected
samples from these individuals (average
of four possible samples per individual). We tested expression of the most significant miR-106b-5p and other candidates from the top most significant miRNAs, including let-7c-5p. The expression profiles of miR-106b-5p and let-7c-5p as measured in the microarray study and in the validation study using Mitra and RT-qPCR are presented in . As this figure demonstrates, the strikingly higher expression of these two miRNAs in spring compared to the other seasons, which we found in the microarray study, could be validated using an independent larger cohort of samples and an RT-qPCR approach. While we observed further concordant patterns for other miRNAs with partially lower p-values (e.g. let-7b-5p, miR-155-5p, miR-181a-5p and others), we also found cases where the primary data were not validated by RT-qPCR. For example, miR-221-3p was highest expressed in spring in the primary study while it showed a slightly higher expression in winter in the validation study. Also, miR-320 was highest in summer in the microarray study while the RT-qPCR validation revealed increased values in spring. For miR-342-3p, highest expression in winter was observed in the study, whereas validation indicated highest expression in summer. However, when we compare the most significant difference between spring and fall, both studies are again concordant. This dys-regulation between spring and fall has been observed in
of the
tested miRNAs. The results of the validation study are summarized in Supplemental Table 2.
Figure 6. Comparison of microarray profiles and RT-qPCR-based validation for miR-106b-5p and let-7c-5p. Both miRNAs were significantly deregulated in the ANOVA over all seasons for microarray and RT-qPCR and clearly show a higher expression in spring than in other seasons in both experimental setups.
Discussion
Pubmed lists almost studies on the potential of miRNAs as biomarkers from different biological sources, including blood, serum, plasma, saliva, urine, and solid tissues. While respective markers or marker patterns are developed, also the general tissue distribution and stability of miRNAs is explored [Citation2,Citation15,Citation37,Citation38]. Also confounding factors for miRNA profiles have been reported, including gender, age, smoking behaviour, body mass index, fitness condition, and others [Citation16,Citation39–Citation42]. However, seasonal differences of miRNA expression profiles may also have an impact on biomarker studies, although conclusive evidence of differential miRNA expression in human blood during the seasons is lacking. In general, there is evidence of seasonal variations in miRNA expression in specific tissues for animals [Citation20–Citation22]. Also, seasonal variations in blood cell composition and mRNA profiles have already been reported [Citation23].
To gain further insights into seasonal variations of miRNA expression in blood, we thus carried out a two-phased study: i) first, a primary evaluation of miRNA expression profiles of 2,549 miRNAs in whole blood samples of individuals collected at four time points in the course of one year using microarrays, and ii) second, an extensive validation study using home-sampled blood of
individuals collected in four rounds during the course of a second year using RT-qPCR. The results of both the exploratory and the validation study highlight substantial differences in blood miRNA expression with highest expression differences in spring compared to the other seasons.
In both studies, we found an upregulation of miR-106b-5p and let-7c-5p in spring. MiR-106b-5p belongs to the miR-106b-25 cluster, a paralogue of the miR-17–92 polycistronic cluster, and is located in an intron of the MCM7 gene. It has been described as oncogenic miRNA overexpressed in several cancers, including hepatocellular carcinoma, breast cancer, renal cell carcinoma [Citation43–Citation45]. Via its direct target genes, deregulation of miR-106b-5p can lead to disturbances in cellular signalling, including cell cycle (E2F1, RB1, WEE1), p53 signalling (PTEN), Wnt signalling (APC, CCND1, CCND2), and apoptosis (CASP7 and CASP8). Interestingly, the non-receptor tyrosine kinase FYN, that is involved in activation of NK cells, has also been shown to be a direct target of miR-106b-5p [Citation46,Citation47]. In blood cells, miR-106b-5p is highly expressed in neutrophils and monocytes [Citation48]. Most interestingly, these cell types have been shown to fluctuate during seasons with high cell counts in spring and summer [Citation23]. As we found high expression of miR-106b-5p in spring, this might reflect the different blood cell composition during spring. Indeed, in silico analysis indicated that the dys-regulated miRNAs are enriched in different immune cells. Target gene analysis of the seasonal miRNAs predicted AFF4 and SOD2 to be potential targets of seasonally expressed miR-106b-5p and let-7b/c-5p. The transcription factor AFF4 has been among the seasonally expressed genes in PBMCs in one of the study cohorts investigated by Dopico et al. with an increased expression in summer [Citation23]. The mitochondrial superoxide dismutase 2 (SOD2) is involved in elimination of byproducts of oxidative phosphorylation, thereby reducing oxidative stress. Interestingly, seasonal variations in vitamin D status due to different day-light lengths have an influence on energy metabolism of PBMCs presumably changing the levels of oxidative phosphorylation in these cells [Citation24]. Moreover, SOD2 is a validated target gene of miR-212-3p, that is known as part of the molecular clock from animal studies [Citation20,Citation21,Citation49]. But the differences in natural light during the seasons may not be the only factor explaining the overall variability. Moreover, other factors can contribute to the seasonal variation, eg people may engage in sports less in winter, having the lowest fitness in spring, doing most sports in summer and having the overall highest fitness in fall. This would explain the largest differences between spring and fall. For a part of the cohort, this may indeed be true but likely does not explain the highly significant variation for basically all individuals.
Although both our exploratory and our validation study were largely consistent, for some miRNAs the exploratory results could not be reproduced, raising the question on the validity of these signatures. These differences could have either technical or biological reasons. On the technical side, we tried to reduce a potential bias that might be introduced by different batches of chemistry or microarrays by processing and measuring the samples all at the same time. Since the blood samples of the exploratory study were collected and stored in PAXGene tubes dedicated for long time storage and preservation of RNA blood profiles, the potential bias attributed to the different blood storage times can be assumed to be minimal. Therefore, the main technical reason for the divergent results of some miRNAs might be the different blood collection or different measurement technology of the exploratory and the validation study. Possible biological reasons include a slight difference in gender proportions of the exploratory and the validation set with 43% and 54% male participants, respectively. Also, the individuals of the primary study have been very well controlled for additional factors such as heart rate, blood pressure, body mass index, and others, which showed no difference between the seasons, while for the individuals of the validation study, these parameters were not recorded due to the home-sampling approach.
Among the main limitations of our study is the lack of data on blood cell counts for the individuals in our exploratory study; so we are not able to confirm the assumption that the different miRNA profiles might be caused by different blood cell compositions during the four seasons. Furthermore, the exploratory phase has been conducted with a relatively low number of individuals (n) measuring a high number of miRNA features (p). This p ≫ n challenge is also related to the so-called curse of dimensionality and makes it hard to select the right biomarkers for the validation. Especially by the adjustment for multiple testing, non-significant miRNAs after adjustment may be actually biologically significant. One example is miR-181c-5p, which is involved in T cell development and activation. This miRNA is among the top of deregulated miRNAs in the ANOVA and significant prior adjustment but slightly misses the
alpha level after adjusting for multiple testing.
Especially in the light of the interesting results towards an enrichment of significant miRNAs in immune cells, a follow-up study is needed where blood cell counts of individuals are measured for each time point of blood collection for miRNA profiling in order to reevaluate the variation of miRNA profiles as consequence of blood cell variations. Also, longer study periods and/or shorter intervals between blood draws might be considered to build a mathematical model of the annual fluctuations of blood miRNAs. Additionally, as age is an important factor contributing to differential miRNA expression in blood, it would be interesting to observe how miRNAs vary over a longer period of time. We thus plan to re-consider the miRNA expression of individuals after a period of four years. Independent of the source of variability, the information that a subset of all miRNAs is differentially regulated between seasons is a confounding factor in long-term miRNA profiles and should be considered in future translational biomarker validation studies.
Supplemental Material
Download Zip (387.3 KB)Acknowledgments
We acknowledge the support of Hummingbird Diagnostics in performing the validation part of our study.
Disclosure statement
No potential conflict of interest was reported by the authors.
Supplementary material
Supplemental data can be accessed from publisher’s website.
Additional information
Funding
Related Research Data
References
- Leidinger P, Brefort T, Backes C, et al. High-throughput qRT-PCR validation of blood microRNAs in non-small cell lung cancer. Oncotarget. 2015;7:4611–4623.
- Kahraman M, Laufer T, Backes C, et al. Technical stability and biological variability in MicroRNAs from dried blood spots: A lung cancer therapy-monitoring showcase. Clin Chem. 2017;63:1476–1488.
- Kahraman M, Röske A, Laufer T, et al. MicroRNA in diagnosis and therapy monitoring of early-stage triple-negative breast cancer. Sci Rep. 2018;8:11584.
- Leidinger P, Hart M, Backes C, et al. Differential blood-based diagnosis between benign prostatic hyperplasia and prostate cancer: miRNA as source for biomarkers independent of PSA level, gleason score, or TNM status. Tumor Biol. 2016;37:10177–10185.
- Nagaraju GP, Arzanani MK, Soleimani M, et al. MicroRNAs as biomarkers and prospective therapeutic targets in colon and pancreatic cancers. Tumor Biol. 2015;37:97–104.
- Vogel B, Keller A, Frese KS, et al. Multivariate miRNA signatures as biomarkers for non-ischaemic systolic heart failure. Eur Heart J. 2013;34:2812–2823.
- Vogel B, Keller A, Frese KS, et al. Refining diagnostic MicroRNA signatures by whole-miRNome kinetic analysis in acute myocardial infarction. Clin Chem. 2012;59:410–418.
- Meder B, Keller A, Vogel B, et al. MicroRNA signatures in total peripheral blood as novel biomarkers for acute myocardial infarction. Basic Res Cardiol. 2010;106:13–23.
- Leggio L, Vivarelli S, L'Episcopo F, et al. microRNAs in parkinson’s disease: from pathogenesis to novel diagnostic and therapeutic approaches. Int J Mol Sci. 2017;18:2698.
- Leidinger P, Backes C, Deutscher S, et al. A blood based 12-miRNA signature of alzheimer disease patients. Genome Biol. 2013;14:R78.
- Keller A, Backes C, Haas J, et al. Validating alzheimer’s disease micro RNAs using next-generation sequencing. Alzheimers Dement. 2016;12:565–576.
- Jin C, Cheng L, Höxtermann S, et al. MicroRNA-155 is a biomarker of t-cell activation and immune dysfunction in HIV-1-infected patients. HIV Med. 2016;18:354–362.
- Latorre I, Leidinger P, Backes C, et al. A novel whole-blood miRNA signature for a rapid diagnosis of pulmonary tuberculosis. Eur Respir J. 2015;45:1173–1176.
- Verma P, Pandey RK, Prajapati P, et al. Circulating MicroRNAs: potential and emerging biomarkers for diagnosis of human infectious diseases. Front Microbiol. 2016;7:1274.
- Backes C, Leidinger P, Altmann G, et al. Influence of next-generation sequencing and storage conditions on miRNA patterns generated from PAXgene blood. Anal Chem. 2015;87:8910–8916.
- Takahashi K, Yokota S-I, Tatsumi N, et al. Cigarette smoking substantially alters plasma microRNA profiles in healthy subjects. Toxicol Appl Pharmacol. 2013;272:154–160.
- Meder B, Backes C, Haas J, et al. Influence of the confounding factors age and sex on MicroRNA profiles from peripheral blood. Clin Chem. 2014;60:1200–1208.
- Rawlings-Goss RA, Campbell MC, Tishkoff SA. Global population-specific variation in miRNA associated with cancer risk and clinical biomarkers. BMC Med Genomics. 2014;7:53.
- Hecksteden A, Castell C, Cos X, et al. miRNAs and sports: tracking training status and potentially confounding diagnoses. J Transl Med. 2016;14:219.
- Larson TA, Lent KL, Bammler TK, et al. Network analysis of microrna and mrna seasonal dynamics in a highly plastic sensorimotor neural circuit. BMC Genomics. 2015;16:905.
- Mendoza-Viveros L, Chiang C-K, Ong JLK, et al. mir-132/212 modulates seasonal adaptation and dendritic morphology of the central circadian clock. Cell Rep. 2017;19:505–520.
- Zhai M, Xie Y, Liang H, et al. Comparative profiling of differentially expressed micrornas in estrous ovaries of kazakh sheep in different seasons. Gene. 2018;664:181–191.
- Dopico XC, Evangelou M, Ferreira RC, et al. Widespread seasonal gene expression reveals annual differences in human immunity and physiology. Nat Commun. 2015;6:7000.
- Calton EK, Keane KN, Raizel R, et al. Winter to summer change in vitamin d status reduces systemic inflammation and bioenergetic activity of human peripheral blood mononuclear cells. Redox Biol. 2017;12:814–820.
- Paynter S, Ware RS, Sly PD, et al. Seasonal immune modulation in humans: observed patterns and potential environmental drivers. J Infect. 2015;70:1–10.
- De Jong S, Neeleman M, Luykx JJ, et al. Seasonal changes in gene expression represent cell-type composition in whole blood. Hum Mol Genet. 2014;23:2721–2728.
- Goldinger A, Shakhbazov K, Henders AK, et al. Seasonal effects on gene expression. PloS one. 2015;10:e0126995.
- Bolstad BM, Irizarry RA, Astrand M, et al. A comparison of normalization methods for high density oligonucleotide array data based on variance and bias. Bioinformatics. 2003;19:185–193.
- R Core Team. R: A Language and Environment for Statistical Computing. Vienna, Austria: R Foundation for Statistical Computing; 2013. ISBN 3-900051-07-0.
- Ploner A Heatplus: heatmaps with row and/or column covariates and colored clusters. (2018).
- Backes C, Khaleeq QT, Meese E, et al. miEAA: microRNA enrichment analysis and annotation. Nucleic Acids Res. 2016;44:W110–W116.
- Hamberg M, Backes C, Fehlmann T, et al. miRTargetLink—miRNAs, genes and interaction networks. Int J Mol Sci. 2016;17:564.
- Backes C, Fehlmann T, Kern F, et al. miRCarta: a central repository for collecting miRNA candidates. Nucleic Acids Res. 2017;46:D160–D167.
- Karagkouni D, Paraskevopoulou MD, Chatzopoulos S, et al. Diana-tarbase v8: a decade-long collection of experimentally supported mirna-gene interactions. Nucleic Acids Res. 2018;46:D239–D245.
- Chou C-H, Shrestha S, Yang C-D, et al. mirtarbase update 2018: a resource for experimentally validated microrna-target interactions. Nucleic Acids Res. 2018;46:D296–D302.
- Staehler CF, Keller A, Leidinger P, et al. Whole miRNome-wide differential co-expression of microRNAs. Genomics Proteomics Bioinformatics. 2012;10:285–294.
- Glinge C, Clauss S, Boddum K, et al. Stability of circulating blood-based micrornas - pre-analytic methodological considerations. PloS one. 2017;12:e0167969.
- Ludwig N, Leidinger P, Becker K, et al. Distribution of miRNA expression across human tissues. Nucleic Acids Res. 2016;44:3865–3877.
- Lizarraga D, Page CM, Lepistö M, et al. mirnas differentially expressed by next-generation sequencing in cord blood buffy coat samples of boys and girls. Epigenomics. 2016;8:1619–1635.
- Ameling S, Diallo A, Cruceanu C, et al. Associations of circulating plasma micrornas with age, body mass index and sex in a population-based study. BMC Med Genomics. 2015;8:61.
- Su M-W, Yu S-L, Lin W-C, et al. Smoking-related micrornas and mrnas in human peripheral blood mononuclear cells. Toxicol Appl Pharmacol. 2016;305:169–175.
- Sapp RM, Shill DD, Roth SM, et al. Circulating micrornas in acute and chronic exercise: more than mere biomarkers. J Appl Physiol 122, 702–717, (2017).
- Yen C-S, Su Z-R, Lee Y-P, et al. mir-106b promotes cancer progression in hepatitis b virus-associated hepatocellular carcinoma. World J Gastroenterol. 2016;22:5183–5192.
- Zheng R, Pan L, Gao J, et al. Prognostic value of mir-106b expression in breast cancer patients. J Surg Res. 2015;195:158–165.
- Lu J, Wei JH, Feng ZH, et al. mir-106b-5p promotes renal cell carcinoma aggressiveness and stem-cell-like phenotype by activating wnt/β-catenin signalling. Oncotarget. 2017;8:21461–21471.
- Gerbec ZJ, Thakar MS, Malarkannan S. The fyn-adap axis: cytotoxicity versus cytokine production in killer cells. Front Immunol. 2015;6:472.
- Liu W, Zhao J, Lu G. mir-106b inhibits tau phosphorylation at tyr18 by targeting fyn in a model of alzheimer’s disease. Biochem Biophys Res Commun. 2016;478:852–857.
- Pritchard CC, Kroh E, Wood B, et al. Blood cell origin of circulating micrornas: a cautionary note for cancer biomarker studies. Cancer Prev Res (Phila). 2012;5:492–497.
- Meng X, Wu J, Pan C, et al. Genetic and epigenetic down-regulation of microrna-212 promotes colorectal tumor metastasis via dysregulation of mnsod. Gastroenterology. 2013;145:426–36.e1–6.