
 ?Mathematical formulae have been encoded as MathML and are displayed in this HTML version using MathJax in order to improve their display. Uncheck the box to turn MathJax off. This feature requires Javascript. Click on a formula to zoom.
ABSTRACT
Interactions between macromolecules play a crucial role in ribosome assembly that follows a highly coordinated process involving RNA folding and binding of ribosomal proteins (r-proteins). Although extensive studies have been carried out to understand macromolecular interactions in ribosomes, most of them are confined to either large or small ribosomal-subunit of few species. A comparative analysis of macromolecular interactions across different domains is still missing. We have analyzed the structural and physicochemical properties of protein-protein (PP), protein-RNA (PR) and RNA-RNA (RR) interfaces in small and large subunits of ribosomes, as well as in between the two subunits. Additionally, we have also developed Random Forest (RF) classifier to catalog the r-proteins. We find significant differences as well as similarities in macromolecular recognition sites between ribosomal assemblies of prokaryotes and eukaryotes. PR interfaces are substantially larger and have more ionic interactions than PP and RR interfaces in both prokaryotes and eukaryotes. PP, PR and RR interfaces in eukaryotes are well packed compared to those in prokaryotes. However, the packing density between the large and the small subunit interfaces in the entire assembly is strikingly low in both prokaryotes and eukaryotes, indicating the periodic association and dissociation of the two subunits during the translation. The structural and physicochemical properties of PR interfaces are used to predict the r-proteins in the assembly pathway into early, intermediate and late binders using RF classifier with an accuracy of 80%. The results provide new insights into the classification of r-proteins in the assembly pathway.
Introduction
Ribosomes are the ribonucleoprotein complexes, which are used as translational machinery for protein synthesis by the cells. Ribosomes across the different domains of life consist of two parts: a small subunit that binds mRNA, and a large subunit that binds to the transfer RNA (tRNA) and catalyzes peptide bond formation [Citation1]. In eukaryotes, the small (40S) and the large (60S) subunits are stabilized through a network of interactions to form the entire assembly (80S). Similarly, the entire assembly (70S) in prokaryotes is stabilized by the intersubunit interactions between the small (30S) and the large subunits (50S). A network of macromolecular interactions including protein-protein (PP), protein-RNA (PR) and RNA-RNA (RR) provides the required stability of the individual subunit as well as the entire assembly. It has been found that more than 80% of the intersubunit contacts are contributed by RR bridges [Citation2]. Each of the small and the large subunit comprises of two-third RNAs and one-third ribosomal proteins (r-proteins), except in some mammalian mitochondria where the ratio is reversed [Citation3,Citation4]. The core of ribosomal RNA (rRNA) and r-proteins, including the active sites, is conserved in both prokaryotes and eukaryotes [Citation5,Citation6]. Most of the r-proteins are located at the surface of the ribosome, while the central core is mainly composed of rRNA [Citation7]. The universally conserved r-proteins have positively charged tails penetrating into rRNA that may neutralize the negative phosphate charges on RNA and stabilize the complex [Citation8]. These extended tails of r-proteins help to anchor each protein to the RNA core, thus increasing the total interacting surface area with the rRNA and stabilizing the RNA tertiary fold [Citation9,Citation10]. Various atomic resolution structures also have identified conserved hydrophobic residues in r-proteins that are potential candidates for either PP or PR interactions [Citation11,Citation12]. Interactions between these macromolecules play crucial roles in ribosomal assemblies and its conformational stability. Thus, the PP, PR and RR interactions have active roles in the biogenesis and functional dynamics of ribosomes.
Since the discovery of ribosome, the studies are mainly focussing on deciphering the mode of association of rRNAs and r-proteins to form a functional assembly, processing of pre-RNAs and functional characterization of assembly factors [Citation7,Citation13–Citation15]. The last decade of research mainly focussed on deciphering the roles of r-proteins in the assembly, which is a highly coordinated process involving RNA folding, ion binding, binding of r-proteins and processing events that occur co-transcriptionally [Citation16–Citation22]. The pioneering work of reconstitution of r-proteins by the groups of Nomura and Nierhaus suggested that the assembly proceeds in steps with several proteins binding directly to the rRNA, while others require the pre-binding of other r-proteins [Citation23–Citation26]. In addition, methodical approaches of assembly map have elucidated that r-proteins assemble in a bipartite manner [Citation21,Citation27] that can be segregated into three to four broad classes based on their binding to rRNA at different stages. The early binding proteins tend to associate with the rRNA and organize binding sites for subsequent binding of the intermediate binders followed by the late binders. Interestingly, the assembly order of yeast ribosome in vivo seems to parallel the assembly order of their bacterial counterparts in vitro [Citation28–Citation31], indicating that the assembly is highly dependent on the RNA-protein interactions. A recent detailed review on the mapping of r-proteins in the eukaryotic ribosomal assembly has established the cytoplasmic positioning and timing of r-proteins as early, medium and late nucleolar [Citation32]. Recent nomenclature of r-proteins reduces the confusion caused by the identical names of r-proteins assigned in different species [Citation33].
Although extensive research has been done to understand the macromolecular interactions in ribosomes, yet most of them are confined to PP and PR interactions in either large or small subunits of few species [Citation34–Citation36]. A detailed evaluation of each macromolecular interaction vis-a-vis the interaction network in the entire ribosomal assemblies including all the three types of interactions in a wide range of species is yet to be explored. In this study, we have analyzed the structural and physicochemical properties of PP, PR and RR interfaces in small and large subunits of ribosome, as well as in between the two subunits across the three different domains of life. The dataset of ribosomal assemblies from various domains of life is curated from the Protein Data Bank (PDB) [Citation37]. We have identified all the possible pairwise PP, PR and RR interfaces. Moreover, we compare the structural and the physicochemical properties of these interfaces with the binary protein-protein and protein-RNA assemblies [Citation38] to understand the assembly mechanisms of the different kinds of cellular machines. Finally, we have used Random Forest (RF) [Citation39] classifier to catalog the r-proteins in the ribosomal assemblies that support the hypothesis that large PR interfaces form first and promote the assembly to a higher order. The classifier developed in this study correctly predicts 80% of the r-proteins in the assembly pathway. This study should help to gain molecular insights into the dynamics of macromolecular interaction networks in ribosomal assemblies.
Results
Subunits of ribosomal assemblies
The dataset contains seven ribosomal assemblies from seven different source organisms (). Thermus thermophilus and Escherichia coli have the structures of the entire assembly including the small and the large subunits. However, only the large subunit structure of Haloarcula marismortui, Deinococcus radiodurans, and Staphylococcus aureus are available in the PDB. On the other hand, Saccharomyces cerevisiae is the only representative for eukaryotes having the complete assembly. The dataset contains another eukaryote, Tetrahymena thermophila, with the structures of only individual subunit assembly. In T. thermophilus, the small subunit contains 20 r-proteins and four RNAs, while the large subunit contains 29 r-proteins and two RNAs. In addition to rRNA, the small subunit has mRNA, A-site, P-site and E-site tRNAs. In E. coli, the small subunit contains 20 r-proteins and one RNA, while the large subunit contains 31 r-proteins and two RNAs. The large subunits of H. marismortui, D. radiodurans, and S. aureus contain two RNAs but 29, 28 and 26 r-proteins, respectively. The small subunit of S. cerevisiae contains 34 r-proteins and one RNA, while the large subunit contains 42 r-proteins and three RNAs. The small subunit of T. thermophila contains 34 r-proteins and one RNA, while the large subunit contains 44 r-proteins and three RNAs.
Table 1. Interfaces in ribosomal assemblies.
Size of the pairwise interfaces
The pairwise PP, PR and RR interfaces in small and large subunits as well as in between the two subunits are shown in . We have identified 427 PP, 434 PR, and 24 RR interfaces. On average, the 50S subunit of prokaryotes contains 21 PP, 34 PR, and one RR interfaces, while the 30S subunit contains 19 PP, 24 PR, and four RR interfaces. Interactions between 30S and 50S subunits are stabilized by three PP, nine PR, and two RR interfaces. On the other hand, the 60S subunit of eukaryotes contains an average of 75 PP, 58 PR, and two RR interfaces, while the 40S subunit contains 58 PP and 34 PR interfaces. Interactions between 40S and 60S subunits are stabilized by four PP, nine PR, and two RR interfaces. The size of the pairwise interfaces (B) is calculated by quantifying the amount of solvent accessible surface area (SASA) buried in contact (refer to materials and methods section). The average size of PP interfaces is 769 Å2 in the entire dataset (). The largest PP interface is found between eL40 and uL29 in 60S subunit of T. thermophila (PDB id: 4V8P, B = 3295 Å2), while the smallest is found between eL30 and uS15 in the 80S assembly of S. cerevisiae (PDB id: 4V88, B = 12 Å2). We find the average size of PR interfaces is 3936 Å2 in the entire dataset. Here, the largest is observed between 26S rRNA and uL3 in 60S subunit of T. thermophila (PDB id: 4V8P, B = 17,765 Å2), and the smallest is observed between mRNA and uS7 in 70S of T. thermophilus (PDB id: 4W2F, B = 24 Å2). The average size of RR interfaces is 2361 Å2 in the entire dataset. Here, the largest is observed between 26S rRNA and 5.8S rRNA in 60S subunit of T. thermophila (PDB id: 4V8P, B = 11,412 Å2), while the smallest is observed between mRNA and P/E site tRNA in 70S of T. thermophilus (PDB id: 4W2F, B = 163 Å2).
Table 2. Comparison with binary complexes.
Among the different subunits in prokaryotes, the largest PP interface is observed between the large subunit r-proteins (B = 655 Å2), while the smallest is observed between the r-proteins of the large and the small subunits (B = 415 Å2) (supplementary table S1). On the other hand, in eukaryotes, the largest PP interface is observed between the small subunit r-proteins (B = 880 Å2), while the smallest is observed between the r-proteins of the large and the small subunits (B = 481 Å2). Both in prokaryotes and eukaryotes, the largest PR interface is found between the r-proteins of the large subunit (B = 4084 Å2 for prokaryotes, B = 4909 Å2 for eukaryotes) and the smallest is found between the r-proteins of the large and the small subunits (B = 396 Å2 for prokaryotes, B = 905 Å2 for eukaryotes). In the case of RR interfaces in prokaryotes, the largest is found between the r-proteins of the large and the small subunits (B = 2840 Å2), while the smallest is found between the r-proteins of the small subunit (B = 612 Å2). The interface area B and the number of interface atoms are linearly correlated in all the three PP, PR and RR interfaces with Pearson correlation coefficient (R2) of 0.99, 0.98 and 0.99, respectively (supplementary Figure S1). Similarly, B is linearly correlated with the number of residues and nucleotides in all the three PP, PR and RR interfaces with R2 of 0.97, 0.97 and 0.96, respectively. Thus, the two are equivalent as a measure of interface size. PP interfaces contain one atom per 9.2 Å2 of B, PR interfaces contain one protein atom per 9.6 Å2 of B and one RNA atom per 8.1 Å2 of B and RR interfaces contain one RNA atom per 7.6 Å2 of B.
Non-polar composition and the quality of the atomic packing
The contribution of non-polar chemical groups (carbon-containing) to B is considered as the fraction of non-polar area (fnp). On average, fnp is 59% in PP interfaces compared to only 36% in RR interfaces (). A significant difference in fnp is also observed in PR interfaces (p-value < 0.05, t-test), where the contribution of the non-polar groups at the protein side is 48% and at the RNA side is only 36%. Among the different subunit PP interfaces, the average fnp is higher between the r-proteins of the large and the small subunits of prokaryotes (supplementary table S1). However, in eukaryotes, the fnp is higher between the large subunit r-proteins and lower between the large and the small subunit r-proteins (p-value < 0.05, t-test). In PR interfaces, at the protein side, the average fnp is higher between the large subunits and lower between the large and the small subunits of prokaryotes, whereas, in eukaryotes, the fnp is higher between the large and the small subunits than in between the individual subunit (p-value < 0.05, t-test). However, at the RNA side of PR interfaces, the fnp is higher between the small subunits and lower between the large and the small subunits both in prokaryotes as well as in eukaryotes (p-value < 0.05, t-test).
At the interface, an atom may be fully buried (SASA is zero upon complexation) or it may remain partially accessible to the solvent molecules. The fraction of buried atoms (fbu) was calculated considering the interface atoms that are fully buried. While average fbu is the highest in RR interfaces (25%), it is the lowest in PP interfaces (15%) (). Average fbu at the RNA side is higher than that of the protein side in PR interfaces. Among the different subunits, average fbu is higher in the large subunit interfaces and significantly lower (p-value < 0.05, t-test) between the large and the small subunit interfaces in both prokaryotes and eukaryotes (supplementary table S1). While the fbu measures the overall compactness of the atomic packing at the interfaces, local density index (LD) measures the atomic packing density at each point of the interface [Citation40,Citation41]. In brief, LD is the mean number of interface atoms that are within 12 Å of a given interface atom. Average LD value is the highest in RR interfaces (LD = 55) followed by the PP (LD = 43) and PR interfaces (LD≈38) (). In prokaryotes, the average LD values are higher in the large subunit interfaces compared to the small subunit PR and RR interfaces, whereas the opposite trend is observed in eukaryotes (supplementary table S1). In general, the average LD values at all the three types of interfaces are higher in eukaryotes compared to prokaryotes (p-value < 0.05, t-test). Moreover, the average LD between the large and the small subunit interfaces is significantly lower (p-value <0.05, t-test) than those found either in the small or in the large subunit interfaces.
Amino acid and chemical composition
) shows the relative abundance of amino acid residues and (or) nucleotides at all the three types of interfaces (). Among the positively charged residues, Arg is preferred both at PP and PR interfaces, while Lys is preferred only at PR interfaces and depleted from PP interfaces. Both the negatively charged residues, Asp and Glu are depleted from both PP and PR interfaces. Among the neutral polar residues, Ser, Asn and His are preferred at PR interfaces but depleted from PP interfaces, while, both Thr and Gln are depleted from PP and PR interfaces. Among the two sulphur containing residues, Met is preferred both at PP and PR interfaces, while, Cys is preferred only at PP interfaces and depleted from PR interfaces. All the aromatic residues are preferred both at PP and PR interfaces. Except for Ala and Gly, which are depleted from both PP and PR interfaces, all the other hydrophobic residues are preferred at PP interfaces and depleted from PR interfaces. ) shows the propensity of nucleotides at PR and RR interfaces. While adenine is preferred at both PR and RR interfaces, uracil and guanine are depleted from both of these interfaces. Cytosine shows different behavior, preferred at PR interfaces and depleted from RR interfaces.
Table 3. Amino acid and Nucleotide composition.
Figure 1. Area-based propensities of (a) aminoacid residues and (b) nucleotides at PP, PR and RR interfaces in ribosomal assemblies.
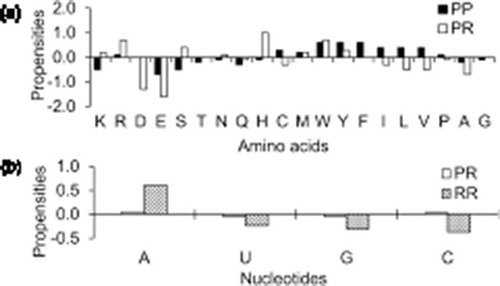
The chemical composition of the solvent accessible surfaces and the pairwise interfaces is expressed as the contribution of different atom types to SASA or to B. Compared to main chain, side chains of amino acid residues contribute significantly more to B as well as to SASA in both PP and PR interfaces (). In PP interfaces, non-polar groups contribute more to B than to SASA, whereas this contribution is just the opposite in PR interfaces. In both PP and PR interfaces, neutral polar groups contribute almost equally to B or to SASA. In both PP and PR interfaces, positively charged groups contribute significantly more to B than to SASA, whereas, negatively charged groups contribute significantly more to SASA than to B. In PR interfaces, bases are the most abundant (48%) followed by phosphate (34%) and sugar (18%). On the other hand, bases contribute two third to B, while sugar and phosphate contribute only 22% and 14%, respectively in RR interfaces. This trend is different in SASA, where phosphate and bases are almost equally abundant, and sugar plays an insignificant role. At PR interfaces, the neutral polar groups of RNA contribute 51%, the non-polar groups 36% and the negatively charged groups contribute only 13% to overall B ().
Table 4. Chemical composition of the interfaces.
H-bonds, salt bridges and stacking interactions
Specific polar interactions are represented by the intermolecular hydrogen bonds (H-bonds) between PP, PR and RR interfaces, and are identified using the program HBPLUS [Citation42]. On average, we find 29 H-bonds at RR interfaces (one per 82 Å2 of B) and 27 H-bonds at PR interfaces (one per 146 Å2 of B) (). The average H-bonds at PP interfaces is significantly lower (one per 357 Å2 of B) compared to the other two types of interfaces. The number of H-bonds increases linearly with the B of the RR interfaces (R2= 0.98). However, the correlation is mediocre in PR (R2= 0.56) and PP interfaces (R2= 0.47). Compared to main chain nitrogen, main chain oxygen contributes significantly more to the H-bonds at PP interfaces (). However, main chain nitrogen contributes slightly more to the H-bonds compared to main chain oxygen in PR interfaces. Among the charged side chains, positively charged groups contribute more to the H-bonds at PR interfaces, while the negatively charged groups contribute more to the H-bonds at PP interfaces. Among the neutral polar side chains, a significant difference is observed for the nitrogen, which is frequently found in the H-bonds at PR than at PP interfaces. On the RNA side, phosphate contributes significantly more to the H-bonds at PR (48%) than at RR interfaces (8%). The opposite trend is observed for both sugar and bases, which are preferred to contribute more in RR H-bonds than in PR H-bonds. Among the bases, purines contribute more to H-bonds than the pyrimidines in both PR and RR interfaces.
Table 5. Hydrogen bond composition.
Salt bridges across PR interfaces were calculated when the distance between the side-chain nitrogen atoms of the positively charged residues and the negatively charged phosphate group of the nucleotides is within 4 Å [Citation43,Citation44]. In PP interfaces, the same cut-off distance was used to define the salt bridges between the side chains of positively charged and negatively charged residues. On average, we find 14 salt bridges at PR interfaces and only one at PP interfaces. Accordingly, the density of salt bridges is significantly higher in PR interfaces (one per 289 Å2 of B) than PP interfaces (one per 812 Å2 of B) (). Additionally, we find the density of salt bridges is significantly higher in PR interfaces of eukaryotes than those in prokaryotes.
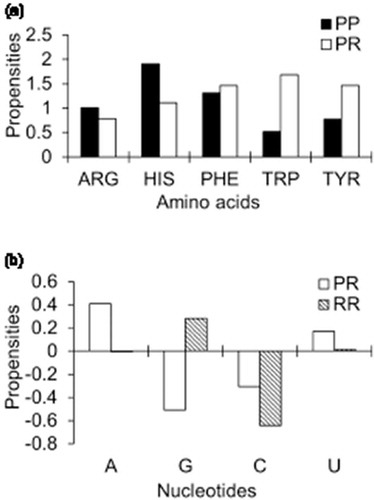
Stacking interactions at PP, PR and RR interfaces were calculated following Barik et al [Citation38]. In brief, the planes were defined at both sides of the interfaces by considering the atoms constituting the aromatic rings, and the center of the plane was calculated as the mid-point of all these atoms. The dihedral angle between the two planes was constrained to ≤ 30° and the cut-off distance between the centers of two planes was kept ≤ 5Å[Citation45]. Stacking interactions occur mostly due to the aromatic side chains of Phe, Trp, Tyr and His. Apart from the aromatic residues, the guanidium moiety of Arg also plays an important role in cation-π stacking. ) shows the propensities of amino acid residues involved in stacking interactions at PP and PR interfaces. Arg and His have higher propensity values at PP interfaces than at PR interfaces, while, the aromatic amino acid residues show the opposite trend. At the nucleotide side, adenine and uracil show positive propensities at PR interfaces, while guanine and cytosine show negative propensities ()). At RR interfaces, guanine shows positive propensity and cytosine shows negative propensity to involve in stacking interactions.
Figure 2. Propensities of stacking interactions: (a) residues at PP and PR interfaces and (b) nucleotides at PR and RR interfaces.
Shape complementarity and secondary structures
The shape correlation index (Sc) [Citation46] was used to quantify the shape complementarity at PP, PR and RR interfaces. The Sc index was calculated using the GPU-SC program with the radii of interface atoms taken from NACCESS [Citation47]. The average Sc index is 0.56 at PP interfaces, 0.58 at PR interfaces and significantly higher, 0.67 at RR interfaces (p-value < 0.05, t-test) (). Among the different subunits, the large subunit PP interfaces have higher Sc values than that of the small subunit interfaces in prokaryotes (supplementary table S1). However, they have similar averages in eukaryotes. Sc values of PR interfaces are similar among the different subunits both in prokaryotes and eukaryotes. Among all the subunits of prokaryotes and eukaryotes, RR interfaces have the highest Sc values than PP and PR interfaces.
The program DSSP [Citation48] was used for the secondary structure assignment. The average number and the density of residues found in different secondary structural elements at PP and PR interfaces are shown in . Here, the group ‘helices’ includes alpha helix, 310-helix, and π-helix; the group ‘strands’ includes isolated beta-strand, extended strand or beta ladder; and the group ‘others’ includes non-regular secondary structural elements. At PP interfaces, density of residues is the highest in helices followed by in others and strands. While at PR interfaces, the density is similar in helices and others, but the lowest in strands.
Macromolecular interaction networks in ribosomal assemblies
Frequency of pairwise interactions of each molecule in the large and the small subunits of both prokaryotes and eukaryotes are shown in . In prokaryotes, the number of interacting partners for a given small subunit r-protein varies from one to five with an average of three. The highest number of interacting partners is observed for uS9, uS3, uS5, uS8, and uS14, while the lowest is observed for bS16 and bS20. For the large subunit r-proteins, the number of partners varies from one to five with an average of three. Here, the highest number of partners is observed for bL20, while the lowest is observed for uL1, uL2, uL6, and uL11. Similarly, the number of interacting partners of RNA varies from five to 29 with an average of 15. The highest number of partners is observed for 23S rRNA and the lowest is observed for tRNA.
Figure 3. Frequency distributions of a number of interacting partners of large and small subunits r-proteins as well as RNAs, both in prokaryotes and eukaryotes.
In eukaryotes, the number of interacting partners for a given small subunit r-protein varies from three to 13 with an average of six. The highest number of partners is observed for uS3 and the lowest is observed for uS19, eS19, and eS25. Similarly, the number of partners varies from four to 16 in the large subunit r-proteins with an average of nine. Here, the highest number of partners is observed for uL4 and the lowest is observed for eL19, eL22 and eL31. For the RNA subunit, the number of interacting partners varies from eight to 49 with an average of 33. Here, the highest number of partners is observed for 25S rRNA and the lowest is observed for 5S rRNA. The large subunit r-protein eL22 has four interacting partners in both prokaryotes and eukaryotes. Similarly, the small subunit r-proteins eS8, uS15, uS11, uS19, and eS19 have equivalent number of interacting partners in both prokaryotes and eukaryotes. The interaction networks of ribosomal assemblies of prokaryotes and eukaryotes are shown in . Based on the size of the interfaces, edges are divided into (i) solid lines (B > 4000Å2), (ii) broken lines (2000 Å2< B > 4000 Å2) and (iii) grey lines (B < 2000 Å2). While the solid lines represent the strong interactions between the two molecules in the assembly, the grey lines infer weak interactions.
Figure 4. The macromolecular interaction networks of (a) 70S and (b) 80S ribosomal assemblies. Protein and RNA molecules are represented by the node of the graph and their interactions by the edges. The edges of the network are divided based on the interface area B into (i) solid (B > 4000 Å2), (ii) broken (2000 Å2 < B > 4000 Å2) and (iii) grey (B < 2000 Å2).
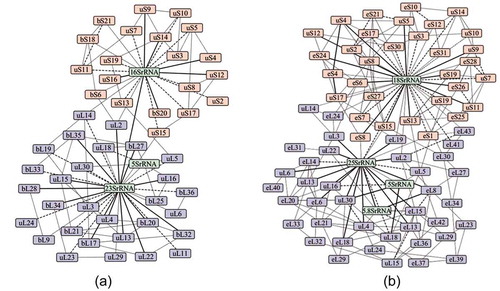
Proteins and RNAs in the small and the large subunits of the ribosome are involved in inter-subunit interactions in the completely assembled unit (70S or 80S). In prokaryotes, the assembly between the large and the small subunits is mainly stabilized by the four PP interfaces (supplementary table S2). On the other hand, in eukaryotes, the interaction between the large and the small subunits is mainly stabilized by six PP interfaces. PR interfaces also play significant roles in stabilizing the interactions between the small and the large subunits. In prokaryotes, interactions between five PR interfaces play major roles in the stability of the inter-subunit assembly. Of these five interfaces, three are involving 16S rRNA and two are involving 23S rRNA. Similarly, eight PR interfaces play significant roles in inter-subunit stability in eukaryotes. Of these eight interfaces, six are involving 18S rRNA and the remaining two are involving 25S rRNA. Additionally, we find few significant interactions between translational factors and r-proteins/RNAs. In prokaryotes, these interactions are: uL6: EFG (elongation factor G; B = 541 Å2), uL11: EFG (B = 332 Å2) and 23S rRNA: EFG (B = 2247 Å2). EFG along with ribosome recycling factor (RRF) triggers the splitting of post-termination of ribosomal complexes into individual subunit [Citation49]. Similarly, in eukaryotes, we find uL5:STM1 (B = 1014 Å2), eL42:STM1 (B = 36 Å2), 25S rRNA:STM1 (B = 1857 Å2) and 5S rRNA:STM1 (B = 162 Å2) interactions, where STM1 is a non-ribosomal protein that regulates translational repression and mRNA decay [Citation50].
Assembly pathway and classification of ribosomal proteins
The structural and physicochemical features differ significantly among the three classes of r-proteins. shows the boxplots of the features of pairwise interfaces for three classes of r-proteins. The p-values were calculated using the t-test, one tailed using unequal variances. Among all the attributes, the early binders have significantly large interface area than that of the intermediate (p-value < 0.05, t-test) and the late binders (p-value < 0.05, t-test). Similarly, the average interface size of the intermediate binders is larger than that of the late binders (p-value < 0.05, t-test). The number of atoms and the number of nucleotides/residues at the interfaces follow the similar trend (p-value < 0.05, t-test) as the size of the interfaces. The early binders have high hydrophobicity, large packing density, and more polar than the intermediate (p-value < 0.05, t-test) and the late binders (p-value < 0.05, t-test). The intermediate binders are more hydrophobic, well packed and more polar than the late binders (p-value < 0.05, t-test). Average salt bridge density is the highest in the early binders compared to the intermediate (p-value < 0.05, t-test) and the late binders (p-value < 0.05, t-test). The intermediate binders have higher salt bridge density than the late binders (p-value < 0.05, t-test). The performance of the algorithm has been quantified by the confusion matrix (). We have obtained an overall accuracy of 80% for correctly classifying the r-proteins in the assembly pathway. The classifier provides better results for the early and the late binders than the intermediate binders. The sensitivity/recall provides the best measure as it is the ratio between the true positives and all the positive data values. The average precision, recall, and the f1 score are 85%, 79%, and 73%, respectively. shows the predicted classes of r-proteins. In case of small subunit r-proteins, uS5 is misclassified, and in large subunit r-proteins, eL15, eL29, eL32, and uL2 are misclassified.
Table 6. Classification of r-proteins.
Figure 5. The box plot showing the distributions of different features of pairwise interfaces for three classes of r-proteins: (a) interface area B and (b) structural and physicochemical features in (i) early (ii) intermediate and (iii) late binders. The box plot (whisker diagram) is a standardized way of displaying the distribution of data based on the five-number summary: minimum, first quartile, median, third quartile, and maximum. In the simplest box plot the central rectangle spans the first quartile to the third quartile (the interquartile range or IQR). A segment inside the rectangle shows the median and ‘whiskers’ above and below the box show the locations of the minimum and maximum.
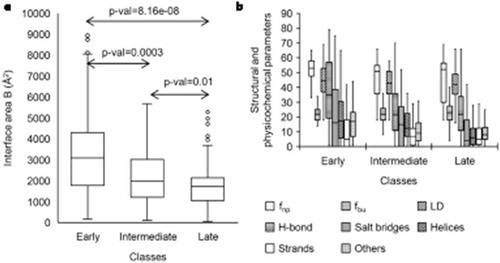
Figure 6. Confusion matrix predicting the classification of r-proteins as (i) early (ii) intermediate and (iii) late binders using RF. Scale represents the percentage of instances.
Discussion
Comparison with the binary assemblies
The current study analyzes the structural and physicochemical properties of macromolecular interactions in ribosome to understand its self-assembly. We have dissected PP, PR and RR interfaces in ribosomal assemblies, and compared those with the respective binary protein-protein and protein-RNA interfaces available in the literature [Citation38,Citation41,Citation45,Citation51–Citation54]. Finally, we used a classifier to categorize the r-proteins in the assembly pathway.
We find an average PP interface in the small subunit is smaller than that of the large subunit in prokaryotes (supplementary table S1). In eukaryotes, the opposite trend is observed, where an average PP interface in the small subunit is larger than that of the large subunit. Both in prokaryotes and eukaryotes, PP interfaces between the small and the large subunits are the smallest in size. We find the average size of binary protein-protein interfaces [Citation38] is larger than PP interfaces in ribosomal assemblies.
Among the three different types of interfaces, the average size of PR interfaces is the highest followed by RR and PP interfaces (supplementary Figure S2). The result is consistent with the binary complexes, where the average size of a protein-RNA interface is larger than the average protein-protein interface. However, the average size of binary protein-RNA interfaces [Citation38] is smaller than the average PR interfaces. Both in prokaryotes and eukaryotes, PR interfaces are generally larger in the large subunit than those in the small subunit. The average size of a PR interface between the large and the small subunits is larger than the average size of a PP interface in eukaryotes. We find the size of PR interfaces varies widely both in the small and the large subunit assemblies. For example, interfaces involving the small subunit r-proteins eS6, eS8, eS4, uS4, eS12, uS12, uS15, uS9, and eS17 have large sizes where B varies from 6000 Å2 to 9825 Å2. Similarly, the large subunit r-proteins including uL3, uL4, uL2, eL15, eL27, uL3, eL19, uL15, eL34, eL13, and bL20 are also involved in large size PR interfaces where B varies from 8000 Å2 to 17,765 Å2. Moreover, we find the r-proteins of the large subunit (50S/60S) PR interfaces bury the highest percentage of their SASA compared to the small subunit r-proteins (30S/40S).
We find an average PR interface contains one residue per 45 Å2 of B and one nucleotide per 41 Å2 of B. Whereas, an average protein-RNA binary interface contains one residue per 27 Å2 of B and one nucleotide per 83 Å2 of B [Citation38]. An average PP interface contains one residue per 34 Å2 of B, which is strikingly similar to that observed in binary protein-protein interfaces [Citation38]. On average, RR interfaces contain one nucleotide per 41 Å2 of B, which is almost similar to their contribution in PR interfaces.
Among all the three types of interfaces, fnp is the highest in PP interfaces (supplementary Figure S2), showing that the hydrophobic interactions are dominant here than in PR or RR interfaces. A similar trend is observed in binary protein-protein and protein-RNA interfaces [Citation38,Citation40,Citation41,Citation55]. Compared to PP interfaces in ribosomes, binary protein-protein interfaces contain many more buried atoms. A similar trend is also observed between PR interfaces in ribosomes and the binary protein-RNA interfaces. Compared to all the three types of interfaces, atomic packing is the highest in RR interfaces (supplementary Figure S2). Among the different subunits, the packing density is significantly poor at the interfaces between the large and the small subunits of ribosome both in prokaryotes and eukaryotes. The lower degree of atomic packing may be attributed to the periodic dissociation and association of the large and the small subunits during the translation [Citation56,Citation57], that may provide the required flexibility in the geometry of ribosome assembly to adjust the peripheral restraint [Citation58–Citation60].
The amino acid compositions show that PR interfaces are enriched with positively charged and neutral polar residues and depleted from negatively charged and hydrophobic residues. This is a well-established fact that the negatively charged RNA backbone is stabilized by the positively charged side chains of amino acid residues [Citation35]. Similar compositions are also observed in binary protein-RNA interfaces [Citation38]. On the other hand, PP interfaces are enriched with hydrophobic and aromatic residues and depleted from polar and charged residues with only one exception of Arg. The abundance of Arg at protein-protein interfaces is well established [Citation40,Citation61,Citation62]. A similar composition is observed in binary protein-protein interfaces with two exceptions; His is preferred and Pro is depleted as compared to PP interfaces in ribosomes. The nucleotide composition shows that adenine and cytosine are preferred in PR interfaces in ribosomal assemblies. However, in binary protein-RNA interfaces, uracil and adenine are preferred [Citation38]. Moreover, both in PP and PR interfaces, the protein side chains contribute more to B than the main chain. A similar trend is also observed in binary interfaces. Additionally, nonpolar groups contribute more to B in PP interfaces, which is similar to the observation found in binary protein-protein interfaces [Citation38]. A summary of significant differences as well as similarities in macromolecular recognition sites between ribosomal assemblies of prokaryotes and eukaryotes is provided in supplementary table S3.
Specific interactions stabilizing the macromolecular interfaces
We find the H-bond density is the highest in RR interfaces followed by PR and PP interfaces (supplementary Figure S2). Compared to binary protein-protein interfaces, H-bond density is lower in PP interfaces. A similar trend is observed between binary protein-RNA and PR interfaces. The contribution of the main chain polar groups in H-bonds is significantly higher in PP interfaces (57%) than in PR interfaces (31%) (). Whereas, the charged side chain contributes significantly higher in H-bonds across the PR interfaces compared to PP interfaces. This may be attributed to the abundance of positively charged residues at PR interfaces. Neutral polar residues contribute almost equally to the H-bonds both at PP and PR interfaces. Among the nucleotides, backbone contributes 81% of all H-bonds at PR interfaces compared to only 58% at RR interfaces. All the bases have the opposite trend; contribute almost double in H-bonds at RR interfaces compared to PR interfaces ().
The ionic interactions between the positive and the negative charges contribute to the stability of PR interfaces [Citation45,Citation63]. These interactions lead to the formation of salt bridges. Both H-bonds and salt bridges contribute significantly to the macromolecular folding and binding [Citation44,Citation64]. We find the density of salt bridges is higher in PR interfaces than PP interfaces (supplementary Figure S2). Moreover, the density of salt bridges in PP interfaces is similar to that found in binary protein-protein interfaces. However, we find the density of salt bridges in PR interfaces is higher than that found in binary protein-RNA interfaces [Citation38].
We find Arg contributes significantly to the stacking interactions both at PP and PR interfaces. This observation is in accordance with the previous studies that report the high occurrence of Arg in binary interfaces [Citation38,Citation45]. The high pKa value of guanidium moiety, the extended flexibility of the side chain, positive charge and planar structure facilitate the interactions of Arg with the negatively charged groups as well as with the aromatic residues [Citation65]. Among the aromatic amino acids, Trp and Tyr contribute significantly higher to the stacking interactions in PR than in PP interfaces. It may be due to the presence of the side chain -NH group in Trp and -OH group in Tyr that facilitate the stacking interactions with the bases. Additionally, Trp has high preference towards the stacked orientation and strong sugar-π contacts, whereas, Tyr has the strongest polarity and forms multiple conformations with the sugar moiety [Citation53,Citation66]. Among the different bases, adenine and uracil contribute more to the stacking interactions than guanine and cytosine in PR interfaces. However, purines contribute more to the stacking interactions than pyrimidines in binary protein-RNA interfaces [Citation38]. Shape complementarity also plays an important role in macromolecular recognition [Citation40,Citation46], and is widely used in many macromolecular docking algorithms [Citation67]. We find that RR interfaces have the highest shape complementarity followed by PR and PP interfaces. However, shape complementarity both in PP and PR interfaces is lower than that found in respective binary protein-protein and protein-RNA interfaces [Citation38].
Classification of r-proteins in the assembly pathway
It has been increasingly apparent that the r-proteins follow a hierarchical order in the formation of ribosomal assemblies [Citation27,Citation32,Citation35,Citation68]. The assembly progress through a series of RNA folding and protein binding events, leading to the formation of multicomponent complex [Citation21,Citation22,Citation29]. In this study, the classification of r-proteins is performed using a supervised learning method. In the dataset, we have incorporated prokaryotic and eukaryotic r-proteins that are already classified by experimental studies. RF is used to predict the order of archaea r-proteins and the r-proteins that are having either ambiguous data or limited experimental details. The RF model accurately classifies 80% of r-proteins into early, intermediate and late binders using the structural and physicochemical parameters of PR interfaces. In the dataset, we find the early binders have the largest PR interface (average B = 6314 Å2) followed by the intermediate (average B = 4208 Å2) and the late binders (average B = 3333 Å2). In addition, the atomic packing density is significantly higher in early binders (LD = 44) followed by in intermediate (LD = 41) and late binders (LD = 40). The early binders have large interfaces, closely packed and make more polar interactions; hence they might be the first to assemble and promote the stepwise addition of intermediate and late binders. Our findings are in accordance with the earlier studies on the ribosomal assembly that observed the early binders tend to bury large surface area [Citation35]. Furthermore, in many oligomeric assemblies, it has been shown that the large interfaces form first and lead to the higher order intermediates in the assembly pathways [Citation62,Citation69,Citation70].
The number of misclassification is comparatively lower for the small subunit r-proteins than for the large subunit ones. In small subunit, we have classified uS5 as a late binder. The in vitro assembly map depicts it as a late binding protein [Citation68], whereas, the timing of stable assembly of its homologous protein (rpS2) is medium nucleolar in 40S assembly map [Citation32]. We have classified uL2 as an early binder, however, it is late nucleolar in 60S assembly map [Citation32]. In the dataset, the interface involving uL2 has a large area (B = 6959 Å2) and high atomic packing density (LD = 63). Based on these parameters it is classified into early binder. Recent studies demonstrate that uL2 is involved in structural rearrangement of 28S rRNA that induces proper PTC (peptidyl transferase center) architecture in mature ribosomes [Citation71]. It is one of the primary binding proteins in the 50S assembly map and is essential for the association of 30S and 50S subunits [Citation72]. We have classified eL29 as an intermediate binder, whereas the timing of assembly for eL29 is cytoplasmic or late in the 60S assembly. We have classified eL32 as an intermediate binder; however, it is an early nucleolar in the 60S assembly map. In general, our misclassification may be attributed to the fact that the mechanism of ribosomal assemblies in vivo differs than that of in vitro reconstitution experiments, which may bias the landscape of folding and the binding of r-proteins [Citation32].
Conclusion
We have dissected PP, PR and RR interfaces in ribosomal assemblies of prokaryotes and eukaryotes, and compared with those found in the respective binary assemblies. Our study elucidated substantial differences as well as similarities in macromolecular recognition sites between the ribosomal assemblies of prokaryotes and eukaryotes. Several structural, geometric and physicochemical parameters of these interactions show that the stability of each subunit of the ribosome is primarily due to PR interactions. The structural and the physicochemical properties of PR interfaces have been used to efficiently predict the hierarchical classification of r-proteins in the ribosomal assembly pathway. The large interfaces form first rule in the macromolecular assembly is also supported by the predicted binding orders of r-proteins using RF classifier. This study may help in detailed structural understanding on how macromolecular interaction networks stabilize the ribosomal assembly and provide valuable insights into our understanding of the assembly pathway.
Materials and methods
The dataset of ribosomal complexes
The PDB was scanned for entries representing ribosomal assemblies of different source organisms with resolution better than 4.0 Å, containing all the three different types of RNAs and a maximum number of small and large subunits r-proteins. All the selected entries were checked for modified residues and nucleotides, anisotropic factors, and unknown residues and bases. Structures having modified residues and nucleotide bases are commonly marked with the keyword ‘HETATM’, which were converted to their corresponding residues and bases along with the keyword ‘ATOM’. Coordinates with anisotropic factors (represented by the keyword ‘ANISOU’), and unknown residues and bases (represented by ‘UNK’) were removed following the PDB cleaning process [Citation38].
Number and size of the subunit interfaces
We have identified the pairwise interactions and quantified the B using the following equation:
Here, the first two terms represent the SASA of the two molecules in the isolated form and the last term represents the SASA of their binary assembly. SASA values were calculated using the program NACCESS [Citation47], which implements the Lee and Richards algorithm [Citation73]. All the atoms representing amino acids or nucleotides that lose solvent accessibility in the complex are selected as the interface atoms. B values were calculated using PRince [Citation74], and all the pairwise interfaces having B greater than 10 Å2 were kept for further analysis. The protein and the RNA chains were separated from the individual subunit, and all the possible pairwise PP, PR and RR interactions were generated by combination.
Amino acids and nucleotide composition
Percentage compositions of amino acid residues and (or) nucleotides at PP, PR, and RR interfaces are calculated based on their contribution to B. While calculating the surface composition, we excluded all the residues and (or) nucleotides which are part of any pairwise interfaces and contribute to B. The composition values can be transformed into propensities using the equation below:
where fB and fS are the percentage contribution of amino acids or nucleotides to B and to solvent accessible surface, respectively.
Classification of r-proteins
In this study, we have used the structural and physicochemical parameters of PR interfaces to classify the r-proteins in the assembly pathway. Depending on the assembly timeline, r-proteins are classified into three categories: (i) early binder, (ii) intermediate binder and (iii) late binder. The assembly maps of various small and large subunit r-proteins were studied both in vitro and in vivo [Citation23,Citation25,Citation68,Citation75–Citation80]. The Nomura assembly map depicts the hierarchy of small subunit (30S) r-proteins and the Nierhaus assembly map describes the order of the assembly of the large subunit (50S) r-proteins. A recent detailed review on the mapping of r-proteins in the eukaryotic ribosomal assembly has tabulated the cytoplasmic positioning and timing of r-proteins in the assembly pathway. The dataset for the classification was curated from the literature to identify the r-proteins that belong to the above-mentioned categories. Considering all the structural and physicochemical parameters as attributes (supplementary table S4), we have developed a prediction model using RF classifier [Citation39]. The RF classifier was trained on 90% of the randomly chosen data and tested on the remaining 10%. The classifier was constructed using 1000 decision trees with maximum depth and we have employed a stratified 10-fold cross-validation scheme. The precision (P), recall (R) and f1-score (F1) were calculated from true positives (TP), true negatives (TN), false positives (FP) and false negatives (FN) with the help of classification report function that builds a text report showing the main classification metrics. The performance of the classifier was evaluated by means of all the above scores along with an accuracy score. The algorithms were implemented using the scikit-learn package in python [Citation81].
Supplemental Material
Download Zip (908.2 KB)Acknowledgments
SPP and RPB acknowledge the support from DST, India. We thank Prof. Joel Janin and Dr. Jolly Basak for their critical comments on the manuscript.
Disclosure statement
No potential conflict of interest was reported by the authors.
Supplementary material
Supplemental data for this article can be accessed here.
Related Research Data
References
- Ramakrishnan V. Ribosome structure and the mechanism of translation. Cell. 2002;108:557–572.
- Maivali U, Remme J. Definition of bases in 23S rRNA essential for ribosomal subunit association. RNA. 2004;10:600–604.
- Sharma MR, Koc EC, Datta PP, et al. Structure of the mammalian mitochondrial ribosome reveals an expanded functional role for its component proteins. Cell. 2003;115:97–108.
- Ramakrishnan V. The ribosome: some hard facts about its structure and hot air about its evolution. Cold Spring Harb Symp Quant Biol. 2009;74:25–33.
- Schnare MN, Damberger SH, Gray MW, et al. Comprehensive comparison of structural characteristics in eukaryotic cytoplasmic large subunit (23 S-like) ribosomal RNA. J Mol Biol. 1996;256:701–719.
- Wilson DN, Doudna Cate JH. The structure and function of the eukaryotic ribosome. Cold Spring Harb Perspect Biol. 2012;4:a011536.
- Woolford JL Jr., Baserga SJ. Ribosome biogenesis in the yeast Saccharomyces cerevisiae. Genetics. 2013;195:643–681.
- Timsit Y, Acosta Z, Allemand F, et al. The role of disordered ribosomal protein extensions in the early steps of eubacterial 50 S ribosomal subunit assembly. Int J Mol Sci. 2009;10:817–834.
- Ban N, Nissen P, Hansen J, et al. The complete atomic structure of the large ribosomal subunit at 2.4 A resolution. Science. 2000;289:905–920.
- Wimberly BT, Brodersen DE, Clemons WM Jr., et al. Structure of the 30S ribosomal subunit. Nature. 2000;407:327–339.
- Davies C, White SW, Ramakrishnan V. The crystal structure of ribosomal protein L14 reveals an important organizational component of the translational apparatus. Structure. 1996;4:55–66.
- Golden BL, Ramakrishnan V, White SW. Ribosomal protein L6: structural evidence of gene duplication from a primitive RNA binding protein. EMBO J. 1993;12:4901–4908.
- Venema J, Tollervey D. Ribosome synthesis in Saccharomyces cerevisiae. Annu Rev Genet. 1999;33:261–311.
- Henras AK, Soudet J, Gerus M, et al. The post-transcriptional steps of eukaryotic ribosome biogenesis. Cell Mol Life Sci. 2008;65:2334–2359.
- Eichler DC, Craig N. Processing of eukaryotic ribosomal RNA. Prog Nucleic Acid Res Mol Biol. 1994;49:197–239.
- Burton B, Zimmermann MT, Jernigan RL, et al. A computational investigation on the connection between dynamics properties of ribosomal proteins and ribosome assembly. PLoS Comput Biol. 2012;8:e1002530.
- Agalarov SC, Sridhar Prasad G, Funke PM, et al. Structure of the S15,S6,S18-rRNA complex: assembly of the 30S ribosome central domain. Science. 2000;288:107–113.
- Ohmayer U, Gamalinda M, Sauert M, et al. Studies on the assembly characteristics of large subunit ribosomal proteins in S cerevisae. PLoS One. 2013;8:e68412.
- Gamalinda M, Jakovljevic J, Babiano R, et al. Yeast polypeptide exit tunnel ribosomal proteins L17, L35 and L37 are necessary to recruit late-assembling factors required for 27SB pre-rRNA processing. Nucleic Acids Res. 2013;41:1965–1983.
- Robledo S, Idol RA, Crimmins DL, et al. The role of human ribosomal proteins in the maturation of rRNA and ribosome production. RNA. 2008;14:1918–1929.
- Ferreira-Cerca S, Poll G, Gleizes PE, et al. Roles of eukaryotic ribosomal proteins in maturation and transport of pre-18S rRNA and ribosome function. Mol Cell. 2005;20:263–275.
- Kim H, Abeysirigunawarden SC, Chen K, et al. Protein-guided RNA dynamics during early ribosome assembly. Nature. 2014;506:334–338.
- Held WA, Ballou B, Mizushima S, et al. Assembly mapping of 30 S ribosomal proteins from Escherichia coli Further studies. J Biol Chem. 1974;249:3103–3111.
- Nierhaus KH. The assembly of prokaryotic ribosomes. Biochimie. 1991;73:739–755.
- Rohl R, Nierhaus KH. Assembly map of the large subunit (50S) of Escherichia coli ribosomes. Proc Natl Acad Sci U S A. 1982;79:729–733.
- Nierhaus KH, Dohme F. Total reconstitution of functionally active 50S ribosomal subunits from Escherichia coli. Proc Natl Acad Sci U S A. 1974;71:4713–4717.
- Ferreira-Cerca S, Poll G, Kuhn H, et al. Analysis of the in vivo assembly pathway of eukaryotic 40S ribosomal proteins. Mol Cell. 2007;28:446–457.
- Rabl J, Leibundgut M, Ataide SF, et al. Crystal structure of the eukaryotic 40S ribosomal subunit in complex with initiation factor 1. Science. 2011;331:730–736.
- Karbstein K. Inside the 40S ribosome assembly machinery. Curr Opin Chem Biol. 2011;15:657–663.
- Dutca LM, Culver GM. Assembly of the 5ʹ and 3ʹ minor domains of 16S ribosomal RNA as monitored by tethered probing from ribosomal protein S20. J Mol Biol. 2008;376:92–108.
- Mulder AM, Yoshioka C, Beck AH, et al. Visualizing ribosome biogenesis: parallel assembly pathways for the 30S subunit. Science. 2010;330:673–677.
- de la Cruz J, Karbstein K, Woolford JL Jr. Functions of ribosomal proteins in assembly of eukaryotic ribosomes in vivo. Annu Rev Biochem. 2015;84:93–129.
- Ban N, Beckmann R, Cate JH, et al. A new system for naming ribosomal proteins. Curr Opin Struct Biol. 2014;24:165–169.
- Brodersen DE, Clemons WM Jr., Carter AP, et al. Crystal structure of the 30 S ribosomal subunit from Thermus thermophilus: structure of the proteins and their interactions with 16 S RNA. J Mol Biol. 2002;316:725–768.
- Klein DJ, Moore PB, Steitz TA. The roles of ribosomal proteins in the structure assembly, and evolution of the large ribosomal subunit. J Mol Biol. 2004;340:141–177.
- Poirot O, Timsit Y. Neuron-like networks between ribosomal proteins within the ribosome. Sci Rep. 2016;6:26485.
- Berman HM, Westbrook J, Feng Z, et al. The protein data bank. Nucleic Acids Res. 2000;28:235–242.
- Barik A, Pilla CN, Bahadur RP SP. Molecular architecture of protein-RNA recognition sites. J Biomol Struct Dyn. 2015;33:2738–2751.
- Breiman L. Random forests. Mach Learn. 2001;45:5–32.
- Bahadur RP, Chakrabarti P, Rodier F, et al. A dissection of specific and non-specific protein-protein interfaces. J Mol Biol. 2004;336:943–955.
- Bahadur RP, Zacharias M, Janin J. Dissecting protein-RNA recognition sites. Nucleic Acids Res. 2008;36:2705–2716.
- McDonald IK, Thornton JM. Satisfying hydrogen bonding potential in proteins. J Mol Biol. 1994;238:777–793.
- Barlow DJ, Thornton JM. Ion-pairs in proteins. J Mol Biol. 1983;168:867–885.
- Xu D, Tsai CJ, Nussinov R. Hydrogen bonds and salt bridges across protein-protein interfaces. Protein Eng. 1997;10:999–1012.
- Allers J, Shamoo Y. Structure-based analysis of protein-RNA interactions using the program ENTANGLE. J Mol Biol. 2001;311:75–86.
- Lawrence MC, Colman PM. Shape complementarity at protein/protein interfaces. J Mol Biol. 1993;234:946–950.
- Hubbard S. NACCESS: program for calculating accessibilities. Department of biochemistry and molecular biology. London: University College of London; 1992.
- Kabsch W, Sander C. Dictionary of protein secondary structure: pattern recognition of hydrogen-bonded and geometrical features. Biopolymers. 1983;22:2577–2637.
- Savelsbergh A, Rodnina MV, Wintermeyer W. Distinct functions of elongation factor G in ribosome recycling and translocation. RNA. 2009;15:772–780.
- Balagopal V, Parker R. Stm1 modulates translation after 80S formation in Saccharomyces cerevisiae. RNA. 2011;17:835–842.
- Nadassy K, Wodak SJ, Janin J. Structural features of protein-nucleic acid recognition sites. Biochemistry. 1999;38:1999–2017.
- Treger M, Westhof E. Statistical analysis of atomic contacts at RNA-protein interfaces. J Mol Recognit. 2001;14:199–214.
- Ellis JJ, Broom M, Jones S. Protein-RNA interactions: structural analysis and functional classes. Proteins. 2007;66:903–911.
- Hwang H, Vreven T, Janin J, et al. Protein-protein docking benchmark version 4.0. Proteins. 2010;78:3111–3114.
- Bahadur RP, Chakrabarti P, Rodier F, et al. Dissecting subunit interfaces in homodimeric proteins. Proteins. 2003;53:708–719.
- Guthrie C, Nomura M. Initiation of protein synthesis: a critical test of the 30S subunit model. Nature. 1968;219:232–235.
- Hirokawa G, Nijman RM, Raj VS, et al. The role of ribosome recycling factor in dissociation of 70S ribosomes into subunits. RNA. 2005;11:1317–1328.
- Tissieres A, Watson JD, Schlessinger D, et al. Ribonucleoprotein particles from Escherichia coli. J Mol Biol. 1959;1:221–233.
- Gavrilova L, Ivanov D, Spirin A. Studies on the structure of ribosomes: III. Stepwise unfolding of the 50Sparticles without loss of ribosomal protein. J Mol Biol. 1966;16:473-489.
- Nierhaus KH. Mg2+, K+, and the ribosome. J Bacteriol. 2014;196:3817–3819.
- Lo Conte L, Chothia C, Janin J. The atomic structure of protein-protein recognition sites. J Mol Biol. 1999;285:2177–2198.
- Bahadur RP, Rodier F, Janin J. A dissection of the protein-protein interfaces in icosahedral virus capsids. J Mol Biol. 2007;367:574–590.
- Iwakiri J, Tateishi H, Chakraborty A, et al. Dissecting the protein-RNA interface: the role of protein surface shapes and RNA secondary structures in protein-RNA recognition. Nucleic Acids Res. 2012;40:3299–3306.
- Costantini S, Colonna G, Facchiano AM. ESBRI: a web server for evaluating salt bridges in proteins. Bioinformation. 2008;3:137–138.
- Neves MA, Yeager M, Abagyan R. Unusual arginine formations in protein function and assembly: rings, strings, and stacks. J Phys Chem B. 2012;116:7006–7013.
- Wilson KA, Kellie JL, Wetmore SD. DNA-protein pi-interactions in nature: abundance, structure, composition and strength of contacts between aromatic amino acids and DNA nucleobases or deoxyribose sugar. Nucleic Acids Res. 2014;42:6726–6741.
- Chen R, Weng Z. A novel shape complementarity scoring function for protein-protein docking. Proteins. 2003;51:397–408.
- Shajani Z, Sykes MT, Williamson JR. Assembly of bacterial ribosomes. Annu Rev Biochem. 2011;80:501–526.
- Levy ED, Boeri Erba E, Robinson CV, et al. Assembly reflects evolution of protein complexes. Nature. 2008;453:1262–1265.
- Bahadur RP, Janin J. Residue conservation in viral capsid assembly. Proteins. 2008;71:407–414.
- Yanshina DD, Bulygin KN, Malygin AA, et al. Hydroxylated histidine of human ribosomal protein uL2 is involved in maintaining the local structure of 28S rRNA in the ribosomal peptidyl transferase center. FEBS J. 2015;282:1554–1566.
- Diedrich G, Spahn CM, Stelzl U, et al. Ribosomal protein L2 is involved in the association of the ribosomal subunits, tRNA binding to A and P sites and peptidyl transfer. EMBO J. 2000;19:5241–5250.
- Lee B, Richards FM. The interpretation of protein structures: estimation of static accessibility. J Mol Biol. 1971;55:379–400.
- Barik A, Mishra A, Bahadur RP. PRince: a web server for structural and physicochemical analysis of protein-RNA interface. Nucleic Acids Res. 2012;40:W440–4.
- Mizushima S, Nomura M. Assembly mapping of 30S ribosomal proteins from E. coli. Nature. 1970;226:1214.
- Xu Z, Culver GM. Differential assembly of 16S rRNA domains during 30S subunit formation. RNA. 2010;16:1990–2001.
- Talkington MW, Siuzdak G, Williamson JR. An assembly landscape for the 30S ribosomal subunit. Nature. 2005;438:628–632.
- Ramaswamy P, Woodson SA. S16 throws a conformational switch during assembly of 30S 5ʹ domain. Nat Struct Mol Biol. 2009;16:438–445.
- Kruiswijk T, Planta RJ, Krop JM. The course of the assembly of ribosomal subunits in yeast. Biochim Biophys Acta. 1978;517:378–389.
- Gamalinda M, Ohmayer U, Jakovljevic J, et al. A hierarchical model for assembly of eukaryotic 60S ribosomal subunit domains. Genes Dev. 2014;28:198–210.
- Pedregosa F, Varoquaux G, Gramfort A, et al. Scikit-learn: machine learning in python. J Mach Learn Res. 2011;12:2825–2830.