
ABSTRACT
Alternative splicing (AS) plays a central role during cell-fate determination. However, how the core spliceosomal factors (CSFs) are involved in this process is poorly understood. Here, we report the down-regulation of the U2AF1 CSF during stem cell differentiation. To investigate its function in stemness and differentiation, we downregulated U2AF1 in human induced pluripotent stem cells (hiPSCs), using an inducible-shRNA system, to the level found in differentiated ectodermal, mesodermal and endodermal cells. RNA sequencing and computational analysis reveal that U2AF1 down-regulation modulates the expression of development-regulating genes and regulates transcriptional networks involved in cell-fate determination. Furthermore, U2AF1 down-regulation induces a switch in the AS of transcription factors (TFs) required to establish specific cell lineages, and favours the splicing of a differentiated cell-specific isoform of DNMT3B. Our results showed that the differential expression of the core spliceosomal factor U2AF1, between stem cells and the precursors of the three germ layers regulates a cell-type-specific alternative splicing programme and a transcriptional network involved in cell-fate determination via the modulation of gene expression and alternative splicing of transcription regulators.
Introduction
Alternative splicing (AS) is the mechanism by which exons can be included or excluded from a single precursor mRNA (pre-mRNA), to generate different mRNA isoforms. Indeed, the combinatorial selection of pre-mRNA splice sites generates structurally and functionally distinct protein isoforms and expands the coding capacity of eukaryotic genomes [Citation1,Citation2]. In the human genome, 95% of multi-exon genes are alternatively spliced and undergo mainly a tissue-specific regulation [Citation3]. In stem cells, for example, the inclusion of exon 18b in FOXP1 mRNA generates exon 18b forms FOXP1-ES, a FOXP1 protein isoform that is known to enhance the expression of pluripotency master genes and to inhibit differentiation genes [Citation4].
AS is catalysed by the spliceosome, the basal catalytic machinery that controls the splicing reaction [Citation5]. The spliceosome consists of small nuclear ribonucleoproteins (snRNPs) and non-snRNPs factors, such as heterogeneous nuclear ribonucleoproteins (hnRNPs), serine and arginine-rich proteins (SR) and SR-like proteins. These non-snRNP factors ensure that AS is accurate and act as linkers between the spliceosome and various cellular processes, such as transcription. Among these factors, tissue-specific RNA-binding proteins (RBPs) have been shown to fulfill specific functions during cell-fate determination [Citation6–Citation10]. By contrast, core spliceosomal factors (CSFs), which are constitutively expressed and considered to be essential for the splicing reaction and for cell survival, have been rarely associated with the regulation of AS [Citation11,Citation12] and never shown to play a role during physiological cell-fate determination. However, loss of CSF function, by depletion or mutation, has been shown to cause pre-mRNA splicing defects in a tissue- or cell type-specific manner via the modification of snRNP stoichiometry [Citation13–Citation15]. These findings have been further supported by SILAC studies in mice, which showed that spliceosomal components are differentially distributed among numerous tissues and organs [Citation16]. The role of CSFs in developmental abnormalities and cancer [Citation17–Citation19] has also been well investigated, while their role in physiological cell-fate determination remains under studied and little is understood.
Here, to understand the role of CSFs in physiological cell-fate determination and AS we performed a systematic evaluation of CSFs expression in human embryonic stem cells (hESCs) and in the three cell types that make up the embryonic germ layers (in vitro-derived ectodermal, mesodermal and endodermal cells), using available RNA-sequencing data [Citation20]. Among the identified differentially expressed CSFs, we found U2AF1 to be highly expressed in hESCs and downregulated during differentiation. Therefore, we investigated the functional role of this factor in stem cell maintenance and differentiation by down-regulating its expression in human induced pluripotent stem cells (hiPSCs) to the level found in differentiated cells, using an inducible shRNA system. These analyzes identified that transcriptional regulators are enriched for among the genes that are transcriptionally modulated by U2AF1 down-regulation, including pluripotency and development-regulating transcription factors (TFs). U2AF1 down-regulation also modulated the expression of the Let-7 c, miR-34b/c and miR411 miRNAs, which are involved in cell-fate determination. We also observed changes of AS upon U2AF1 down-regulation, including in the splicing of TFs that are required to establish specific cell lineages, such as ARNT, TRIM6 and DNMTF1. Finally, we found that U2AF1 down-regulation is associated with an increase in a specific DNMT3B isoform present in the three differentiated cell types and with a reduction in a stem cell-specific DNMT3B isoform. Our results thus show, for the first time, that the CSF U2AF1 contributes to transcriptional regulation in hiPSCs, most likely by modulating the expression and AS of transcriptional regulators, thus highlighting a link between AS and transcription regulation during physiological cell-fate determination.
Material and methods
hiPSC culture and differentiation
The human induced pluripotent stem cell line H9 (SBI, System Biosciences) was maintained on Matrigel (BD Biosciences) or on vitronectin (Stemcell Technologies) with chemically defined mTeSR (Stemcell Technologies) medium. Cultures were passaged by enzymatic dissociation using dispase or Gentle Cell Dissociation Reagent (Stemcell Technologies). hiPSCs were differentiated into mesoderm, endoderm and ectoderm, following the protocol described in [Citation20] and sorted the differentiated cells using the manufacturer FACS protocol.
Endoderm differentiation was induced in Advanced RPMI (Invitrogen) supplemented with 0.5% FBS (HyClone), Activin A (100 ng/ml) (R&D) and WNT3A (50 ng/ml) (R&D). Mesoderm differentiation was induced by adding media consisting of DMEM/F12 (Life Technologies), 0.5% FBS (HyClone), Activin A (100 ng/ml) (R&D) (for the first 24 h only), BMP4 (100 ng/ml) (R&D), VEGF (100 ng/ml) (R&D) and FGF2 (20 ng/ml) (Millipore). Ectoderm differentiation was induced using A83-01 (2 µm) (Tocris), PNU 74,654 (2 µm) (Tocris) and Dorsomorphin (2 µm) (Tocris) in DMEM/F12 (Life Technologies) containing 15% knock serum replacer (Life Technologies).
Generation and selection of doxycycline-inducible cell lines
To generate stable hiPSCs that express doxycycline-inducible shRNA, WT H9 hiPSCs were transduced with U2AF1 short hairpin RNA (shRNA) (SMARTvector Inducible Lentiviral shRNAs, Dharmacon) using a low multiplicity of infection (MOI) (0.3 TU/cell) for 5 h in 24-well plates. Scrambled shRNA was used as a SMART vector-inducible, non-targeting shRNA control. Three different shRNAs were independently transduced (V2IHSHER_244517, TACAAAGATGGGTTTCTGA) (V2IHSHER_244525, GCTGTGATTGACTTGAATA) and (V2IHSHER_244533, TAGAGGAGATGAACGTCTG). To select the stable clones with one integration event per cell and to remove non-transduced cells, puromycin selection was performed for 10 days at a concentration of 250 ng/mL. To validate the proper transduction and expression of the shRNA upon doxycycline induction, TurboRFP reporter was used for visual tracking. We first monitored U2AF1 expression upon doxycycline activation of shScramble negative control and observed no change in U2AF1 expression (Fig S2 C). After 48 h of doxycycline induction of shU2AF1 in hiPSCs, U2AF1 mRNA expression decreased by 50% compared to that in the negative control (). The establishment of our inducible shU2AF1 cell line has been validated more than 5 times. Upon doxycycline activation of the shU2AF1, two independent biological replicates, with the closest level of expression, which were sent for RNA sequencing. Each of these two biological replicates has been sequenced as two separate technical replicates. The additional samples were used to validate specific gene expression and AS changes.
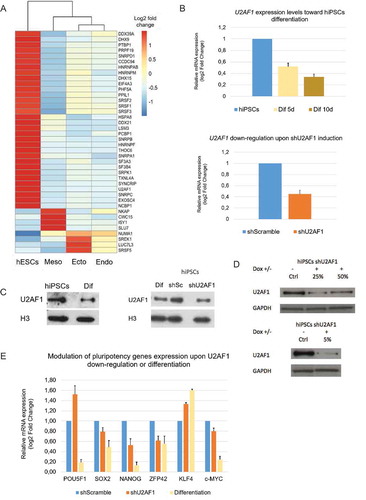
Figure 1. U2AF1 cell specific expression and the impact of U2AF1 down-regulation on pluripotency genes.
Reverse transcription−polymerase chain reaction
Total RNA was isolated from cells using QIAzol reagent (QIAGEN) and an miRNeasy Mini Kit (QIAGEN), according to the manufacturer’s directions. The RNA quality was monitored using an RNA 6000 Nano Kit and an Agilent Bioanalyzer (Agilent). cDNA was generated by reverse transcription with a Maxima First Strand cDNA Synthesis Kit for RT-qPCR with dsDNase (Thermo Scientific). For qPCR assays, gene expression analysis was performed using 2 ng of cDNA and SYBR Green I MasterMix (Roche). mRNA levels were normalized to the mean expression levels of GAPDH, Arpp0, and TBP. Triplicate samples were run on a LightCycler 480 Instrument II (Roche). For the gene expression changes, we validated the RNA-seq data using the sequenced sample with qRT-PCR customized pairs of primers generated and validated by QIAGEN. The validated target genes were transcription regulators and developmentally regulated genes both involved in cell fate determination. The validation rate was over 60%.
Western blotting
Cells were lysed in urea buffer (63 mM Tris–HCl pH 7.5, 2% (w/v) SDS, 5% (v/v) 2-mercaptoethanol, and 8 M urea), and cell lysates sonicated. Samples were resolved by native PAGE on 4-12% Bis-Tris protein gels and transferred to PVDF membranes (Thermo Fisher Scientific). Membranes were blocked in PBS containing 5% (w/v) milk powder and 0.05% (v/v) Tween-20 (PBST) for 1 h and probed with the following primary antibodies at 4°C overnight: anti-U2AF1 (1:1000, ab172614, Abcam), anti-histone H3 (1:1000, 06–755, EMD Millipore). After washing with PBST, membranes were incubated with either anti-mouse or anti-rabbit secondary antibodies conjugated to horseradish peroxidase (HRP) for 1 h at room temperature IgG-HRP (1:5000, 0867428, MP Biomedicals) or anti-rabbit IgG-HRP (1:5000, 0861202, MP Biomedicals). Signals were detected with SuperSignal Chemiluminescent Substrates (Thermo Scientific).
RNA-seq data analysis
Raw data were retrieved from (GSM1112847, GSM1112845, GSM1112846, GSM111284, GSM1112835, GSM1112833, GSM1112834, GSM1112837) (Gifford et al. 2013) and were aligned against the human reference genome Grch37 using the STAR aligner [Citation21] (version 2.5.2a_modified) with the following options: « – outFilterType BySJout – outFilterintronMotifs RemoveNoncanonical – seedSearchStartLmax 30 – alignintronMax 200,000 – twopassMode Basic ».
Differential expression at the transcript level was assessed using Cuffdiff [Citation22] and was run with the following options: « – min-reps-for-js-tes 2 – library-type = ‘fr-firststrand’ – dispersion-method = ‘per-condition’ – multi-read-correct ». The list of splicing factors has been defined using Spliceosome Database.
mRNA sequencing
Total RNA was isolated from cells using QIAzol reagent (QIAGEN) and the miRNeasy Mini Kit (QIAGEN) according to the manufacturer’s directions. The RNA quality was monitored using the RNA 6000 Nano Kit and Agilent Bioanalyzer (Agilent). A 1 μg sample of total RNA was treated with RiboZero (Ribozero, Epicentre) to eliminate ribosomal RNA and to isolate long noncoding RNA. Libraries were prepared with the original TruSeq Illumina kit and protocols, and cDNA fragments with an average size of 100–200 bp were obtained (Illumina). cDNA fragments were isolated and sequenced on an Illumina HiSeq 4000 with 2 × 150 bp reads (100 million 2 × 150 bp reads/sample) (Fasteris).
RNA-Seq read mapping was done using Tophat, and reads were aligned to GRCh37, the Genome Reference Consortium human genome build 37. Isoform expression measurements were performed and differential gene expression was obtained using the Fasteris Tuxedo pipeline [Citation22].
Ninety per cent of the sequence reads (100 million reads per sample and 2 biological replicates) were mapped to the reference genome Grch37 (https://www.ncbi.nlm.nih.gov/geo/query/acc.cgi?acc=GSE119700). These sequences were then used to analyse the expression profile of each sample, and.
Alternative splicing analysis
To investigate the regulation of AS events, we used the computational method VAST-TOOLS (version 2.0.0) [Citation23], which enabled us to obtain broad coverage of AS events with a 95% probability that |ΔPSI| is greater than 10. To extend our analysis, we also determined mRNA isoforms identified as AS events using VAST-TOOLS, which has additional feature types and a different event database, VastDB (doi.org/10.1101/gr.220962.117), underlying the method. VAST-TOOLS profiles and classifies AS events into several types, calculates Ψ values for events, and assesses the difference in these values in two conditions. VAST-TOOLS recognizes skipped exons, micro-exons, and alternative 3ʹ/5ʹ SS, and is more sensitive to retained intron detection than other tools, in part due to the much larger annotation database. Compared to other tools, VAST-TOOLS can identify more retained intron (RI) events, as there are >10-fold more of these events in its splicing database. VAST-TOOLS is freely available at https://github.com/vastgroup/vast-tools.git. Subsequently, MATT is applied on Vast-tools splicing analysis to analyse additional features of pre-mRNA sequences.
The sashimi plots have been generated using a standard splicing visualization tool called MISO and are showing alternative splicing changes with a 95% probability that |ΔPSI| is greater than 10 and an absolute ΔPSI greater than 15. The drawing of reads cropped automatically by the software due to the basal threshold applied by the developer. The examples of AS events controlled by U2AF1 expression level presented in and supplementary information, are sashimi plots automatically generated using Miso, based on the splicing analysis performed using VAST-Tools and reads quantifications localized at the corresponding coordinates showing a modulation of a functional domain.
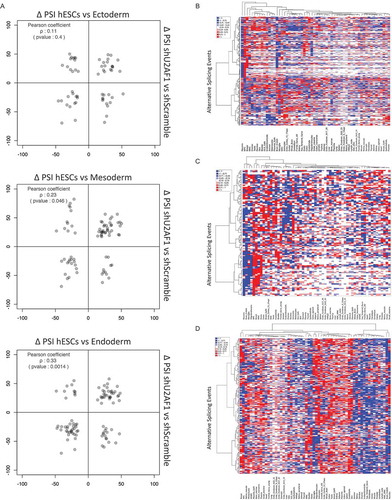
Clustering and heat maps illustrating the differential expression of cell-type-specific AS events driven by U2AF1 have been generated using XLSTAT software. The expression levels of each isoform in a specific cell type were extracted from the VastDB EXPRESSION Table, which provides gene expression values across tissues, cell types and developmental stages measured in cRPKM. These Expression values were reported to the control condition represented by the average value of the expression of each AS event in several hiPSCs clones. A colour code is assigned to the expression levels, a gradient from red to blue is used. When the expression of a specific event is higher than the hiPSCs control condition the associated colour is red while a lower expression is associated to blue and when the expression is unchanged or close to the control condition the white is assigned by the software. X-axis represents the different cell types and the Y-axis represents the AS events.
Matt analysis
For the downstream analysis of the result tables generated by VAST-TOOLS, we used a Unix tool called Matt (v1.2.0), available at http://matt.crg.eu/ [24]. Matt works on tables, where rows correspond to objects, e.g. exons and genes, and columns correspond to features of these objects, and it is specifically designed to extract AS events of interest. We used get_vast, a dedicated Matt command, to create tables that contain the necessary pieces of information with rows corresponding to AS events (skipped exons, retained introns, and alternative 3ʹ and 5ʹ splice sites) and columns corresponding to the frequencies of these events across samples (called percent spliced in, PSI).
Finally, we obtained all skipped exons, their PSI values across samples, the ΔPSI values (downregulated vs. control condition), and gene IDs in the form of a new exon table.
Next, we defined categories with a PSI-based threshold in this exon table and obtained, according to the ΔPSI value, 1831 silenced exons (ΔPSI ≥ 15), 2050 enhanced exons (ΔPSI ≤ −15), 2080 unregulated exons (abs (ΔPSI) ≤ 1), and all other exons. The exon table was extended by a column GROUP with the group IDs of silenced, enhanced, unregulated, and non associated (NA) (If one or more transcripts of the event do not appear in the expression file), accordingly. Next, with the commands cmpr_exons and cmpr_introns, we compared the three groups and obtained a table with extracted features for the exons and introns, and a PDF report with box plots that show the distribution of exon/intron features for each group, as well as information on the features that show significantly different distributions between the groups. We extracted features of interest for studying exons/introns, such as GC content, length, splice site strength, and predicted branch points.
MATT is actually applied on Vast-tools splicing analysis to analyse additional features of pre-mRNA sequences.
MetaCoreTM analysis
To identify the meanings of the outcome of our RNA-sequencing computational analysis, in addition to literature exploration, we used MetaCoreTM. MetaCoreTM is an integrated software suite (version 6.36) for functional analysis of Next Generation Sequencing and other multi-OMICs data. MetaCoreTM is based on a high-quality, manually curated database of (A) transcription factors, receptors, ligands, kinases, drugs, and endogenous metabolites, as well as other molecular classes; (B) species-specific directional interactions between protein-protein, protein-DNA and protein-RNA interactions, drug targeting, and bioactive molecules and their effects; (C) signalling and metabolic pathways represented on maps and networks; (D) rich ontologies for diseases and processes with hierarchical or graphic output. We used the following function (A) Functional Enrichment by Ontology; (B) Enrichment by Protein Function; (C) GO processes and Process Networks; (D) Build Networks (Direct interaction and Transcriptional Regulation) and (E) Transcription Factors. Differentially expressed or alternatively spliced respective sets of gene upon U2AF1 down-regulation were mapped onto MetaCore™ functions and these mappings were sorted by their p-values and represented graphically or into tables.
Results
Expression of CSFs and U2AF1 in hESCs and differentiated cells
To investigate whether CSFs are involved in the control of cell-fate determination, we analysed the expression levels of all splicing factors, referenced in the Spliceosome Database, in the male hESC line, HUES64, and in three embryonic cell types ectoderm, endoderm and mesoderm, which were in-vitro differentiated. To achieve this, we retrieved high-throughput RNA-seq open access data for these four cell lines from (GSM1112847, GSM1112845, GSM1112846, GSM111284, GSM1112835, GSM1112833, GSM1112834, GSM1112837) [Citation20], and we aligned the raw data to the human reference genome, Grch37, using the STAR aligner [Citation21]. Using Cuffdiff [Citation22], we identified 40 transcripts, genes ( and S1) and known isoforms (Figure S2A), encoding CSFs, SR proteins and hnRNPs, that are differentially expressed in hESCs and the three differentiated cell types. We distinguished three expression groups: the first group contained genes that are specifically expressed in pluripotent hESCs; the second group, genes that are expressed mainly in the mesoderm; and the third group, genes that are expressed mainly in the ectoderm and endoderm ( and S2A). Working on the basis that the upregulation of a splicing factor in a specific tissue or cell type would lead to a context-dependent functional outcome, we focused on those CSFs that are upregulated in hESCs, and particularly on U2AF1, which has previously been shown to play an important role during the reprogramming of mouse iPSCs [Citation25]. By analysing exon junction coverage, we found that the U2AF1 isoform (NM_006758) is more highly expressed in hESCs relative to differentiated ectodermal, mesodermal and endodermal cells (Fig. S2B). We then used qRT-PCR and immunoblotting to validate the differential expression of U2AF1 during differentiation of human induced pluripotent stem cell (hiPSC) model previously validated [Citation26]. We found that U2AF1 is more highly expressed in pluripotent hiPSCs than it is in the in-vitro differentiated cell types ( (up) and 1 C (left)). This downregulation reaches a plateau beyond 12 to 14 days of differentiation (data not shown). Therefore, we showed that human stem cell differentiation correlate with the modulation of CSFs stoichiometry.
U2AF1 down-regulation modulates gene expression and impairs the stoichiometry of pluripotency genes
Next, to investigate the functional role of U2AF1 in stem cell maintenance and differentiation we used a doxycycline-inducible shRNA approach to decrease U2AF1 levels (60%) to that previously reported in hiPSC-derived differentiated cell types ( (down), 1 C (right), 1D and S2 C). Using MetaCoreTM software, analysis of U2AF1 transcriptional regulators revealed that U2AF1 expression is under the control of NANOG and KLF4 via CREB1, which may explain the difference of U2AF1 expression levels between stem cells and differentiated precursors in vivo (Fig S2D). Therefore, we investigated changes in pluripotency gene expression following U2AF1 down-regulation by qRT-PCR and found that the genes POU5 F1, NANOG, ZFP42 (or REX1) and KLF4 showed altered expression and stoichiometry in hiPSCs upon U2AF1 down-regulation, compared to their expression levels in the shScramble control cells and in the differentiated hiPSCs (). U2AF1 could act directly at the transcriptional level as a regulator/co-regulator or at a post-transcriptional level via the regulation of miRNA such as let-7 c, Mir-34b/c that target NANOG and KLF4.
To survey the landscape of gene expression upon U2AF1 down-regulation, we performed high-throughput RNA-seq analysis on shU2AF1 and shScramble hiPSCs samples and evaluated the differential expression of genes, as well as of protein isoforms between the two samples. After 48 h of U2AF1 down-regulation, 609 genes showed significant differential expression between the two samples (p-value < 0.05) (). Among these genes, 193 genes were upregulated and 93 genes were downregulated with a fold change equal to or greater than 1.5. Using MetaCoreTM, we performed a Gene Ontology analysis on the differentially expressed genes, and found genes involved in organ and tissue development, morphogenesis and differentiation were enriched in this dataset (Fig S2E), particularly those dependent on developmental Hedgehog, BMP/GDF and NOTCH signalling (Fig S2E).
Figure 2. Developmentally regulated genes and transcription factors are enriched for among the U2AF1 target genes.
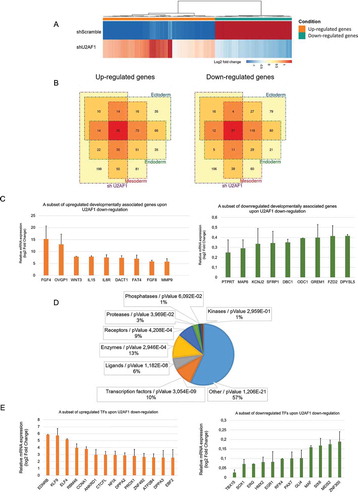
We then compared the genes that were differentially expressed on U2AF1 down-regulation with those differentially expressed during in-vitro cell differentiation (About 6000 genes). We identified subsets of genes that were differentially expressed during both mesoderm differentiation and on U2AF1 down-regulation (225/609), and also during endoderm (171/609) and ectoderm (142/609) differentiation and on U2AF1 down-regulation (). We then analysed the expression of genes expressed exclusively in mesoderm, endoderm or ectoderm: 89 mesoderm-specific genes showed differential expression following the down-regulation of U2AF1, compared to 27 ectoderm-specific genes and 26 endoderm-specific genes (). In fact, many of the genes that were up- or down-regulated following U2AF1 down-regulation have been linked to hESC differentiation ( and S2 F) and play central roles in cell-fate determination, such as FGF4, WNT3, FZD2 and NODAL [Citation27–Citation30]. These results indicate that U2AF1 down-regulation impairs the balance of pluripotency-associated genes and modulates the expression of developmentally regulated genes.
Function of differentially expressed genes in hiPSCs cells following U2AF1 down-regulation
Following U2AF1 down-regulation, we also analysed the enrichment by protein function of the differentially expressed genes, with a fold change equal to or greater than 1.5. Using MetaCoreTM software, our analysis showed that transcription factors (TFs) represent >10% of the differentially expressed genes (). This proportion reaches 20% if transcription coactivators and chromatin modifiers are included in the list of TFs with specific regulatory sequences. Indeed, if we consider that TFs represent only 3.15% of the human genes in the MetaCoreTM database, the modulation of TFs upon U2AF1 down-regulation represents a threefold enrichment. Among these differentially expressed TFs, we detected a large group involved in cell differentiation ( and S3A), confirming the impact of U2AF1 on cell-fate-related TFs and their stoichiometry (). Both qRT-PCR and RNA-seq data analysis revealed increased expression of the TFs Krüppel-like factor 9 (KLF9) and ELF4 (). KLF9 is a TF involved in neurogenesis, definitive endoderm commitment, and in hepatocyte differentiation [Citation31], and ELF4 has been linked to osteogenesis, adipogenesis and to haematopoietic stem cell quiescence via the activation of KLF4 expression [Citation32]. These results suggest that U2AF1 down-regulation in hiPSCs might enhance differentiation via the transcriptional activation of developmental genes. U2AF1 down-regulation also resulted in the decreased expression of SOX1 (), a neural stem cell marker [Citation33], and of PAX7 (), which is essential for satellite stem cell function during regenerative myogenesis and which triggers precocious differentiation when downregulated [Citation34]. Finally, U2AF1 down-regulation decreased the expression of TFs, such as RFX4, ERG and MAF (), which are involved, respectively, in the conversion of fibroblasts to self-renewing totipotent neural precursors, in haematopoietic stem cell self-renewal and in promoting the self-renewal of human mesenchymal stem cells [Citation35–Citation37]. Thus, these results show that the down-regulation of U2AF1 leads to altered TF expression, which could ultimately lead to the loss of self-renewal and to impaired hiPSC differentiation potential.
To further dissect the transcriptional regulation mediated by U2AF1, using MetaCoreTM software, we analysed the transcriptional regulatory networks that control the differentially expressed genes upon U2AF1 down-regulation (genes with a 1.5-fold change in expression). Remarkably, we found that pluripotency-related genes, such as c-MYC, Oct3/4, NANOG, SOX2 and KLF4, or factors closely associated with differentiation, such as STAT3, GATA-3 and STAT1, control most of the top 30 transcriptional regulatory networks (Fig S3B). Indeed, NANOG and KLF4 regulate, respectively, 27 and 22 genes differentially expressed upon U2AF1 down-regulation as compared to the control condition. Among the genes controlling these networks, the CREB1, HIF1A, Oct3/4 and ESR1 TFs are found within the U2AF1-associated regulatory network, which shows the transcriptional regulation from NANOG and KLF4 to U2AF1 (Fig. S2D). These findings thus indicate that an extensive overlap exists between the transcriptional regulation of cell-fate-associated TFs and of the genes with modulated expression on U2AF1 down-regulation as indicated by red and blue circles (Fig. S3 C-S3E), and that U2AF1 might, therefore, be involved in cell-fate regulation via a coordinated network of TFs. Next, we investigated whether the differentially expressed genes following U2AF1 down-regulation undergo transcriptional or post-transcriptional regulation. To do so, we used a method based on standard RNA-seq data analysis, called EISA (Exon Intron Split Analysis) [Citation38]. Using this method, transcriptional regulation is deduced when both exonic and intronic reads follow the same dynamic, whereas post-transcriptional regulation is assumed when only exonic sequences are modulated. Surprisingly, we found that both up- and downregulated genes mainly underwent transcriptional regulation, with, approximately 70% of the modulated genes regulated at the transcriptional level (Fig. S4). Moreover, since U2AF1 contains two zinc finger domains (Fig. S5A), first described as DNA-binding motifs, it is possible that U2AF1 might interact directly with these TFs. To test this hypothesis, we analysed U2AF1 ChIP-seq peak data from the ENCODE Project Consortium (The ENCODE Project Consortium, 2012) for two cancer cell lines, K562 (GSE105685) and HepG2 (GSE106030). A distribution analysis of U2AF1 binding loci relative to the transcription start site (TSS) of U2AF1 target genes showed that ~15% of its binding loci are localized 0–3 kb each side of the TSS (Fig. S5B). Furthermore, an analysis of the distribution of U2AF1 binding sites on genomic regions shows that ~15–17% of U2AF1 binding sites are located in promoter regions, while 43–45% are in exons and introns (Fig. S5C). Among the U2AF1 ChIP-seq targets, 14 and 20 genes overlap with up- and downregulated genes following U2AF1 down-regulation, respectively (Fig. S5D), and more than 50% of these genes have been shown to be regulated at the transcriptional level using the EISA method (Fig. S4 and data not shown). A subsequent protein functional enrichment analysis showed that more than half of these overlapping genes are cell-fate-associated TFs and/or transcriptional regulators, including SOX1, NFIX and MAFA (Fig. S5D). Taken together, these data show that U2AF1 transcriptionally regulates a subset of genes, including TFs involved in cell-fate determination and may act as a direct transcriptional regulator via its zinc finger domains. Further investigations on U2AF1 DNA-binding capacities could bring a new insight into the direct transcriptional regulatory role of U2AF1 in the context of cell-fate determination. U2AF1 downregulation in hiPSCs also triggered indirect effect on cell fate determination, indeed RNA-sequencing analysis of small non-coding RNAs upon U2AF1 downregulation showed the modulation miRNAs expression. Forty-three miRNAs underwent a significant change in their expression, relative to their expression in shScramble control cells (Fig. S5E and data not shown). Among these miRNAs, 41% (18/43) were shared with the miRNAs specific to the ectodermal fate, 51% (22/43) with the mesodermal miRNAs subset and 72% (31/43) with the endodermal miRNAs subset (Fig. S5F). Moreover, the expression of 10 of these 43 miRNAs increased upon U2AF1 downregulation as well as upon ectodermal, mesodermal and endodermal differentiation, including Let-7 c and Mir-34b/c, which function in cell fate determination by targeting the POU5F1, LIN28, c-Myc, Nanog, and Sox2 pluripotency master genes (Fig. S5G). Approximately 10% of the genes that were differentially expressed upon U2AF1 downregulation are targets of these 43 miRNAs. Protein function enrichment of the U2AF1-dependent miRNA targets, using MetacoreTM, showed that 16% are TFs, which represents a fivefold enrichment compared to the 3.15% of human TFs in the genome (Fig. S5H). Moreover, network analysis revealed an enrichment of developmental NOTCH, FGF2/TGF and BMP/GDF signalling factors (Data not shown). These findings support an indirect role for U2AF1 in cell fate determination via miRNAs that target transcriptional regulators.
AS patterns following U2AF1 down-regulation
U2AF1 might affect expression of TFs by changing their alternative splicing profile. To better understand how cell-specific U2AF1 expression levels lead to the selection of certain splice sites (SS), we analysed the distribution of specific features of enhanced, silenced and unregulated AS events using a toolkit for analysing AS events, called Matt [Citation24] (Figs. S6 and S7). First, we determined the threshold between the percent splice in (PSI) values of the spliced and unspliced sequences as ΔPSI ≥ 15, which defined 2050 enhanced, 1831 silenced, and 2080 unregulated AS events based on the quantification of exonic and intronic reads upon the down-regulation of U2AF1 as compared to the control condition (Fig. S6A). Interestingly, we discovered that both silenced and enhanced U2AF1-dependent exons and introns were significantly shorter than those for the unregulated events (Fig. S6B). Further analysis of the sequences adjacent to the alternatively spliced exons and introns revealed significant exon and intron length differences among enhanced, silenced and unregulated AS events (Figs. S7A and S7B). Thus, U2AF1 down-regulation seems to lead to the AS of shorter exonic and intronic sequences and to silence exons located between long introns. Another characteristic was the GC content of alternatively spliced exons and introns, which we discovered was higher than that of the unregulated sequences (Figs. S6 C). Consistent with the involvement of GC content in exon/intron definition [Citation39], we found that the exons and introns upstream and downstream of spliced sequences have a higher GC content than do the exons and introns upstream and downstream of the unregulated sequences (Fig. S7 C and S7D). Additional analyses of the SS strength showed that the 5ʹ SS of unregulated exons exhibited a significantly weaker SS strength than did those of the enhanced or silenced exons, while the 3ʹ SS showed a significant difference only between the silenced condition and the other conditions (Fig. S6D). Conversely, the 5ʹ SS and 3ʹ SS of unregulated introns had a significantly stronger SS strength than did the 5ʹ SS and 3ʹ SS of enhanced or silenced introns (Fig. S6E). Therefore, U2AF1 down-regulation seemed to differentially affect exonic and intronic sequences based on the strength of their 5ʹ and 3ʹ SS. These results indicate that the level of expression of the CSF U2AF1 in a specific cell-type is important for SS definition in a context-dependent manner.
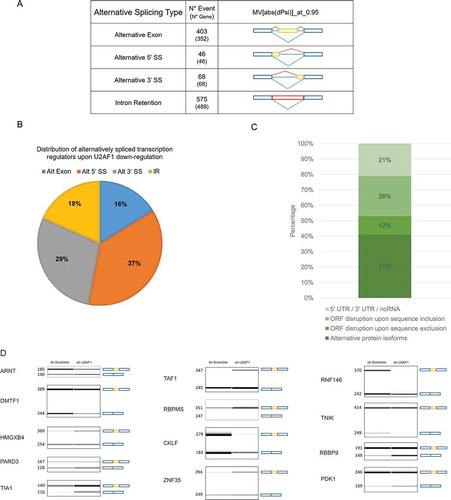
Functional consequences of AS switches following U2AF1 down-regulation
To investigate the global AS profiles controlled by U2AF1, we used the same high-throughput RNA-seq raw data that was used for the initial gene expression analysis [Citation20], and applied a computational method, VAST-TOOLS [Citation23]. We also used this method to analyse shU2AF1 and shScramble hiPSC RNA samples and found that U2AF1 down-regulation modulates 403 alternative exons, 46 5ʹ alternative SS, 68 3ʹ alternative SS and more than 372 intron retention events (). To explore the functional consequences of these AS changes, we explored the literature to investigate the function of the genes that underwent AS in response to U2AF1 down-regulation. Interestingly, >20% of the genes that underwent at least one splicing event were transcription regulators while transcriptional regulators within the genome represent about 3%, which represent a sevenfold increase (). Of the subset of 245 alternatively spliced transcriptional regulators (p-value = 0.0257), >30% were zinc finger proteins which is consistent with the finding that links the knockdown of these proteins to AS modulation [Citation40]. To understand the impact of these AS events at the protein level, we investigated whether these events could modulate specific domains that are involved in the transcriptional regulation of gene expression. To do so, we analysed the impact of these AS on the open reading frame (ORF) of transcripts using the database, VastDB [Citation41]. This database provides complementary information on splicing events previously validated by the computational method, VAST-TOOLS. Of the 245 AS events associated with a transcriptional regulator, 64% are predicted to have an effect at the protein level, among which <26% are predicted to disrupt the ORF upon sequence inclusion and 41% are predicted to create a new alternative protein isoforms which represents about 18% increase as compared to new isoforms of non transcriptional regulators (). Among new protein isoforms generated following U2AF1 down-regulation by the inclusion of an alternative exon, TAF1 (), the largest component and a core scaffold subunit of the TFIID basal TF complex, which plays a central role in the pluripotency transcriptional network [Citation42], U2AF1 down-regulation in hiPSCs also modulates the AS of a larger group of transcriptional regulators that are involved in cell-fate determination, as well as that of several RBPs (Figs. S8A, S8B and S9A). AS triggers the disruption of the ORF of several transcriptional regulators related to cell-fate determination. The MLL5 protein, which is involved in haematopoietic differentiation [Citation43] (Fig. S8B), LMO3, a TF required for adipogenesis [Citation44], and ZNF202, a zinc finger protein involved in macrophage differentiation [Citation45]. However, the impact of other U2AF1-dependent AS changes on genes, such as the polycomb-associated factor MTF2, a transcriptional regulator involved in mouse ESC pluripotency and somatic cell reprogramming [Citation46], remains to be determined.
Figure 3. U2AF1 down-regulation governs a specific AS program and impacts open reading frame of transcription factors.
It is notable that the down-regulation of U2AF1 did not systematically disturb ORFs but instead favoured the AS of one isoform over another at a specific functional domain (, and S9B, S9 C). For instance, PLAG1, a transcriptional regulator of human haematopoietic stem and progenitor cells [Citation47], and TRIM6, which transcriptionally regulates both c-MYC and NANOG expression and induces differentiation when depleted [Citation48], are both alternatively spliced, and these AS events are localized at the zinc finger domains of these proteins ().
Figure 4. U2AF1 down-regulation preferentially modulates TFs’ AS and favors the DNMT3B isoform specific to differentiated cell-types(A, B) Sashimi plots showing RNA-Seq reads of two genes involved in cell-fate regulation, and how the alternative splicing events of these genes localize to their functional domains, leading to the creation of a new protein isoform or to the disruption of the ORF. (C) Sashimi plots showing the RNA- seq reads of DNMT3B localized to its functional domains. In addition, these plots show how the down- regulation of U2AF1 in hiPSCs favors the splicing of the DNMT3B. (D) Schematic representation of DNMT3B functional domains impacted by U2AF1 down-regulation.
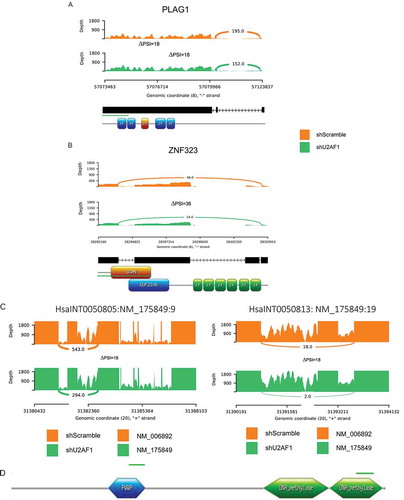
A further analysis of the cell-type-specific expression of AS isoforms revealed that the down-regulation of U2AF1 in hiPSCs favours the exclusion of three alternative exons of the DNA methyltransferase DNMT3B, a crucial regulator of gene expression and transcription (). Notably, these alternative exons are located in regions that encode the PWWP and DNA methylase functional domains of DNMT3B (). These three alternative exons are included in the DNMT3B isoform 1 (NM_006892), which is restricted to undifferentiated hESCs, and are excluded from the DNMT3B isoform 3 (NM_175849), which is predominantly expressed in the three differentiated cell types [Citation20]. Our findings thus show that U2AF1 down-regulation drives the isoforms of DNMT3B, from a stem cell-specific isoform to a differentiated cell-specific isoform, in a level-dependent manner. Indeed, this AS switch occurred in hiPSCs as soon as the level of U2AF1 expression was reduced to that observed in the three differentiated cell types. Interestingly, it has been shown that differentiation leads to the catalytic inactivation of the stem cell-specific DNMT3B isoform [Citation20,Citation49].
Effects of U2AF1-mediated AS on cell-fate determination
We next performed a Gene Ontology analysis of the genes that were alternatively spliced following U2AF1 down-regulation. This analysis revealed that genes involved in neurogenesis, haematopoiesis and cardiac development were enriched in this gene set, in addition to genes that encode components of NOTCH signalling, nuclear ESR1 signalling and RNA polymerase II transcriptional regulation (Fig. S9A). To determine whether the AS program driven by U2AF1 would lead to the differentiation of one of the three differentiated cell types, we performed clustering and compared the AS events that are controlled by U2AF1 to the splicing events that occur when mesodermal, ectodermal or endodermal cells differentiate. The results show that as compared to hESCs, mesoderm and endoderm shared 77 and 90 AS events, respectively, with shU2AF1 hiPSCs, while ectoderm had only 58 AS events in common with shU2AF1 hiPSCs when compared to the control shScramble. However, when we analyse these AS programmes in terms of the PSI, U2AF1-dependent AS events show a significant positive correlation with mesodermal and endodermal AS events but no significant correlation with the ectodermal AS program (). These results suggest that U2AF1 down-regulation favours preferentially mesodermal and endodermal differentiation via the modulation of a specific subset of AS events. Subsequently, we analysed the cell-type-specific expression of the AS events obtained upon U2AF1 down-regulation in hiPSCs using VastDB. We performed cluster analysis of the expression levels of each AS event driven by U2AF1 in stem cells and various terminally differentiated cells from the three germ layers precursors. This analysis revealed that a very substantial subset of AS isoforms generated by U2AF1 down-regulation, including alternative exons, Intron Retention (IR) events and 5ʹ/3ʹ SS, are present at similar levels in hiPSCs downregulated of U2AF1 and in terminally differentiated cells from the three germ layers precursors. More surprisingly, these AS isoforms show a significant up- or down-regulation in differentiated cells, compared to their levels of expression in stem cells (–)). Overall, these splicing analysis results highlight the importance of CSFs stoichiometry during cell-fate determination, and indicate that U2AF1 is involved in cell-fate regulation via the modulation of the AS of transcriptional regulators.
Figure 5. U2AF1 controls a cell-specific AS program.
Discussion
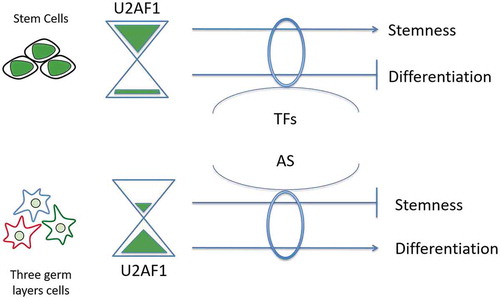
In this study, we addressed the question of the role of CSFs during cell-fate determination; we showed how a cell-type-specific expression of a CSF modulates AS and gene expression in order to influence stem cells to maintain their pluripotency and self-renewal or to favour a specific commitment. Our results suggest a model () in which the CSF U2AF1, which undergo a differential expression in stem cells and in the three in-vitro differentiated embryonic cell types, is essential for each cell type to acquire and maintain its identity and also to fulfil its cell-fate determination in a level-dependent manner. Here, we report that the down-regulation of U2AF1 in hiPSCs, to the level found in mesodermal, endodermal and ectodermal cells, alters the gene expression of specific subsets of TFs that are required for cell-fate determination.
Figure 6. Model of a level-dependent action of the core spliceosomal factor U2AF1 during cell fate regulation. Modulation of U2AF1 expression levels trigger gene expression changes via both transcriptional regulation and AS changes.
AS has been associated with various biological processes, including the cell cycle, metabolism and RNA/protein localization and synthesis [Citation50]. Moreover, transcriptional regulation and AS have been associated in many studies; these studies have shown that the catalytic spliceosome is in spatiotemporal proximity to the transcriptional machinery and also how splice site availability or spliceosome assembly, influences elongation rate during transcription [Citation51,Citation52]. In addition, a recent study has highlighted the influence of zinc finger proteins and TFs in murine ESCs and neural cell AS networks, enhancing the link between transcription regulation and AS [Citation40]. However, how CSFs are involved in the maintenance of stemness or in the induction of cell-fate commitment remains to be fully understood.
Our data indicate that U2AF1 modulates the expression of TFs to maintain pluripotency and self-renewal or to trigger differentiation towards a specific cell-fate. The functional significance of our findings is underscored by the fact that CREB1, Oct3/4, FOXP1 and NANOG control the transcriptional regulation of U2AF1, in vivo. In addition, the subsets of genes that are up or downregulated following U2AF1 down-regulation are involved in cell-fate determination pathways, regulated by Oct3/4, KLF4, SOX2 and NANOG pluripotency factors or by TFs associated with the differentiation of specific cell-fates. Nevertheless, additional ChIP-sequencing analysis using shU2AF1 cell lines associated to binding assays would help to understand the functional role of U2AF1 CCCH zinc finger domains in this transcriptional regulation. Indeed, biochemical data should decipher the direct regulatory function of U2AF1 via direct DNA motif binding, or indirect scaffolding at genomic regulatory regions. Indeed, preliminary analysis of open access U2AF1 ChIP-seq analysis performed in cancer cell lines (974 targets) and revealed putative interactions with regulatory elements of a small subset (5%) of differentially expressed genes upon U2AF1 downregulation. This result strengthens the idea of a direct transcriptional activity of U2AF1 via its zinc finger domains (CCCH Znf Domain). Beside the direct regulation, we need to consider the indirect impact of U2AF1 downregulation on transcription regulation since this downregulation shows the modulation of miRNAs such as let-7 c, Mir-34b/c, Mir-411 and Mir-296 (Fig. S5E and S5G) involved in cell fate determination and gene expression regulation. Understanding the ratio between direct/indirect transcriptional regulations upon U2AF1 downregulation will help us to decipher the multi-layered impact of U2AF1 during cell fate determination.
To decipher U2AF1 functional impact on pluripotency maintenance and differentiation initiation in vitro assays had to be settled. In accordance with these ideas, significant efforts were made to experimentally address these questions. Two main experiments have been explored to test our hypothesis regarding the link between U2AF1 CSF and cell fate determination. The first experiment was to expand U2AF1 downregulation to 10 days and monitor the expression of cell surface markers as well as differentiation and pluripotency master genes. The second experiment was to use in vitro differentiation protocols to differentiate both doxycycline activated shScramble and shU2AF1 hiPSCs lines into the three germ layers precursors and analyse the outcome in term of differentiation efficiency, which could tell us more about the functional importance of U2AF1 during early differentiation. However, major technical limits of stem cell culture and expansion did not allow us to perform the protocols and prevented the experiments from being successful. Indeed, hiPSCs have to be passaged every 5 days to avoid spontaneous differentiation due to the confluence. This passaging is also known to induce stress and spots of spontaneous differentiation as well. Therefore, we were not able to decipher the effects of a long-term downregulation of U2AF1 on stem cell differentiation from a stress-induced differentiation. The second experimental limit we faced is due to the strong efficiency of in vitro differentiation protocols. Indeed, these protocols use a great number of overwhelming growth factors, inhibitors and cell signalling regulators that forces stem cell to differentiate, which prevent us to discriminate U2AF1 downregulation dependent action on differentiation.
As far as, cell cycling, proliferation and apoptosis are concerned U2AF1 downregulation did not show a significant modulation upon doxycycline activation of the shU2AF1 proliferation rate and passaging time of the shU2AF1 hiPSCs was similar to the control condition (shScramble). However, when the downregulation reaches 95% colonies are confluent a bit later than the control (6 to 12 h) (Data not shown). Several previous discoveries have demonstrated that a relationship exists between altered CSFs structure and/or function and the establishment of cell-type-specific AS programs in cancer and developmental diseases. For example, in myeloid cell lines, the disruption of the U2 snRNP component SF3B1 deregulates AS events and leads to the impairment of erythroid differentiation [Citation18]. The mutation of U2AF1 occurs in patients with de novo myelodysplastic syndromes (MDSs) and influences the aberrant AS of haematopoietic progenitors [Citation53,Citation54]. However, it is still unclear how CSFs modulate AS programs and how these programs are integrated into the global regulation of physiological cell-fate determination.
In addition to shedding light on the role of U2AF1 in transcriptional regulation, our data also help for the first time to understand how the stoichiometry of the U2AF1 CSF coordinately controls the use of alternative splice sites in a context-dependent manner and how it synergistically modulates AS events in TFs to impact TFs roles during cell-fate determination. Indeed, our findings show that U2AF1 regulates the inclusion or exclusion of specific pre-mRNAs that encode the functional domains of TFs involved in cell-fate determination, such as PLAG1, TRIM6 or TAF1, and its down-regulation results in a switch between hiPSC and differentiated cell-specific isoforms of DNMT3B. Extensive efforts remain to be done to achieve high-throughput validation of AS impact on protein isoform expression.
Together, these findings indicate that cell-type-specific expression levels of U2AF1 influence the AS of downstream effectors in a level-dependent manner. In stem cells, high levels of U2AF1 expression help to maintain self-renewal and pluripotency, while reduced levels of U2AF1 expression during differentiation favours the commitment of stem cells to specific differentiation programs. In fact, U2AF1 downregulation at the level found in differentiated cell is a partial depletion but remains physiological as observed in the three germ layers. However, when we force the system and increase U2AF1 down-regulation up to 95%, which is a non-physiological downregulation (, bottom) we increase aberrant splicing including IR and the representation of splicing factors among the target genes (data not shown). The complexity and the interest of this topic increase wheatear we consider the simultaneous down regulation in hiPSCs of both CSFs that are downregulated in the three germ layers precursors. Therefore, our study opens the door to the understanding of the combinatorial effect of the modulation of CSFs stoichiometry.
Accession Numbers
The RNA-seq datasets generated and/or analyzed during the current study are available through https://www.ncbi.nlm.nih.gov/geo/query/acc.cgi?acc=GSE119700.
We analyzed the retrieved high-throughput RNA-seq open access data for hESCs and differentiated cell lines from GEO repositories (GSM1112847, GSM1112845, GSM1112846, GSM111284, GSM1112835, GSM1112833, GSM1112834, GSM1112837) included in this published article (Gifford et al., 2013).
Authors’ Contributions
A.M.L. L.L. and J.T. conceived the study with input from Y.B. and L.M., A.M.L. designed experiments, performed most wet-lab and hiPSCs maintenance and selection, interpreted the experiments and wrote the manuscript. L.L. transduced hiPSCs with inducible shRNAs and differentiated hiPSCs into the three germ layers precursors. Y.B. and L.M. performed computational analysis and analyzed RNA-sequencing data; Y.B. performed gene expression and ChIP-seq analysis and generated splicing clusters. L.M. performed splicing analysis and helped for EISA method. A.M.L. Y.B. and L.M. interpreted the outcome of the computational analysis prepared the figures. A.M.L analyzed the cell-type-specific alternative splicing program, performed MetaCoreTM analysis and applied EISA method. Y.B. L.M. and J.T. reviewed the manuscript. J.T. Funded and supervised the project.
Supplemental Material
Download Zip (43.7 MB)Acknowledgments
We thank M. Irimia and A. Gohr for technical assistance and computing resources. We thank S. Tuffery-Giraud and D. Lleres for critical comments on the manuscript. We thank A. Camasses, R. Ziane, D. Lleres, and A. Vautrin for technical assistance and helpful discussions. We thank Fasteris for the RNA-sequencing, the MRI FLOW CYTOMETRY platform and M. Boyer for cell sorting. We thank Nature Research Editing Service for reviewing the manuscript. This work has benefited from support by the Labex EpiGenMed, an « Investissements d’avenir » program, reference: ANR-10-LABX-12-01, to AML. This work was supported by the FRM Fondation pour la Recherche Médicale, reference: (FDT20160435249) to AML, and by the Region Languedoc Roussillon (Projet Graine) to JT.
Disclosure Statement
The authors declare that they have no competing interests or conflict of interest, financial or otherwise.
Data Availability
The RNA-seq datasets generated and/or analyzed during the current study are available through https://www.ncbi.nlm.nih.gov/geo/query/acc.cgi?acc=GSE119700.
Supplementary material
Supplemental data for this article can be accessed here.
Additional information
Funding
References
- Irimia M, Blencowe BJ. Alternative splicing: decoding an expansive regulatory layer. Curr Opin Cell Biol. 2012;24:323–332.
- Nilsen TW, Graveley BR. Expansion of the eukaryotic proteome by alternative splicing. Nature. 2010;463:457–463.
- Pan Q, Shai O, Lee LJ, et al. Deep surveying of alternative splicing complexity in the human transcriptome by high-throughput sequencing. Nat Genet. 2008;40:1413–1415.
- Gabut M, Samavarchi-Tehrani P, Wang X, et al. An alternative splicing switch regulates embryonic stem cell pluripotency and reprogramming. Cell. 2011;147:132–146.
- Wahl MC, Will CL, Lührmann R. The spliceosome: design principles of a dynamic RNP machine. Cell. 2009;136:701–718.
- Darnell RB. RNA protein interaction in neurons. Annu Rev Neurosci. 2013;36:243–270.
- Han H, Irimia M, Ross PJ, et al. MBNL proteins repress ES-cell-specific alternative splicing and reprogramming. Nature. 2013;498:241–245.
- Lu X, Göke J, Sachs F, et al. SON connects the splicing-regulatory network with pluripotency in human embryonic stem cells. Nat Cell Biol. 2013;15:1141–1152.
- Ye J, Beetz N, O’Keeffe S, et al. hnRNP U protein is required for normal pre-mRNA splicing and postnatal heart development and function. Proc Natl Acad Sci. 2015;112:E3020–9.
- Zhang X, Chen MH, Wu X, et al. Cell-type-specific alternative splicing governs cell fate in the developing cerebral cortex. Cell. 2016;166:1147–1162.e15.
- Park JW, Parisky K, Celotto AM, et al. Identification of alternative splicing regulators by RNA interference in Drosophila. Proc Natl Acad Sci U S A. 2004;101:15974–15979.
- Saltzman AL, Pan Q, Blencowe BJ. Regulation of alternative splicing by the core spliceosomal machinery. Genes Dev. 2011;25:373–384.
- Gabanella F, Butchbach MER, Saieva L, et al. Ribonucleoprotein assembly defects correlate with spinal muscular atrophy severity and preferentially affect a subset of spliceosomal snRNPs. PLoS One. 2007;2:e921. Valcarcel J, editor.
- Tanackovic G, Ransijn A, Thibault P, et al. PRPF mutations are associated with generalized defects in spliceosome formation and pre-mRNA splicing in patients with retinitis pigmentosa. Hum Mol Genet. 2011;20:2116–2130.
- Zhang Z, Lotti F, Dittmar K, et al. SMN deficiency causes tissue-specific perturbations in the repertoire of snRNAs and widespread defects in splicing. Cell. 2008;133:585–600.
- Geiger T, Velic A, Macek B, et al. Initial quantitative proteomic map of 28 mouse tissues using the SILAC mouse. Mol Cell Proteomics. 2013;12:1709–1722.
- Crews LA, Balaian L, Delos Santos NP, et al. RNA splicing modulation selectively impairs leukemia stem cell maintenance in secondary human AML. Cell Stem Cell. 2016;19:599–612.
- Dolatshad H, Pellagatti A, Fernandez-Mercado M, et al. Disruption of SF3B1 results in deregulated expression and splicing of key genes and pathways in myelodysplastic syndrome hematopoietic stem and progenitor cells. Leukemia. 2015;29:1092–1103.
- Shirai CL, Ley JN, White BS, et al. Mutant U2AF1 expression alters hematopoiesis and pre-mRNA splicing in vivo. Cancer Cell. 2015;27:631–643.
- Gifford CA, Ziller MJ, Gu H, et al. Transcriptional and epigenetic dynamics during specification of human embryonic stem cells. Cell. 2013;153:1149–1163.
- Dobin A, Davis CA, Schlesinger F, et al. STAR: ultrafast universal RNA-seq aligner. Bioinformatics. 2013;29:15–21.
- Trapnell C, Roberts A, Goff L, et al. Differential gene and transcript expression analysis of RNA-seq experiments with TopHat and Cufflinks. Nat Protoc. 2012;7:562–578.
- Ohta S, Nishida E, Yamanaka S, et al. Global splicing pattern reversion during somatic cell reprogramming. Cell Rep. 2013;5:357–366.
- Venables JP, Lapasset L, Gadea G, et al. MBNL1 and RBFOX2 cooperate to establish a splicing programme involved in pluripotent stem cell differentiation. Nat Commun [Internet]. 2013 [cited 2017 Oct 5];4. Available from: http://www.nature.com/doifinder/10.1038/ncomms3480
- Davidson KC, Adams AM, Goodson JM, et al. Wnt/-catenin signaling promotes differentiation, not self-renewal, of human embryonic stem cells and is repressed by Oct4. Proc Natl Acad Sci. 2012;109:4485–4490.
- Landeira D, Bagci H, Malinowski AR, et al. Jarid2 coordinates nanog expression and PCP/Wnt signaling required for efficient ESC differentiation and early embryo development. Cell Rep. 2015;12:573–586.
- Lanner F, Rossant J. The role of FGF/Erk signaling in pluripotent cells. Development. 2010;137:3351–3360.
- Vallier L, Reynolds D, Pedersen RA. Nodal inhibits differentiation of human embryonic stem cells along the neuroectodermal default pathway. Dev Biol. 2004;275:403–421.
- Cvoro A, Devito L, Milton FA, et al. A thyroid hormone receptor/KLF9 axis in human hepatocytes and pluripotent stem cells: TR/KLF9 crosstalk in stem cells. Stem Cells. 2015;33:416–428.
- Suico MA, Shuto T, Kai H. Roles and regulations of the ETS transcription factor ELF4/MEF. J Mol Cell Biol. [Internet]. 2016; [cited 2018 Sep 13]. Available from: https://academic.oup.com/jmcb/article-lookup/doi/10.1093/jmcb/mjw051
- Venere M, Han Y-G, Bell R, et al. Sox1 marks an activated neural stem/progenitor cell in the hippocampus. Development. 2012;139:3938–3949.
- von Maltzahn J, Jones AE, Parks RJ, et al. Pax7 is critical for the normal function of satellite cells in adult skeletal muscle. Proc Natl Acad Sci. 2013;110:16474–16479.
- Chen P-M, Lin C-H, Li N-T, et al. c-Maf regulates pluripotency genes, proliferation/self-renewal, and lineage commitment in ROS-mediated senescence of human mesenchymal stem cells. Oncotarget. 2015;6:35404.
- Knudsen KJ, Rehn M, Hasemann MS, et al. ERG promotes the maintenance of hematopoietic stem cells by restricting their differentiation. Cold Spring Harbor Laboratory Press. Genes Dev. 2015;29:1915–1929.
- Lujan E, Chanda S, Ahlenius H, et al. Direct conversion of mouse fibroblasts to self-renewing, tripotent neural precursor cells. Proc Natl Acad Sci. 2012;109:2527–2532.
- Gaidatzis D, Burger L, Florescu M, et al. Analysis of intronic and exonic reads in RNA-seq data characterizes transcriptional and post-transcriptional regulation. Nat Biotechnol. 2015;33:722–729.
- Gohr A, Irimia M, Valencia A. Matt: unix tools for alternative splicing analysis. Bioinformatics. 2019;35:130–132.
- Amit M, Donyo M, Hollander D, et al. Differential GC content between exons and introns establishes distinct strategies of splice-site recognition. Cell Rep. 2012;1:543–556.
- Irimia M, Weatheritt RJ, Ellis JD, et al. A highly conserved program of neuronal microexons is misregulated in autistic brains. Cell. 2014;159:1511–1523.
- Han H, Braunschweig U, Gonatopoulos-Pournatzis T, et al. Multilayered control of alternative splicing regulatory networks by transcription factors. Mol Cell. 2017;65:539–553.e7.
- Tapial J, Ha KCH, Sterne-Weiler T, et al. An atlas of alternative splicing profiles and functional associations reveals new regulatory programs and genes that simultaneously express multiple major isoforms. Genome Res. 2017;27:1759–1768.
- Pijnappel WWMP, Esch D, Baltissen MPA, et al. A central role for TFIID in the pluripotent transcription circuitry. Nature. 2013;495:516–519.
- Heuser M, Yap DB, Leung M, et al. Loss of MLL5 results in pleiotropic hematopoietic defects, reduced neutrophil immune function, and extreme sensitivity to DNA demethylation. Blood. 2009;113:1432–1443.
- Lindroos J, Husa J, Mitterer G, et al. Human but not mouse adipogenesis is critically dependent on LMO3. Cell Metab. 2013;18:62–74.
- Langmann T, Schumacher C, Morham SG, et al. ZNF202 is inversely regulated with its target genes ABCA1 and apoE during macrophage differentiation and foam cell formation. J Lipid Res. 2003;44:968–977.
- Zhang Z, Jones A, Sun C-W, et al. PRC2 complexes with JARID2, MTF2, and esPRC2p48 in ES cells to modulate ES cell pluripotency and somatic cell reprograming. Stem Cells. 2011;29:229–240.
- Belew MS, Bhatia S, Keyvani Chahi A, et al. PLAG1 and USF2 co-regulate expression of Musashi-2 in human hematopoietic stem and progenitor cells. Stem Cell Rep. 2018;10:1384–1397.
- Sato T, Okumura F, Ariga T, et al. TRIM6 interacts with Myc and maintains the pluripotency of mouse embryonic stem cells. J Cell Sci. 2012;125:1544–1555.
- Liao J, Karnik R, Gu H, et al. Targeted disruption of DNMT1, DNMT3A and DNMT3B in human embryonic stem cells. Nat Genet. 2015;47:469–478.
- Kelemen O, Convertini P, Zhang Z, et al. Function of alternative splicing. Gene. 2013;514:1–30.
- Braunschweig U, Gueroussov S, Plocik AM, et al. Dynamic integration of splicing within gene regulatory pathways. Cell. 2013;152:1252–1269.
- Herzel L, Ottoz DSM, Alpert T, et al. Splicing and transcription touch base: co-transcriptional spliceosome assembly and function. Nat Rev Mol Cell Biol. 2017;18:637–650.
- Graubert TA, Shen D, Ding L, et al. Recurrent mutations in the U2AF1 splicing factor in myelodysplastic syndromes. Nat Genet. 2011;44:53–57.
- Quidville V, Alsafadi S, Goubar A, et al. Targeting the deregulated spliceosome core machinery in cancer cells triggers mTOR blockade and autophagy. Cancer Res. 2013;73:2247–2258.