
 ?Mathematical formulae have been encoded as MathML and are displayed in this HTML version using MathJax in order to improve their display. Uncheck the box to turn MathJax off. This feature requires Javascript. Click on a formula to zoom.
ABSTRACT
Noncoding RNAs (ncRNAs) play critical roles in many critical biological processes and have become a novel class of potential targets and bio-markers for disease diagnosis, therapy, and prognosis. Annotating and analysing ncRNA-disease association data are essential but challenging. Current computational resources lack comprehensive database platforms to consistently interpret and prioritize ncRNA-disease association data for biomedical investigation and application. Here, we present the ncRPheno database platform (http://lilab2.sysu.edu.cn/ncrpheno), which comprehensively integrates and annotates ncRNA-disease association data and provides novel searches, visualizations, and utilities for association identification and validation. ncRPheno contains 482,751 non-redundant associations between 14,494 ncRNAs and 3,210 disease phenotypes across 11 species with supporting evidence in the literature. A scoring model was refined to prioritize the associations based on evidential metrics. Moreover, ncRPheno provides user-friendly web interfaces, novel visualizations, and programmatic access to enable easy exploration, analysis, and utilization of the association data. A case study through ncRPheno demonstrated a comprehensive landscape of ncRNAs dysregulation associated with 22 cancers and uncovered 821 cancer-associated common ncRNAs. As a unique database platform, ncRPheno outperforms the existing similar databases in terms of data coverage and utilities, and it will assist studies in encoding ncRNAs associated with phenotypes ranging from genetic disorders to complex diseases.
Abbreviations
APIs: application programming interfaces; circRNA: circular RNA; ECO: Evidence & Conclusion Ontology; EFO: Experimental Factor Ontology; FDR: false discovery rate; GO: Gene Ontology; GWAS: genome wide association studies; HPO: Human Phenotype Ontology; ICGC: International Cancer Genome Consortium; lncRNA: long noncoding RNA; miRNA: micro RNA; ncRNA: noncoding RNA; NGS: next generation sequencing; OMIM: Online Mendelian Inheritance in Man; piRNA: piwi-interacting RNA; snoRNA: small nucleolar RNA; TCGA: The Cancer Genome Atlas
Introduction
Noncoding RNAs (ncRNAs) play critical roles in many critical biological processes across species, and their dysregulation could be related to a broad spectrum of diseases [Citation1]. Based on their physical properties, biological functions, and cellular locations, ncRNAs can be grouped into five main categories, namely, long-noncoding RNA (lncRNA), micro-RNA (miRNA), circular RNA (circRNA), small nucleolar RNA (snoRNA), and piwi–interacting RNA (piRNA) [Citation2]. With the fast development and the broad applications of high-throughput technologies, the number of ncRNA-related publications in PubMed has unprecedentedly increased by about 20,000 publications annually over the past three years (). The majority of these publications have suggested associations between ncRNAs dysregulation and human diseases. Evidently, ncRNAs have become a novel class of bio-markers and potential drug targets for disease diagnosis, therapy, and prognosis [Citation2–Citation9].
Figure 1. The status of ncRNAs investigation and ncRNAs databases. (A) The increasing number of ncRNA-related publications over the past few decades. The numbers of ncRNA-related publications obtained from the PubMed database by searching the combined keywords ‘ncRNA OR noncoding RNA OR miRNA OR microRNA OR lncRNA OR long noncoding RNA OR lincRNA OR circRNA OR piRNA OR snoRNA OR ceRNA.’ (B) The development history of ncRNAs databases over time.
Due to the functional and clinical significance of ncRNAs, many public databases () have been established to annotate ncRNAs and collect various ncRNA-disease associations with biomedical information from peer-review publications, such as NONCODE [Citation10], RNAcentral [Citation11], miRbase [Citation12], lncRNADisease v2.0 [Citation13], miR2Disease [Citation14], circRNADisease [Citation15], NSDNA [Citation16], dbDEMC [Citation17], and OncomiRDB [Citation18]. In recent years, more publications have suggested that ncRNAs have complex interactions with a wide spectrum of exposures involved in human diseases, including complex diseases [Citation1]. Consequently, a number of databases have been developed to manually annotate ncRNA-disease association data with exposures from publications, such as SM2miR [Citation19], miREnvironment [Citation20], and DLREFD [Citation21]. With the development of next-generation sequencing (NGS) technologies, abundant variants in ncRNAs have been discovered in the studies of complex diseases. Several databases, such as lncRNASNP [Citation22], LincSNP 2.0 [Citation23], miRdSNP [Citation24], and miRNASNP [Citation25], focus on the disease/trait-related variants in human lncRNAs and miRNAs. In addition, some databases provide experimentally verified functional interactions between ncRNAs and their targets, including NPInter v3.0 [Citation26], miRSponge [Citation27], and LncReg databases [Citation28]. Chen et al. recently discussed the importance of ncRNAs to human diseases and reviewed the available databases and prediction models in detail for miRNA-disease and lncRNA-disease associations [Citation7,Citation8].
These computational resources are helpful for the studies in ncRNAs dysregulation of specific human diseases and their comorbidities, as well as for the discoveries of therapeutic actions and its adverse effects. However, several challenges remain and hinder the future integration and application of ncRNA-disease association data. First, different ontologies or terminologies are used to describe disease phenotypes and ncRNA symbols in different computational resources. The heterogeneous description hinders data integration, visualization, and application. Fortunately, several ontologies or terminologies have been established to annotate ncRNAs with controlled vocabularies, disease phenotypes, and their relationships, such as NONCODE [Citation10], RNAcentral [Citation11], miRbase [Citation12], and Experimental Factor Ontology (EFO) [Citation29]. Second, how to derive new ncRNA-disease associations from known associations based on limited available information is another challenge. Third, current computational resources lack scoring models to prioritize and interpret ncRNA-disease associations based on the available evidence, such as the strength of experimental data in publications, and the parent-child relationships of disease phenotypes and their properties. Therefore, computational resources consistently integrating and homogeneously annotating ncRNA-disease association data are essential for the identification and validation of disease-related ncRNAs.
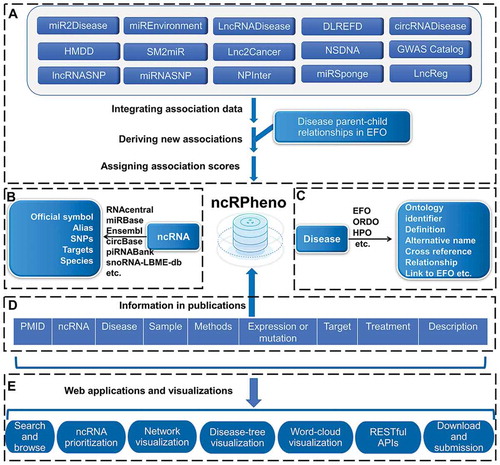
To tackle these challenges, we developed the ncRPheno database platform, which comprehensively integrates and annotates ncRNA-disease association data, and web applications to visualize and analyse the association data (). ncRPheno has not only retrieved and integrated fundamental data from 15 ncRNA-disease association databases and nine terminological databases [Citation11–Citation16,Citation19-Citation22,Citation25–Citation38] but also derived new associations from known associations using the disease parent-child relationships. A scoring model has been refined based on evidential metrics and integrated into ncRPheno to prioritize the RNA-disease associations. ncRPheno provides user-friendly web interfaces and novel visualizations to enable an easy exploration and application of the ncRNA-disease association data. As a case study, we investigated the landscape of ncRNAs dysregulation associated with different cancer types through ncRPheno and uncovered 821 common ncRNAs dysregulation in 22 types of cancer.
Figure 2. The data integration and annotation framework of ncRPheno and the web applications in ncRPheno. (A) Integrating ncRNA-disease association data and deriving new associations. (B) Data resources for ncRNA annotation. (C) EFO and other ontologies for disease annotation. (D) The key evidential and biological information in publications supporting ncRNA-disease associations. (E) The web applications and visualizations based on the data in ncRPheno.
Results
Data content
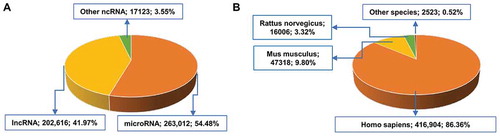
The ncRPheno database contains 482,751 non-redundant associations between 14,494 ncRNAs and 3,210 disease phenotypes across 11 species (). We integrated 50,681 of the associations from manually curated databases, and 432,070 were newly derived based on the disease parent-child relationships in EFO. For the ncRNA distribution, ncRPheno contains 2,984 miRNAs, 10,547 lncRNAs, 848 circRNAs, 107 piRNAs, and 13 snoRNAs (). Of the 482,751 associations, approximately 54.48% and 41.97% associations are related to miRNAs and lncRNAs, respectively (), and approximately 86.36%, 9.80%, and 3.32% are related to Homo sapiens, Mus musculus, and Rattus norvegicus, respectively (). ncRPheno covers the majority of disease subtypes, such as neoplasm, genetic disease, nervous system disease, abnormality of phenotype, and cardiovascular disease. In addition, ncRPheno provides extra 4,077 disease-related SNPs, including 2,002 GWAS Tag-SNPs mapped to 1,771 lncRNAs and 2,075 SNPs mapped to 1,034 miRNAs (). Moreover, 1,801 ncRNAs in ncRPheno were annotated with one or more experimentally verified targets ().
Table 1. Database contents and features of ncRPheno compared with the MNDR database.
Figure 3. The data distribution in ncRPheno. (A) The distribution of ncRNA-disease associations across different classes of ncRNAs. The ‘Others’ ncRNAs include circRNA (15,257 associations; 3.16%), piRNA (1282; 0.27%), and snoRNA (584; 0.09%). (B) The distribution of ncRNA-disease associations across species. The ‘Others’ species include Macaca mulatta (739 associations; 0.15%), Sus scrofa (715; 0.15%), Pan troglodytes (654; 0.14%), Callithrix jacchu (180; 0.037%), Gallus gallus (150; 0.031%), Canis familiaris (45; 0.009%), Danio rerio (28; 0.006%), and Oryctolagus cuniculus (12; 0.002%).
Web applications
A previous user experience survey [Citation39] has shown that most biomedical scientists and researchers are primarily interested in the answers of two critical questions by searching association data. (1) Starting from an interesting ncRNA (e.g., HOTAIR), which diseases are associated with the ncRNA? (2) Starting from an interesting disease (e.g., breast cancer), which ncRNAs are associated with this disease? To answer these questions, ncRPheno offers user-friendly web interfaces, novel visualizations, and RESTful APIs to enable users to search, browse, prioritize, and analyse the association data, as well as to download and submit new associations for further integration.
Browse, search, and visualization
The ‘Browse’ webpage allows users to browse interesting ncRNAs and disease phenotypes easily. By clicking on a particular node, the corresponding association data can be displayed. The ‘Search’ webpages allow users to quickly retrieve ncRNA-disease associations through searching the ncRNA name or the disease phenotype. The search function allows users to filter associations by selecting criteria and facilitates smart assistance with keyword tips of expected ncRNAs or disease phenotypes. The resulting association data are displayed in a brief table, showing essential information, including association identifiers (IDs), ncRNA symbols, disease phenotypes with ontology identifiers, and association scores for prioritization (). The resulting association data of a disease search allow visualizing the data in a word-cloud diagram (). Similarly, the resulting association data of a ncRNA search can be visualized in disease-tree and disease-network diagrams (, B). The association IDs in the table (), the ncRNA symbols in the word-cloud diagram (), and the circle nodes in the disease-tree diagram () link further information to the ncRNA, the disease phenotype, and the supporting evidence in publications (). External links to other reference resources are also provided, such as PubMed, miRBase, Ensembl, and EFO.
Figure 4. The web interface of browse and search applications. (A) A table indicates the prioritized disease phenotypes associated with hsa-mir-103b. (B) A word-cloud diagram shows the prioritized ncRNAs associated with the disease phenotype. Larger sizes and more central locations of the ncRNAs indicate a higher association score between the ncRNA and the disease phenotype.
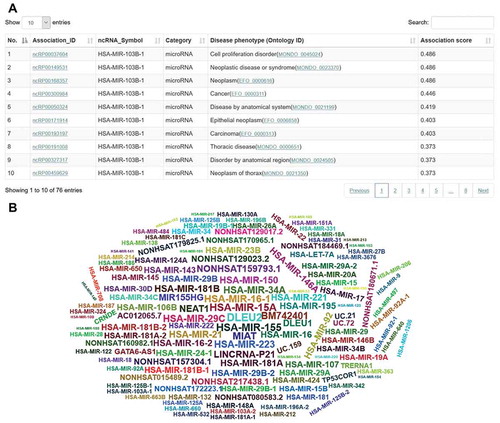
Figure 5. The visualizations of disease tree (A) and disease network (B) for the hsa-mir-103b dysregulation associated with disease phenotypes. The values by the lines are the association scores between the ncRNA and the disease phenotypes.
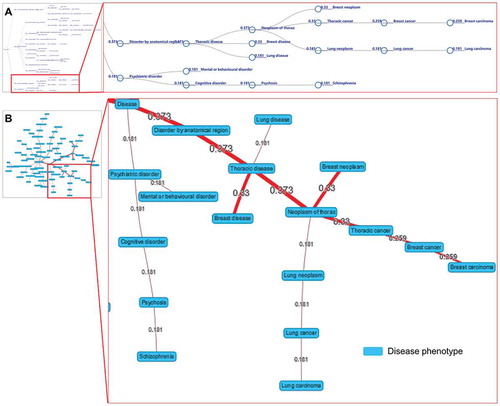
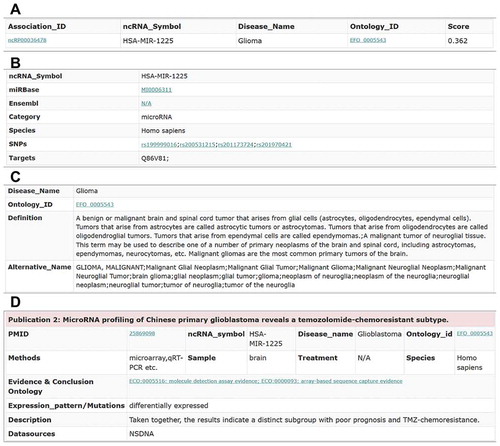
Figure 6. The association information of the ncRNA hsa-mir-1225 and the glioma disease. (A) The key information of the hsa-mir-1225-glioma association. (B) The information of the hsa-mir-1225 ncRNA. (C) The information of the glioma disease. (D) The supporting evidence in the publications for the hsa-mir-1225-glioma association.
ncRNA prioritization on disease-related RNA sequencing datasets
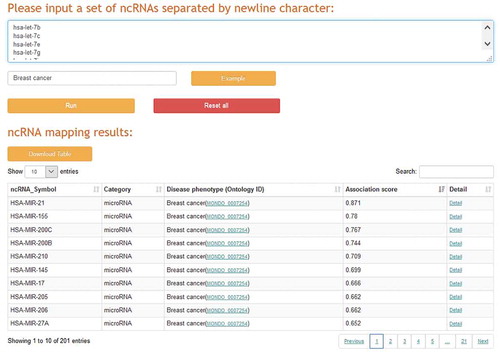
A typical case-control RNA sequencing analysis can find thousands of significant RNA dysregulations, many of which are ncRNA-related, but identifying their clinical significance remains challenging. For example, we analysed the miRNA-seq quantification data of breast cancer samples from The Cancer Genome Atlas (TCGA) [Citation40] and found that 553 miRNAs are significantly dysregulated between 768 cases of breast cancer and 97 controls. However, how to promptly identify and prioritize the experimentally validated breast cancer-associated miRNAs from these large-scale miRNAs is not a trivial task. To deal with this problem, a ncRNA prioritization application was implemented in ncRPheno to identify and prioritize a set of ncRNAs to a corresponding disease phenotype (). We input the 553 miRNAs with the phenotype of breast cancer in the ncRNA prioritization application. The application completed the analysis in a few minutes and output 201 miRNAs that are experimentally validated to associate with breast cancer. The resulting top five miRNAs are hsa-mir-21, hsa-mir-155, hsa-mir-200 c, hsa-mir-200b, and hsa-mir-210 (). The result table also allows data sorting by association scores and data filtering by specific ncRNA (), and it provides links to further webpages for detailed information (). In addition, the ncRNA prioritization application allows users to input one ncRNA and one disease phenotype for data retrieval at the same time to determine whether there is an association between them.
Figure 7. The web interface of the ncRNA prioritization application.
Network visualization to explore relationships between different diseases and ncRNAs
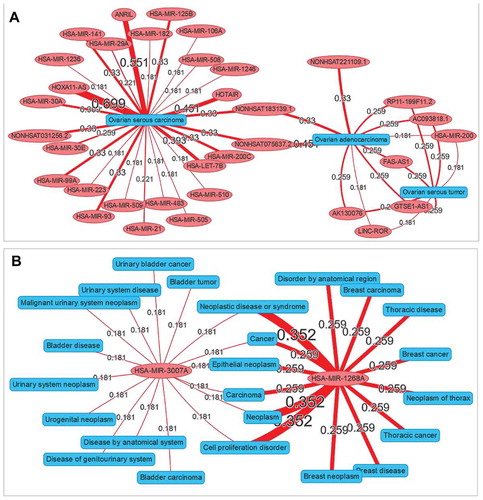
A network visualization application was implemented in ncRPheno for the relationship exploration between different diseases and ncRNAs. The application allows users to enter a set of diseases or ncRNAs and generate an interaction network to display the association data. For example, we entered the diseases ‘ovarian serous carcinoma,ovarian adenocarcinoma,ovarian serous tumor’ in the input box and generated an interaction network for the different subtypes of ovarian cancer with ncRNAs (). The resulting network indicates that seven ncRNAs are associated with both ovarian serous tumour and ovarian adenocarcinoma and two ncRNAs associated with both ovarian adenocarcinoma and ovarian serous carcinoma. Interestingly, no ncRNA is associated with both ovarian serous tumour and ovarian serous carcinoma. Similarly, we also entered the ncRNAs ‘hsa-mir-3007a, hsa-mir-1268a’ to generate an interaction network for the different ncRNAs with disease phenotypes. The resulting network clearly shows that hsa-mir-3007a and hsa-mir-1268a are both associated with neoplasm (). Interestingly, hsa-mir-3007a is associated with bladder carcinoma, while hsa-mir-1268a is specifically associated with breast carcinoma ().
Figure 8. The interaction network visualization. (A) An interaction network to explore the relationships among different subtypes of ovarian cancer and ncRNAs. (B) An interaction network to explore the relationships among different ncRNAs (hsa-mir-3007a and hsa-mir-1268a) and disease phenotypes. The values by the lines are the association scores between the ncRNAs and the disease phenotypes.
Web services
The ncRPheno website offers the RESTful application programming interfaces (APIs) to access the data programmatically. All resources are accessible through simple RESTful URLs by querying and retrieving an individual entry as well as sets of entries. Output data are available in universal JSON and text formats. Documentation of APIs is available online. All the association data in ncRPheno can be freely downloaded. In addition, ncRPheno encourages users to submit their new association data for future data integration. Once checked by our professional curators and approved by the submission review committee, the submitted records will be included in a future release. Furthermore, a detailed tutorial is available on the help webpage.
Case study: the landscape of ncRNAs dysregulation in 22 cancer types
The association data in ncRPheno are an invaluable resource that can be used to investigate the features of ncRNAs for molecular typing in diseases. In ncRPheno, 61.1% of ncRNAs are associated with neoplasm. Due to the critical role and heterogenicity of ncRNAs dysregulation in different cancer types, we investigated the differences and commonalities of the ncRNAs dysregulation profile among 22 common cancer types [Citation41] to discover the potential common ncRNA bio-markers. The investigation found that many ncRNA dysregulations are associated with cancers, with numbers ranging from 23 to 4,830. The numbers of common ncRNAs of each pair of cancer types range from 1 to 267 (Supplementary Figure 1). The common ncRNAs of each pair of cancer types are listed in Supplementary Table 1.
In addition, we found that 821 ncRNAs are dysregulated in one or more cancer types (Supplementary Table 2). Based on the patterns of 821 ncRNAs dysregulation status, the 22 cancer types are classified into four groups () by Euclidean distance-based hierarchical clustering using the heatmap package in R-project (http://www.r-project.org/). Here, the status of a ncRNA dysregulation means that the ncRNA dysregulation associated with cancer either has supporting publications (Yes) or not (No) in ncRPheno. In , astrocytoma and medulloblastoma as nervous system neoplasms are classified into Group 1 since sharing many same ncRNAs. Breast carcinoma and lung carcinoma are classified into Group 2 due to their highly similar patterns of ncRNA dysregulation status. For the same reason, hepatocellular carcinoma, leukaemia, and prostate carcinoma are classified into Group 4. It is not surprising that gastric carcinoma and colon carcinoma belong to the same group (Group 3); however, it was interesting to find that melanoma and colon carcinoma have a very similar pattern of ncRNA dysregulation. These patterns of ncRNAs dysregulation status provide new clues for molecular typing in cancers, and further investigation on these ncRNAs might guide future cancer diagnosis, therapy, and prognosis.
Figure 9. The landscape of ncRNAs dysregulation profile in 22 cancer types. (A) The hierarchical clustering heatmap classifies the 22 cancer types into four groups by using the 821 ncRNAs dysregulation status (Yes or No) profiles. (B) The top 30 common biological processes of the 77 ncRNAs dysregulation involved in cancer development.
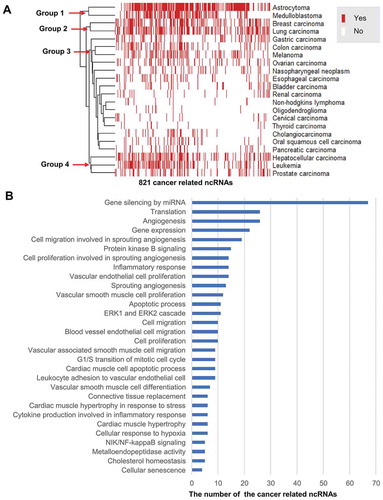
We further discovered 14 ncRNAs that are commonly dysregulated in more than 14 of 22 (63.6%) cancer types, including hsa-mir-21, HOTAIR, hsa-mir-126, and H19 (Supplementary Table 2). Furthermore, 77 ncRNAs, including 65 miRNAs and 12 lncRNAs, are commonly associated with more than 50% (11 of 22) cancer types (Supplementary Table 2). To discover common mechanisms of the ncRNAs involved in the development of cancers, we annotated these 77 ncRNAs with biological processes using Gene Ontology (GO) [Citation42]. In line with previous studies [Citation43], our results suggested that these ncRNAs majorly involve in biological processes of angiogenesis, inflammatory response, cell migration, cell proliferation, apoptosis, gene silencing, and translation regulation ( and Supplementary Table 3). Indeed, the biological processes for the ncRNAs were frequently reported in cancer development [Citation43]. These ncRNAs may become potential bio-markers to guide drug design, disease diagnosis, and therapies.
Discussion and conclusion
ncRNAs have become a novel class of potential targets and bio-markers for disease diagnosis, therapy, and prognosis [Citation2–Citation6]. In this study, we developed the ncRPheno database platform, aiming to provide comprehensive and up-to-date data of ncRNA dysregulation associated with disease phenotypes. The ncRPheno database consistently integrates and annotates ncRNA-disease associations from 24 curated databases and derives new associations from known associations. Compared with other similar platforms, such as Open Targets Platform [Citation39], DisGeNET [Citation44], Monarch Initiative [Citation45], and MalaCards [Citation46], which cover coding genes and regulatory regions, ncRPheno focuses on ncRNAs dysregulation associated with disease phenotypes. ncRPheno outperforms other similar ncRNA-related databases, such as MNDR (), HMDD v3.0, and lncRNADisease v2.0 (Supplementary Table 4), in both data coverage and web application features.
In terms of the comprehensive integration of ncRNA-disease associations from various data sources, MNDR [Citation47] is the resource most similar to our ncRPheno database platform. However, as a comprehensive data resource, ncRPheno contains more data content, including ncRNA-disease associations with experimental factors from SM2miR [Citation19], miREnvironment [Citation20], and DLREFD [Citation21]. These additional data cover the effects of environmental factors on human health, cicrRNA-disease associations from circRNADisease [Citation15], and the complex disorders/trait-lncRNA associations from the GWAS Catalogue [Citation32]. Like the Open Target Platform [Citation39], ncRPheno derives new associations using disease parent-child relationships in EFO that may not have direct supporting publications [Citation29]. In short, the numbers of associations, ncRNAs, disease phenotypes, and publications included in ncRPheno are approximately 9.34-, 1.30-, 3.49-, and 2.22-fold of those in MNDR, respectively [Citation47]. Moreover, ncRPheno contains extra 4,077 disease-related SNPs, including 2,002 GWAS Tag-SNPs mapped to 1,771 lncRNAs and 2,075 SNPs mapped to 1,034 miRNAs. In ncRPheno, 1,801 of ncRNAs are annotated with one or more experimentally verified targets (). Furthermore, ncRPheno offers web applications for further analysis and visualization of the association data, including the prioritization of associations and the visualizations of network, disease-tree, and word-cloud. The comparison of data content and features between ncRPheno and MNDR is detailed in .
The current ncRPheno database includes ncRNA-disease associations with supporting evidence from publications. The resulting associations with high-confidence missed out some of the potential and essential associations. In the future, we will improve the database to provide additional data by enriching new association data through manually curated associations from new peer-review publications, analysing multi-omic data in TCGA [Citation40] and ICGC [Citation48], and integrating more computational prediction models and tools [Citation49–Citation55]. For example, IMCMDA [Citation53] predicts missing miRNA-disease associations based on the known associations and the miRNA similarity and disease similarity. MDHGI [Citation54] discovers new miRNA-disease associations by integrating the predicted association probability from matrix decomposition. EDTMDA [Citation55] offers a computational framework integrating ensemble learning and dimensionality reduction for miRNA-disease association prediction. Furthermore, LncDisease [Citation49] predicts the lncRNA-disease associations based on the crosstalk between lncRNAs and miRNAs, and MFLDA [Citation56] identifies lncRNA-disease associations through Matrix Factorization.
To serve the research communities, we will update the database every six months and constantly improve it with more features and functionalities. In September 2019, the ncRPheno platform was updated from version 1.0 to version 2.0. Compared to version 1.0, the number of associations in version 2.0 increased more than four times (a 4.64-fold difference). Version 2.0 contains the recently updated data from HMDD v3.0, lnc2 Cancer v2.0, and lncRNADisease v2.0, and derived associations based on the parent-child relationships of disease phenotypes in EFO. Moreover, version 2.0 offers additional web applications for further analysis and visualization of the association data.
In conclusion, ncRPheno comprehensively integrates and annotates ncRNA-disease association data for the identification and validation of disease-related ncRNAs. Its web applications offer advanced search capabilities and novel visualizations to enable easy exploration, analysis, and utilization of the association data, as well as web service APIs for programmatic data access. A case study through ncRPheno demonstrated a comprehensive landscape of ncRNAs dysregulation associated with 22 cancers and uncovered 821 cancer-associated common ncRNAs. Further investigation on these interesting ncRNAs for molecular typing in cancers might guide drug design, cancer diagnosis, and therapies. As a unique database platform, ncRPheno outperforms the existing similar databases and platforms in terms of data coverage and utilities, and will assist studies in encoding ncRNAs associated with phenotypes ranging from genetic disorders to complex diseases.
Materials and methods
Data integration and annotation
The ncRPheno database integrated association data from 15 ncRNA-disease association databases and nine terminological databases [Citation11–Citation16,Citation19-Citation22,Citation25–Citation38] (). Since different databases employ different ontologies or terminologies to describe the same ncRNAs and diseases, consistent annotation for ncRNAs and diseases is greatly needed. Therefore, several controlled terminologies and ontologies were used to homogenize the information of ncRNAs and diseases in ncRPheno. For the ncRNA homogenous annotation, six types of ncRNA symbols were used (): (I) the lncRNA identifiers were annotated with Ensembl [Citation33] and RNAcentral [Citation11]; (II) the miRNA identifiers were annotated with miRBase [Citation12]; (III) the circRNA identifiers were annotated with circBase [Citation35]; (IV) the piRNA identifiers were annotated with piRNABank [Citation34]; and (V) the snoRNA identifiers were annotated with RNAcentral [Citation11] and snoRNA-LBME-db [Citation36]. The information of ncRNAs such as disease-related SNPs and experimentally verified ncRNA targets was included to annotate the ncRNAs () homogenously. The data sources of lncRNASNP2 [Citation22], miRNASNP [Citation25], and GWAS Catalogue [Citation32] were included in a pipeline to assign disease-related SNPs to ncRNAs systematically. The data of NPInter [Citation26], miRSponge [Citation27], and LncReg [Citation28] were used to assign experimentally verified targets to the ncRNAs systematically. For homogenous disease annotation, EFO [Citation29] was adopted to consistently describe diseases, phenotypes, and trait terms (). The annotation includes disease parent-child relationships, EFO IDs, definitions, synonyms, cross-references from OMIM [Citation57], disease ontology [Citation58], Orphanet Rare Disease Ontology [Citation37], Human Phenotype Ontology (HPO) [Citation59], and MeSH [Citation60].
Deriving new ncRNA-disease associations
ncRPheno leveraged the EFO data [Citation29] to interpret disease parent-child relationships and propagate ncRNA-disease associations with supporting publications along with parent nodes (). For example, both small cell lung carcinoma and non-small cell lung carcinoma are lung carcinoma. The direct evidence of ncRNAs associated with small cell lung carcinoma and non-small cell lung carcinoma was propagated to lung carcinoma to allow users to find common ncRNAs across a group of related diseases. Other ncRNA-disease associations were also derived based on the EFO’s inferred-by-property classification: disease location (e.g., lung, brain, and liver), disease cell lines (e.g., lung cancer cell lines), and disease phenotypes (e.g., intestinal polyposis in Lynch syndrome). These properties enable deriving and propagating new ncRNA-disease associations.
Construction of association scoring model
The experimental evidence in the literature, such as experiment methods, number of publications, and disease parent-child relationships, was included to support the associations. An association scoring model () was refined based on the evidential metrics according to the existing methods used in Open Targets [Citation39] and DisGeNET [Citation44]. The resulting scores in ncRPheno can be used to prioritize and interpret the ncRNA dysregulation-disease associations. The association scoring model consists of four steps to compute the association scores.
Step 1: The experiment methods indicated in publications were manually annotated with the categories of Evidence & Conclusion Ontology (ECO) [Citation38] and then classified into different evidential levels, including high-throughput expression level, low-throughput expression level, function and mechanism analysis level, and in vivo analysis level ( and Supplementary Table 5). Each evidential level was given with an experiment score (Ee) according to their reliability. In principle, experiment methods for in vivo analyses, mechanisms, and functional analyses provide more reliable evidence than RNA expression experiments. Therefore, different methods in publications are empirically defined as detailed in and Supplementary Table 5. The evidential value (Ep) of a supporting publication for a ncRNA-disease association is summed up with experiment scores (Ee) as the following Equationequation (1)(1)
(1) :
Table 2. The classification of validated methods in publications and the score assignment according to ECO.
In EquationEquation (1)(1)
(1) , ‘n’ represents the total number of supporting experiment methods in the publication, and Eei is the experiment score for a supporting experiment method ‘i’ in the publication.
Step 2: A larger number of publications can enhance the evidential values for the same ncRNA-disease association. The evidential value (E) of an association with multiple supporting publications is derived using a harmonic sum function [Citation39,Citation61] to account for replication but also to dampen the effect of a large number of publications, as calculated in the following equation:
In EquationEquation (2)(2)
(2) , ‘m’ represents the total number of supporting publications, and Ep1, Ep2, Ep3, …, Epm are the sorted evidential values of different supporting publications in descending order.
Step 3: Only the disease subclasses with direct supporting publications can propagate the evidence along with the parental nodes. For example, in the EFO database, ‘non-small cell lung adenocarcinoma’ is a subtype of ‘non-small cell lung carcinoma,’ which is a subtype of ‘lung carcinoma.’ When ‘non-small cell lung adenocarcinoma’ and ‘non-small cell lung carcinoma’ have directly supporting evidence from publications, both pieces of evidence can be propagated to ‘lung carcinoma.’ Similarly, other evidence information can be derived based on the EFO data. Therefore, taking into consideration all inferred evidence of EFO parent-child relationships and properties, a final evidential value (F) is computed using a harmonic sum function [Citation39,Citation61] to account for replication but also to dampen the effect of a large number of inferred evidence:
In EquationEquation (3)(3)
(3) , ‘j’ represents the number of all the disease subclasses and itself, and E1, E2, E3, …, Ej are the sorted evidential values of disease subclasses and itself in descending order.
Step 4: The final evidential value (F) above is normalized to limit the range of final association scores (Score) from 0 to 1.0:
In EquationEquation (4)(4)
(4) , ‘e’ represents the natural constant e.
miRNA different expression analysis
We downloaded the miRNA-seq quantification data of breast cancer samples from TCGA [Citation40] data portal (https://portal.gdc.cancer.gov/) (December 2017). The number of samples included 768 cases and 97 controls. Read counts in miRNA-seq quantification data were used to represent the miRNA expression levels. The DESeq2 package [Citation62] in R (http://www.r-project.org/) was used to analyse miRNAs whose mean expression level is significantly different between cases and controls (FDR adjusted p-value < 0.05 and fold changes > 2).
Data storage and web implementation
All the ncRNA-disease association data in ncRPheno were stored and organized in a MySQL database. The ncRPheno web platform was built with the technologies of Spring MVC, Mybatis, and jQuery AJAX framework, and deployed into an Apache Tomcat web server. The programmes for data processing were written in Java. The web interface was built using HTML5, CSS3, and JavaScript. The JqTree (http://mbraak.github.io/jqTree/) as a jQuery widget was used to display a tree structure in the webpages. The vis.js library (http://www.visjs.org) as a jQuery widget was implemented to display the networks on the webpages. The D3.js widget (http://d3js.org/d3.v3.min.js) was used to implement disease-tree visualization.
Supplemental Material
Download MS Word (11.5 KB)Acknowledgments
Many thanks to Prof Erwei Song, Huan Yang at the Zhongshan school of Medicine of Sun Yat-sen University for their helpful suggestions. Many thanks to Zhiqiang Lei and Yuanshuai Deng at the School of Data and Computer Science of Sun Yat-sen University for their technical help. Many thanks to Jing Mo at the International College of Hunan University of Arts and Science for her technical help.
Disclosure Statement
No potential conflict of interest was reported by the authors.
Supplementary Data
The supplementary data for this article can be accessed here.
Additional information
Funding
References
- Zhang W, Zhang H, Yang H, et al. Computational resources associating diseases with genotypes, phenotypes and exposures. Brief Bioinform. 2019;20(6):2098–2115.
- Matsui M, Corey DR. Non-coding RNAs as drug targets. Nat Rev Drug Discov. 2017;16:167–179.
- Klingenberg M, Matsuda A, Diederichs S, et al. Non-coding RNA in hepatocellular carcinoma: mechanisms, biomarkers and therapeutic targets. J Hepatol. 2017;67:603–618.
- Adams BD, Parsons C, Walker L, et al. Targeting noncoding RNAs in disease. J Clin Invest. 2017;127:761–771.
- Henique C, Bollee G, Loyer X, et al. Genetic and pharmacological inhibition of microRNA-92a maintains podocyte cell cycle quiescence and limits crescentic glomerulonephritis. Nat Commun. 2017;8:1829.
- Ali MM, Akhade VS, Kosalai ST, et al. PAN-cancer analysis of S-phase enriched lncRNAs identifies oncogenic drivers and biomarkers. Nat Commun. 2018;9:883.
- Chen X, Xie D, Zhao Q, et al. MicroRNAs and complex diseases: from experimental results to computational models. Brief Bioinform. 2019;20:515–539.
- Chen X, Yan CC, Zhang X, et al. Long non-coding RNAs and complex diseases: from experimental results to computational models. Brief Bioinform. 2017;18:558–576.
- Chen X, Guan NN, Sun YZ, et al. MicroRNA-small molecule association identification: from experimental results to computational models. Brief Bioinform. 2020;21:47–61.
- Zhao Y, Li H, Fang S, et al. NONCODE 2016: an informative and valuable data source of long non-coding RNAs. Nucleic Acids Res. 2016;44:D203–D208.
- The RNAcentral Consortium. RNAcentral: a hub of information for non-coding RNA sequences. Nucleic Acids Res. 2019;47:D221–D229.
- Kozomara A, Birgaoanu M, Griffiths-Jones S. miRBase: from microRNA sequences to function. Nucleic Acids Res. 2019;47:D155–D162.
- Bao Z, Yang Z, Huang Z, et al. LncRNADisease 2.0: an updated database of long non-coding RNA-associated diseases. Nucleic Acids Res. 2019;47:D1034–D1037.
- Jiang Q, Wang Y, Hao Y, et al. miR2Disease: a manually curated database for microRNA deregulation in human disease. Nucleic Acids Res. 2009;37:D98–D104.
- Zhao Z, Wang K, Wu F, et al. circRNA disease: a manually curated database of experimentally supported circRNA-disease associations. Cell Death Dis. 2018;9:475.
- Wang J, Cao Y, Zhang H, et al. NSDNA: a manually curated database of experimentally supported ncRNAs associated with nervous system diseases. Nucleic Acids Res. 2017;45:D902–D907.
- Yang Z, Wu L, Wang A, et al. dbDEMC 2.0: updated database of differentially expressed miRNAs in human cancers. Nucleic Acids Res. 2017;45:D812–D818.
- Wang D, Gu J, Wang T, et al. OncomiRDB: a database for the experimentally verified oncogenic and tumor-suppressive microRNAs. Bioinformatics. 2014;30:2237–2238.
- Liu X, Wang S, Meng F, et al. SM2miR: a database of the experimentally validated small molecules’ effects on microRNA expression. Bioinformatics. 2013;29:409–411.
- Yang Q, Qiu C, Yang J, et al. miREnvironment database: providing a bridge for microRNAs, environmental factors and phenotypes. Bioinformatics. 2011;27:3329–3330.
- Sun YZ, Zhang DH, Ming Z, et al. DLREFD: a database providing associations of long non-coding RNAs, environmental factors and phenotypes. Database (Oxford); 2017.;2017:bax084
- Miao YR, Liu W, Zhang Q, et al. lncRNASNP2: an updated database of functional SNPs and mutations in human and mouse lncRNAs. Nucleic Acids Res. 2018;46:D276–D280.
- Ning S, Yue M, Wang P, et al. LincSNP 2.0: an updated database for linking disease-associated SNPs to human long non-coding RNAs and their TFBSs. Nucleic Acids Res. 2017;45:D74–D78.
- Bruno AE, Li L, Kalabus JL, et al. miRdSNP: a database of disease-associated SNPs and microRNA target sites on 3ʹUTRs of human genes. BMC Genomics. 2012;13:44.
- Gong J, Liu C, Liu W, et al. An update of miRNASNP database for better SNP selection by GWAS data, miRNA expression and online tools. Database (Oxford); 2015;2015:bav029.
- Hao Y, Wu W, Li H, et al. NPInter v3.0: an upgraded database of noncoding RNA-associated interactions. Database (Oxford); 2016;2016:baw057.
- Wang P, Zhi H, Zhang Y, et al. miRSponge: a manually curated database for experimentally supported miRNA sponges and ceRNAs. Database (Oxford); 2015;2015:bav098.
- Zhou Z, Shen Y, Khan MR, et al. LncReg: a reference resource for lncRNA-associated regulatory networks. Database (Oxford); 2015;2015:bav083.
- Malone J, Holloway E, Adamusiak T, et al. Modeling sample variables with an experimental factor ontology. Bioinformatics. 2010;26:1112–1118.
- Huang Z, Shi J, Gao Y, et al. HMDD v3.0: a database for experimentally supported human microRNA-disease associations. Nucleic Acids Res. 2019;47:D1013–D1017.
- Gao Y, Wang P, Wang Y, et al. Lnc2Cancer v2.0: updated database of experimentally supported long non-coding RNAs in human cancers. Nucleic Acids Res. 2019;47:D1028–D1033.
- MacArthur J, Bowler E, Cerezo M, et al. The new NHGRI-EBI Catalog of published genome-wide association studies (GWAS Catalog). Nucleic Acids Res. 2017;45:D896–D901.
- Zerbino DR, Achuthan P, Akanni W, et al. Ensembl 2018. Nucleic Acids Res. 2018;46:D754–D761.
- Sai LS, Agrawal S. piRNABank: a web resource on classified and clustered Piwi-interacting RNAs. Nucleic Acids Res. 2008;36:D173–D177.
- Glazar P, Papavasileiou P, Rajewsky N. circBase: a database for circular RNAs. Rna. 2014;20:1666–1670.
- Lestrade L, Weber MJ. snoRNA-LBME-db, a comprehensive database of human H/ACA and C/D box snoRNAs. Nucleic Acids Res. 2006;34:D158–D162.
- Pavan S, Rommel K, Mateo MM, et al. Clinical practice guidelines for rare diseases: the orphanet database. PLoS One. 2017;12:e170365.
- Giglio M, Tauber R, Nadendla S, et al. ECO, the evidence & conclusion ontology: community standard for evidence information. Nucleic Acids Res. 2019;47:D1186–D1194.
- Koscielny G, An P, Carvalho-Silva D, et al. Open targets: a platform for therapeutic target identification and validation. Nucleic Acids Res. 2017;45:D985–D994.
- Weinstein JN, Collisson EA, Mills GB, et al. The cancer genome atlas pan-cancer analysis project. Nat Genet. 2013;45:1113–1120.
- Bray F, Ferlay J, Soerjomataram I, et al. Global cancer statistics 2018: GLOBOCAN estimates of incidence and mortality worldwide for 36 cancers in 185 countries, CA. Cancer J Clin. 2018;68:394–424.
- Gene Ontology Consortium. Gene ontology consortium: going forward. Nucleic Acids Res. 2015;43:D1049–D1056.
- Hanahan D, Weinberg RA. Hallmarks of cancer: the next generation. Cell. 2011;144:646–674.
- Pinero J, Bravo A, Queralt-Rosinach N, et al. DisGeNET: a comprehensive platform integrating information on human disease-associated genes and variants. Nucleic Acids Res. 2017;45:D833–D839.
- Mungall CJ, McMurry JA, Kohler S, et al. The Monarch initiative: an integrative data and analytic platform connecting phenotypes to genotypes across species. Nucleic Acids Res. 2017;45:D712–D722.
- Rappaport N, Twik M, Plaschkes I, et al. MalaCards: an amalgamated human disease compendium with diverse clinical and genetic annotation and structured search. Nucleic Acids Res. 2017;45:D877–D887.
- Cui T, Zhang L, Huang Y, et al. MNDR v2.0: an updated resource of ncRNA-disease associations in mammals. Nucleic Acids Res. 2018;46:D371–D374.
- Hudson TJ, Anderson W, Artez A, et al. International network of cancer genome projects. Nature. 2010;464:993–998.
- Wang J, Ma R, Ma W, et al. LncDisease: a sequence based bioinformatics tool for predicting lncRNA-disease associations. Nucleic Acids Res. 2016;44:e90.
- You ZH, Huang ZA, Zhu Z, et al. PBMDA: A novel and effective path-based computational model for miRNA-disease association prediction. PLoS Comput Biol. 2017;13:e1005455.
- Lan W, Li M, Zhao K, et al. LDAP: a web server for lncRNA-disease association prediction. Bioinformatics. 2017;33:458–460.
- Mork S, Pletscher-Frankild S, Palleja CA, et al. Protein-driven inference of miRNA-disease associations. Bioinformatics. 2014;30:392–397.
- Chen X, Wang L, Qu J, et al. Predicting miRNA-disease association based on inductive matrix completion. Bioinformatics. 2018;34:4256–4265.
- Chen X, Yin J, Qu J, et al. MDHGI: matrix decomposition and heterogeneous graph inference for miRNA-disease association prediction. PLoS Comput Biol. 2018;14:e1006418.
- Chen X, Zhu CC, Yin J. Ensemble of decision tree reveals potential miRNA-disease associations. PLoS Comput Biol. 2019;15:e1007209.
- Fu G, Wang J, Domeniconi C, et al. Matrix factorization-based data fusion for the prediction of lncRNA-disease associations. Bioinformatics. 2018;34:1529–1537.
- Amberger JS, Bocchini CA, Schiettecatte F, et al. OMIM.org: online Mendelian inheritance in man (OMIM(R)), an online catalog of human genes and genetic disorders. Nucleic Acids Res. 2015;43:D789–D798.
- Kibbe WA, Arze C, Felix V, et al. Disease Ontology 2015 update: an expanded and updated database of human diseases for linking biomedical knowledge through disease data. Nucleic Acids Res. 2015;43:D1071–D1078.
- Kohler S, Vasilevsky NA, Engelstad M, et al. The human phenotype ontology in 2017. Nucleic Acids Res. 2017;45:D865–D876.
- Baumann N. How to use the medical subject headings (MeSH). Int J Clin Pract. 2016;70:171–174.
- Hagen NT. Harmonic allocation of authorship credit: source-level correction of bibliometric bias assures accurate publication and citation analysis. PLoS One. 2008;3:e4021.
- Love MI, Huber W, Anders S. Moderated estimation of fold change and dispersion for RNA-seq data with DESeq2. Genome Biol. 2014;15:550.