
ABSTRACT
Burkitt lymphoma (BL) is an aggressive B-cell lymphoma characterized by translocation and deregulation of the proto-oncogene c-MYC. Transcription factor 3 (TCF3) has also been shown to be involved in BL pathogenesis. In BL, TCF3 is constitutively active, and/or expression of its transcriptional targets are altered as a result of BL-associated mutations. Here, we found that BL-related TCF3 mutations affect TCF3 alternative splicing, in part by reducing binding of the splicing regulator hnRNPH1 to exon 18b. This leads to greater exon 18b inclusion, thereby generating more of the mutated E47 isoform of TCF3. Interestingly, upregulation of E47 dysregulates the expression of TCF3 targets PTPN6, and perhaps CCND3, which are known to be involved in BL pathogenesis. Our findings thus reveal a mechanism by which TCF3 somatic mutations affect multilayered gene regulation underlying BL pathogenesis.
Introduction
Burkitt lymphoma (BL) is an aggressive, MYC-driven B-cell lymphoma derived from germinal centres, which are sites of intense B-cell proliferation [Citation1,Citation2]. Mutations or dysregulation of genes involved in the transcription network of TCF3, also known as E2A, are also common in BL [Citation3–Citation7]. Indeed, in approximately 70% of sporadic BL cases, recurrent mutations of TCF3 or its negative regulator ID3were observed [Citation7]. Moreover, CCND3, a transcriptional target of TCF3 [Citation8] that regulates proliferation [Citation7,Citation9,Citation10], is also frequently mutated in BL [Citation4,Citation6]. PTPN6, another TCF3 transcriptional target, encoding a phosphatase (SHP-1) that inhibits the B-cell receptor signalling pathway [Citation11], has been shown to be downregulated in BL [Citation7,Citation12]. These studies indicate that TCF3’s transcription network plays a fundamental role in BL pathogenesis.
TCF3 is a member of the E protein family of helix-loop-helix transcription factors [Citation13]. It can dimerize with a variety of tissue-specific class II HLH transcription factors to function in several differentiation programmes [Citation14,Citation15]. The TCF3 gene encodes two protein isoforms, referred to as E12 and E47, that arise from alternative splicing (AS) of two mutually exclusive exons, 18a (E12) or 18b (E47) (, top) [Citation13,Citation16]. Hereafter, 18a and 18b refer to the exons in the mRNA, while E12 and E47 refer to the resultant protein isoforms. These two isoforms differ only in their bHLH DNA binding region and have distinct functions in multiple biological processes, such as embryonic stem cell differentiation [Citation17], cortical development [Citation18] and normal B-cell development [Citation19].
Figure 1. Recurrent mutations of the TCF3 gene in BL affect TCF3 alternative splicing.
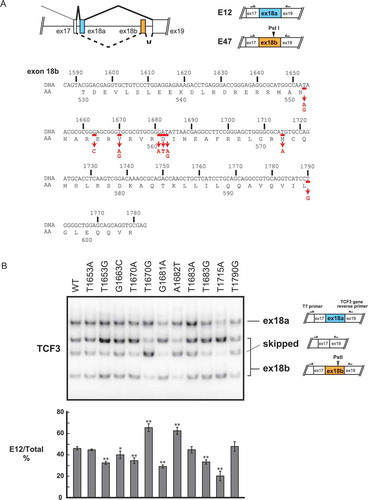
Significantly, all TCF3 mutations in BL are in exon 18b, thus affecting exclusively the E47 isoform [Citation7]. Some of these mutations alter four evolutionarily conserved amino acid residues (N551K, V557E/G, D561E/V/N, M572K) [Citation7]. Among these mutations, N551K changes a DNA-contact residue [Citation20] and alters TCF3's DNA binding specificity [Citation7]. V557E and D561E render TCF3 constitutively active by disrupting interaction with ID3 [Citation7]. In addition, exon 18b mRNA transcripts are more abundant than exon 18a transcripts in BL with TCF3 mutations [Citation7,Citation21]. Notably, these mutations lie near exonic splicing silencers (ESSs) in exon 18b, which we recently identified as binding sites for hnRNPH1/F [Citation17]. These observations thus suggest that recurrent mutations in TCF3 exon 18b affect not only TCF3 functions but also possibly TCF3 AS.
In this study, we found that multiple BL-related TCF3 mutations alter TCF3 AS by increasing exon 18b inclusion, at least in part, by disrupting hnRNPH1 binding to ESSs in exon 18b. This leads to upregulation of the E47 isoform and can dysregulate expression of PTPN6 and CCND3, which are known to be involved in BL pathogenesis.
Results
Recurrent somatic mutations of TCF3 in exon 18b disrupt TCF3 AS
We first determined if recurrent BL mutations in TCF3 affect TCF3 AS. We used a previously developed TCF3 minigene system that recapitulates TCF3 AS and its regulation [Citation17]. We created a series of point mutations corresponding to recurrent BL mutations, as reported by Schmitz et al. [Citation7] (, bottom). These constructs and the wildtype (WT) construct were transiently transfected into HeLa cells and E12/E47 levels were analysed by semi-quantitative 32P RT-PCR. Interestingly, 6 of the 11 mutations, T1653G, G1663C, T1670A, G1681A, T1683G and T1715A, caused increased exon 18b inclusion, resulting in a decrease in the E12/E47 ratio (; quantitation at the bottom). Unexpectedly, two mutations, T1670G and A1682T, decreased exon 18b inclusion (). These data suggest that recurrent BL mutations can disturb TCF3 AS and alter the E12/E47 mRNA ratio.
TCF3 isoforms play differential roles in BL
Since all recurrent BL mutations in TCF3 affect the DNA-binding domain of E47, but not E12, non-redundant roles of E12 and E47 were suggested [Citation7]. To verify this, we determined whether PTPN6 and CCND3, two TCF3 target genes [Citation2,Citation7], are regulated in an isoform-specific manner. We transfected Raji, a BL cell line, with siRNAs specifically targeting either exon 18a or 18b (thus depletion of E12 or E47, respectively; see Yamazaki et al. [Citation17], for more detail) and then performed RT-qPCR to quantitate PTPN6 and CCND3 mRNA levels. Knockdown (KD) efficiency was determined by 32P RT-PCR (). Interestingly, PTPN6 mRNA levels increased significantly following E47 KD, but decreased upon E12 KD (), whereas CCND3 mRNA levels were decreased by either E12 or E47 KD (). Expression levels of CCND3 following E12 or E47 KD in 293T cells were similar to those in Raji cells (). However, more striking effects on PTPN6 mRNA expression following E12 or E47 KD were observed in 293T cells (), perhaps reflecting the higher KD efficiency.
Figure 2. Isoform-specific regulation of TCF3’s downstream target genes PTPN6 and CCND3.
We also performed isoform-specific TCF3 KD in Namalwa, another BL cell line. PTPN6 mRNA levels did not change after E12 KD but were significantly increased following E47 KD (), similar to what we observed in Raji cells. We did not observe changes in CCND3 mRNA levels after either E12 or E47 KD (), suggesting CCND3 regulation by TCF3 might be cell line-dependent. Nevertheless, our results demonstrate that PTPN6 expression is repressed by E47, and this is likely a general phenomenon in BL.
Recurrent BL mutations in TCF3 can contribute to TCF3 AS dysregulation by affecting hnRNPH1 binding
Since our previous study identified binding of hnRNPH1 and F to two ESSs in exon 18b, we hypothesized that at least several of the BL-related mutations in TCF3 disrupt binding of hnRNPH1 to these ESSs. In fact, D561 mutations (G1681A, A1682T, T1683A/G), the most common TCF3 mutations in BL [Citation7], occur within one of the ESSs recognized by hnRNPH1 [Citation17]. To test this idea, we first determined whether hnRNPH1 functions as a splicing repressor of exon 18b in BL cells. We transfected siRNA targeting hnRNPH1 into Raji cells and measured the E12/E47 mRNA ratio by 32P RT-PCR. This hnRNPH1 siRNA was used previously and shown to be specific [Citation17]. KD efficiency of hnRNPH1 was confirmed by Western blot (). Consistent with our previous findings with other cell lines [Citation17], depletion of hnRNPH1 caused increased exon 18b inclusion, or decreased exon 18a inclusion, in Raji cells (), confirming that hnRNPH1 indeed functions as a repressor of exon 18b inclusion.
Figure 3. Recurrent TCF3 mutations can disturb hnRNPH1 binding to exon 18b.
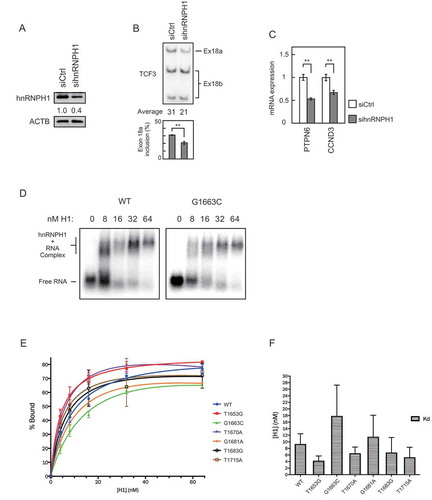
We then performed RT-qPCR analyses of PTPN6 and CCND3 mRNAs after hnRNPH1 KD. Depletion of hnRNPH1, which increased E47 levels but decreased E12 levels, caused a significant decrease in PTPN6 mRNA levels (). This is consistent with our TCF3 isoform-specific KD results (). Our TCF3 isoform KD results also showed that CCND3 expression can be regulated similarly by either E12 or E47 (). Thus, if E12 and E47 play redundant roles in CCND3 regulation, we would expect to observe no change in CCND3 transcript levels after hnRNPH1 KD. However, hnRNPH1 KD caused a significant decrease in CCND3 expression (). This suggests that CCND3 expression is sensitive to the E12/E47 ratio in Raji cells.
We next examined if the BL mutations affect binding of hnRNPH1 to the ESSs in exon 18b. To this end, we performed gel shift assays using purified recombinant hnRNPH1 protein and 32P-labelled RNA probes corresponding to exon 18b and containing individual BL mutations that disrupt TCF3 AS, namely T1653G, G1663C, T1670A, G1681A, T1683G and T1715A. The G1663C mutation appeared to impair hnRNPH1 binding to exon 18b (), with an ~2 fold increase in mean Kd compared to the wildtype (WT) control (). Another mutation, G1681A, also appeared to decrease hnRNPH1 binding affinity and caused an ~30% increase in mean Kd compared with WT (). Such decreased affinity likely contributes to the observed increased exon 18b inclusion. Other mutations, however, did not seem to decrease hnRNPH1 binding affinity (), suggesting that their effects in TCF3 AS are likely dependent on other splicing regulators. Overall, the observed changes in hnRNPH1 binding to mutated exons 18b were modest. This may reflect the fact that we used relatively long RNAs (greater than 100 nucleotides) to cover most of the recurrent mutations, and thus the effects of the single nucleotide mutations may have been obscured in our in vitro assays. Nevertheless, our data demonstrate that BL-related mutations in TCF3 can alter TCF3 AS, at least in part by disrupting hnRNPH1 binding to exon 18b.
Discussion
In this report, we evaluated the effects of somatic mutations of TCF3 in Burkitt lymphoma on TCF3 AS. While the effects of these mutations on TCF3 function have been documented [Citation7], their possible effects on TCF3 AS represented an unappreciated, and unexamined, layer of regulation in BL pathogenesis. Interestingly, our study showed that more than half of recurrent mutations in BL (8 out of 11) disturbed TCF3 AS. Importantly, 6 of them increased E47 expression levels. These results explain at least in part why BL recurrent TCF3 mutations are all observed within exon 18b, why levels of mutated E47 are increased in BL, and suggest that these mutations facilitate BL pathogenesis in two distinct ways.
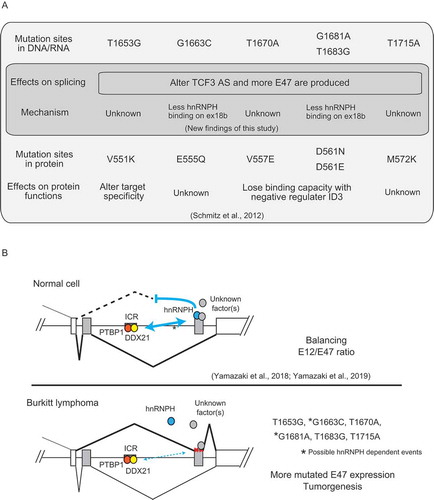
As summarized in , T1653G, G1663C, T1670A, G1681A/T1683G and T1715A are all able to alter TCF3 AS to increase levels of the mutated E47 isoform. In addition to altering splicing, T1653G (V551K) changes a DNA-contact residue and thus alters TCF3’s target specificity [Citation7]. T1670A (V557E), G1681A (D561N) and T1683G (D561E) alter residues adjacent to the helix structure of the bHLH region and change TCF3’s dimerization affinity with its negative binding partner ID3, causing TCF3 to be constitutively active [Citation7]. G1663C (E555Q) and T1715A (M572K) have not been shown to affect TCF3 protein function, and our data now suggest that these two mutations can contribute to BL pathogenesis by increasing E47 levels.
Figure 4. Summary of the effects of recurrent TCF3 mutations in BL, and a model of their effects on TCF3 AS regulation.
In addition to TCF3 AS, we also determined the functional differences between the two TCF3 isoforms, E12 and E47, on PTPN6 and CCND3. We showed that E47 specifically represses PTPN6 expression in both Raji and Namalwa cells. BL mutations can alter TCF3 AS to produce abnormally high E47 expression levels, which contribute to reduced PTPN6 expression. This is likely a general phenomenon in BL. Functionally, downregulation of PTPN6 causes hyperphosphorylation of the B-cell receptor, thus facilitating cell growth and tumorigenesis [Citation7,Citation22].
Regarding CCND3, we found that its expression was decreased following hnRNPH1 depletion. As this alters TCF3 AS, and thus the E12/E47 ratio, one possible explanation is that CCND3 transcription is regulated by an E12-E47 heterodimer. Such dimers have been detected and shown to have DNA binding activity in vitro [Citation23,Citation24]. It is also possible that hnRNPH1 modulates CCND3 expression, either indirectly (via affecting the expression of other factors) or directly (e.g. by regulating CCND3 splicing). Interestingly, CCND3 expression was altered after TCF3 KD in Raji cells, but not in Namalwa cells. Given that CCND3 is also recurrently mutated in BL, its regulation is likely altered significantly among different BL cell lines. Nevertheless, our data suggest that elevated E47 levels can contribute to BL tumorigenesis by dysregulating CCND3 at least in a fraction of BLs.
Our current study has also provided insight into how certain recurrent BL mutations dysregulate TCF3 AS, which is illustrated in the model in . Our previous studies showed that TCF3 AS is regulated by hnRNPH1 binding to ESSs in exon 18b, and also by PTBP1 and DDX21 binding to an intronic conserved region (ICR) between the two mutually exclusive exons [Citation17,Citation25]. Proper interactions among these factors/RNA elements generate a balanced E12/E47 ratio, thus maintaining cells in a physiologically normal state (, top). Somewhat unexpectedly, only G1663C and G1681A mutations, which are relatively rare (2 out of 28 BL cases with TCF3 mutations; [Citation7]), tended to reduce hnRNPH1 binding in our in vitro assays. This reduces the repressive effect of hnRNPH1 binding to the exon 18b ESSs [Citation17], thereby increasing exon 18b inclusion and thus E47 levels (, bottom). How G1663C (E555Q) affects TCF3 protein function remains unknown, but we have determined that G1681A (D561N) not only alters TCF3’s interaction with ID3 at the protein level but also affects hnRNPH1 binding at the pre-mRNA level.
As proposed in our previous study [Citation25], TCF3 splicing may be controlled by RNA secondary structures in exon 18b, such as a G-quadruplex which may be recognized by hnRNPH1 [Citation26] and unwound by DDX21 [Citation27], and long-range RNA bridging between the ICR and ESSs on exon 18b. Thus, other mutations (T1653G, T1670A, T1683G and T1715A) might dysregulate TCF3 AS by interfering with such RNA secondary structures and/or long-range RNA interactions. These mutations might also create abnormal regulatory elements for unidentified splicing regulators (, bottom). Whatever the mechanism, though, these altered interactions cause an increase of mutated E47 expression and disturb TCF3’s transcription network, contributing to tumorigenesis ().
In conclusion, although further investigation is necessary to understand exactly how each TCF3 mutation affects TCF3 AS, our data have revealed a new layer of gene regulation in the fundamental pathway of BL pathogenesis. We have shown that BL recurrent mutations in TCF3 can affect not only protein functions, as previously shown, but also alter TCF3 AS in ways that can contribute to disease.
Materials and methods
Cell culture and transfection
HeLa, 293T, Raji and Namalwa cells were maintained in DMEM supplemented with 10% FBS. For HeLa and 293T cells, DNA transfection reagent (Biotools) was used for plasmid transient transfection, and siRNAs were transfected using Lipofectamine RNAiMAX Transfection Reagent (Invitrogen), according to the manufacturers’ instructions. siRNA knockdown in Raji and Namalwa cells was performed using the Neon Transfection System (Invitrogen). Parameters for Raji cells were 1300 V, 30 ms and 1 pulse. Parameters for Namalwa cells were 1300 V, 20 ms and 1 pulse. Cells were harvested 48 hours after transfection and used for subsequent analyses. Sequences of siRNAs targeting hnRNPH1, E12 and E47 transcripts are described in Citation17.
Plasmid constructs and minigene splicing assays
Construction of TCF3 minigene reporters is described by Yamazaki et al. [Citation17]. All mutations of the TCF3 minigene were introduced by PCR-based site-directed mutagenesis as previously described [Citation17]. One hundred nanograms of wildtype or mutated minigene plasmids were transfected into HeLa cells. Forty-eight hours after transfection, RNA was extracted and the E12/E47 mRNA ratio was analysed using 32P RT-PCR (see below) followed by PstI digestion. Digested PCR products were separated on a 5% PAGE gel. ImageQuant TL (GE healthcare) was used for quantification.
RT-qPCR and 32P RT-PCR
Total RNA was extracted from cells using the TRIzol (Invitrogen) according to the manufacture instructions. Total RNA (1 ug) was reverse transcribed using Maxima RT (Thermo Scientific) primed with random hexamers (Invitrogen). 32P RT-PCR was performed using Taq DNA polymerase (Invitrogen) with 3 uCi [32P] dCTP (Perkin Elmer) per 50 ul PCR reaction. RT-qPCR was performed with Power SYBR using StepOnePlus (Applied Biosystems). Data were analysed by ΔΔCT method. CT values of PTPN6 and CCND3 were normalized to the averages of CT values of ACTB and GAPDH.
Western blotting
Cells were lysed with SDS sample buffer (70 mM Tris-HCl pH 6.8, 5.5% glycerol, 0.1% SDS, and 1x proteinase inhibitor cocktail [Bimake]) and resolved by SDS-PAGE. Nitrocellulose membranes containing transferred proteins were incubated with primary antibodies detecting hnRNPH1 (Santa Cruz Biotechnology, 1:5000), or ACTB (Sigma, 1:5000) overnight at 4°C. Secondary HRP-conjugated IgGs (Sigma) were used at 1:6000 for 1 hour at room temperature. Following washes with PBST (1x PBS, 0.1% Tween-20), KiwikQuant Ultra Digital-ECL (Kindle Biosciences) was used to visualize the chemiluminescence signal.
Gel shift assay
To construct RNA probes, part of exon 18b (1633–1735 bp) was amplified from minigenes containing the desired point-mutations and cloned into pcDNA3.1(+). RNA probes were transcribed in vitro with T7 RNA polymerase and labelled with 32P.
Purification of recombinant hnRNPH1 protein is described in Conlon et al. [Citation26]. Reaction mixes containing 0.3 nM in vitro transcribed RNA, 30 nM tRNA and 0–640 nM hnRNPH1 in binding buffer (50 mM Tris, pH 8, 50 mM NaCl, 2 mM EDTA, 0.5% BSA, 0.2% CHAPS) were first incubated for 30 min at 37°C and were then immediately placed on ice and 1 ul 50% glycerol was added before loading onto a pre-run native 0.7% agarose gel. Gels were dried, and radioactivity was detected by phosphorimager (GE Healthcare). After quantification with ImageQuant, Prism (GraphPad) was used to generate binding curves. Kd was estimated using non-linear regression by plotting replicate data points with Prism.
Acknowledgments
We thank members of the Manley laboratory for discussions. Raji and Namalwa cells were generous gifts from Prof. Riccardo Dalla-Favera (Columbia University Irving Medical Center, New York, NY, 10032, USA). The Manley lab is supported by US National Institutes of Health (NIH) grant R35 GM118136. This material is based upon work supported by the National Science Foundation Graduate Research Fellowship under Grant No. DGE – 1644869 (L.L.).
Disclosure statement
No potential conflict of interest was reported by the authors.
Additional information
Funding
References
- Basso K, Dalla-Favera R. Germinal centres and B cell lymphomagenesis. Nat Rev Immunol. 2015;15(3):172–184.
- Schmitz R, Ceribelli M, Pittaluga S, et al. Oncogenic mechanisms in Burkitt lymphoma. Cold Spring Harb Perspect Med. 2014;4(2):pii: a014282.
- Kaymaz Y, Oduor CI, Yu H, et al. Comprehensive transcriptome and mutational profiling of endemic Burkitt lymphoma reveals EBV type-specific differences. Mol Cancer Res. 2017;15(5):563–576.
- Love C, Sun Z, Jima D, et al. The genetic landscape of mutations in Burkitt lymphoma. Nat Genet. 2012;44(12):1321–1325..
- Panea RI, Love CL, Shingleton JR, et al. The whole genome landscape of Burkitt lymphoma subtypes. Blood. 2019;134(19):1598–1607.
- Richter J, Schlesner M, Hoffmann S, et al. Recurrent mutation of the ID3 gene in Burkitt lymphoma identified by integrated genome, exome and transcriptome sequencing. Nat Genet. 2012;44:1316–1320.
- Schmitz R, Young RM, Ceribelli M, et al. Burkitt lymphoma pathogenesis and therapeutic targets from structural and functional genomics. Nature. 2012;490(7418):116–120..
- Song S, Cooperman J, Letting DL, et al. Identification of cyclin D3 as a direct target of E2A using DamID. Mol Cell Biol. 2004;24(19):8790–8802.
- Cato MH, Chintalapati SK, Yau IW, et al. Cyclin D3 is selectively required for proliferative expansion of germinal center B cells. Mol Cell Biol. 2011;31(1):127–137.
- Peled JU, Yu JJ, Venkatesh J, et al. Requirement for cyclin D3 in germinal center formation and function. Cell Res. 2010;20(6):631–646.
- Cornall RJ, Cyster JG, Hibbs ML, et al. Polygenic autoimmune traits: Lyn, CD22, and SHP-1 are limiting elements of a biochemical pathway regulating BCR signaling and selection. Immunity. 1998;8(4):497–508.
- Delibrias CC, Floettmann JE, Rowe M, et al. Downregulated expression of SHP-1 in Burkitt lymphomas and germinal center B lymphocytes. J Exp Med. 1997;186(9):1575–1583.
- Murre C, McCaw PS, Baltimore D. A new DNA binding and dimerization motif in immunoglobulin enhancer binding, daughterless, MyoD, and myc proteins. Cell. 1989;56(5):777–783.
- Wang L-H, Baker NE. E-proteins and ID-proteins: helix-loop-helix partners in development and disease. Dev Cell. 2015;35(3):269–280.
- Wöhner M, Tagoh H, Bilic I, et al. Molecular functions of the transcription factors E2A and E2-2 in controlling germinal center B cell and plasma cell development. J Exp Med. 2016;213(7):1201–1221.
- Sun XH, Baltimore D. An inhibitory domain of E12 transcription factor prevents DNA binding in E12 homodimers but not in E12 heterodimers. Cell. 1991;64(2):459–470.
- Yamazaki T, Liu L, Lazarev D, et al. TCF3 alternative splicing controlled by hnRNP H/F regulates E-cadherin expression and hESC pluripotency. Genes Dev. 2018;32(17–18):1161–1174.
- Pfurr S, Chu Y-H, Bohrer C, et al. The E2A splice variant E47 regulates the differentiation of projection neurons via p57(KIP2) during cortical development. Development. 2017;144(21):3917–3931.
- Beck K, Peak MM, Ota T, et al. Distinct roles for E12 and E47 in B cell specification and the sequential rearrangement of immunoglobulin light chain loci. J Exp Med. 2009;206(10):2271–2284.
- Ellenberger T, Fass D, Arnaud M, et al. Crystal structure of transcription factor E47: E-box recognition by a basic region helix-loop-helix dimer. Genes Dev. 1994;8(8):970–980.
- López C, Kleinheinz K, Aukema SM, et al. Genomic and transcriptomic changes complement each other in the pathogenesis of sporadic Burkitt lymphoma. Nat Commun. 2019;10(1):1459.
- Niemann CU, Wiestner A. B-cell receptor signaling as a driver of lymphoma development and evolution. Semin Cancer Biol. 2013;23(6):410–421.
- Dear TN, Hainzl T, Follo M, et al. Identification of interaction partners for the basic-helix – loop – helix protein E47. Oncogene. 1997;14(8):891–898.
- Murre C, McCaw PS, Vaessin H, et al. Interactions between heterologous helix-loop-helix proteins generate complexes that bind specifically to a common DNA sequence. Cell. 1989;58(3):537–544.
- Yamazaki T, Liu L, Manley JL. TCF3 mutually exclusive alternative splicing is controlled by long range cooperative actions between hnRNPH1 and PTBP1. RNA. 2019;25(11):1497–1508.
- Conlon EG, Lu L, Sharma A, et al. The C9ORF72 GGGGCC expansion forms RNA G-quadruplex inclusions and sequesters hnRNP H to disrupt splicing in ALS brains. ELife. 2016;5:e17820.
- McRae EKS, Booy EP, Moya-Torres A, et al. Human DDX21 binds and unwinds RNA guanine quadruplexes. Nucleic Acids Res. 2017;45(11):6656–6668.