
ABSTRACT
Polycystic ovary syndrome (PCOS) causes anovulatory infertility in women of reproductive age, but etiopathogenesis of PCOS remains undetermined. Taurine up-regulated 1 (TUG1), an evolutionarily conserved long non-coding RNA, performs various biological functions; however, the role of TUG1 in PCOS remains unclear. Herein, TUG1 expression was assayed in granulosa cells (GCs) of 100 patients with PCOS and 100 control participants. Receiver operating characteristic (ROC) curve analysis was conducted to determine the diagnostic value of TUG1 in PCOS. TUG1 expression was also silenced in KGN cells to explore the role of TUG1 in cellular proliferation, apoptosis, cell-cycle progression, autophagy, and steroidogenesis. We found that TUG1 levels were dramatically increased in the PCOS group compared with those of the control group; this increased expression was related to a rising antral follicle count (R = 0.209, P < 0.001 versus control). The ROC curve indicated a significant separation between PCOS group and the control group (AUC: 0.702; 95% CI: 0.630–0.773; P < 0.001). TUG1 showed a predominantly nuclear localization in human GCs. TUG1 knockdown reduced cellular proliferation, and promoted MAPKs pathway-dependent apoptosis and P21-dependent autophagy, but may not affect cell-cycle progression. TUG1 knockdown increased aromatase expression and oestradiol biosynthesis. Our results indicate that increased TUG1 expression in PCOS GCs may contribute to excessive follicular activation and growth, and may disrupt the selection of dominant follicle. Our study shows that TUG1 can be used as a diagnostic biomarker for PCOS.
Introduction
Polycystic ovary syndrome (PCOS) is a reproductive and endocrine disorder that is common among women of reproductive age. PCOS accounts for approximately 75% of anovulatory-infertility diseases [Citation1]. Characteristics of PCOS include hyperandrogenism, oligo/anovulation and polycystic ovaries. Women with PCOS are at a high risk for diabetes, endometrial cancer, cardiovascular disease, and metabolic syndrome [Citation2]. Despite decades of extensive research, the exact aetiology of PCOS remains largely unclear.
Accumulating evidence indicates that damaged ovarian function accompanied by abnormal folliculogenesis and steroidogenesis, and lack of dominant-follicle development may contribute to the pathology of PCOS [Citation3,Citation4]. Ovarian follicular maternal signals and microenvironment, largely modulated by granulosa cells (GCs) and cumulus cells, regulate steroidogenesis, folliculogenesis, and oocyte growth and maturation [Citation5]. Thus, GCs play a pivotal role not only in normal but also in aberrant, folliculogenesis observed in PCOS [Citation6]. Although the functions of GCs have been extensively characterized, there are still numerous ambiguities regarding their modulation by diverse genes.
Long non-coding RNAs (lncRNAs) play important roles in the progression of PCOS [Citation7,Citation8]. LncRNAs are transcripts longer than 200 nucleotides that perform distinct biological functions such as mediation of trans-acting gene regulation [Citation9], X-chromosome inactivation [Citation10], imprinting [Citation11], and regulation of nuclear import [Citation12]. Increasing evidence suggests that lncRNAs, such as lncRNA-H19 [Citation13], lncRNA-PVT1 [Citation14], metastasis-associated lung adenocarcinoma transcript 1 (MALAT1) [Citation15], and nuclear paraspeckle assembly transcript 1 (NEAT1) [Citation16], can mediate the progression of gynaecological diseases. Most of these lncRNAs are abundant and conserved transcripts involved in mammalian development and tumorigenesis. Highly conserved sequences are generally involved in vital physiological functions.
Taurine upregulated 1 (TUG1), a highly evolutionarily conserved lncRNA, is 7.1-kb in length and is located on chromosome 22q12. TUG1 is well-characterized and highly expressed by the human ovary, testis and other tissues (https://www.ncbi.nlm.nih.gov/gene/55000). Tug1 was first recognized as essential in the retinal development of rodents [Citation17]. Since then, TUG1 has been implicated in diverse biological processes, including chromatin remodelling, or acting as a decoy for proteins or miRNAs. However, the downstream molecular mechanisms of TUG1 remain unclear. TUG1 has been shown as a master regulator in glycolysis and metastasis via the targeting of miR-455-3p/AMPKβ2 in hepatocellular carcinoma [Citation18]. Using a murine model of diabetic nephropathy, Long et al. identified Tug1 as a differentially expressed lncRNA in the diabetic milieu [Citation19]. TUG1 can promote macrophage growth and the inflammatory response, and trigger the proliferation, migration, and apoptosis of endothelial cells in atherosclerosis [Citation20,Citation21,Citation22]. The expression of TUG1 is upregulated in endometrial cancer [Citation23], and is related to hyperlipidaemia and obesity in patients with hypertension [Citation24]. PCOS is associated with diabetes, obesity, metabolic syndrome, and increased risk for cardiovascular disease. While TUG1 expression has been characterized in these PCOS-associated conditions, the role and mechanisms of TUG1 in PCOS remain unknown.
In the present study, our objective was to investigate the potential role of TUG1 in GC proliferation, apoptosis, autophagy, cell-cycle progression, and steroidogenesis to provide novel insights into the pathogenic mechanisms of PCOS. For this, we examined changes in TUG1 levels after controlled ovarian hyperstimulation (COH) of human luteinized GCs (hLGCs) obtained from pre-ovulatory follicles of PCOS and control groups. Due to the difficulties of collecting sufficient quantities of hLGCs and sustaining primary cultures, we also used the human GC tumour-derived cell line, KGN, which shows steroidogenic activity similar to that of normal human GCs, for further functional and mechanistic studies [Citation25]. Determining the functions and molecular mechanisms of TUG1 will promote our understanding of the regulatory networks driving the pathogenesis of PCOS.
Results
TUG1 is up-regulated in PCOS GCs and is related to a rising antral follicle count
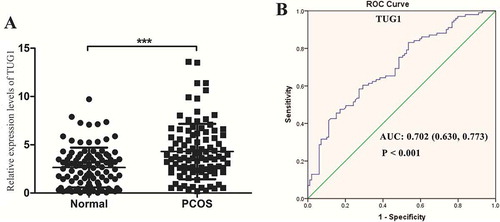
The expression levels of TUG1 were analysed in 200 hLGCs from 100 patients with PCOS and 100 control patients. The clinical features of patients with PCOS and controls are shown in . Women with PCOS showed a significant increase in antral follicle count (AFC) compared with that of controls (P < 0.001). TUG1 expression was significantly up-regulated in PCOS GCs compared with that of controls (P < 0.001; ). To explore whether TUG1 expression was associated with the hormonal and clinical characteristics of patients, we analysed the correlations between TUG1 expression levels and clinical characteristics of 200 participants with or without PCOS. As shown in , statistical analyses indicated positive correlations between TUG1 expression and LH, LH/FSH, starting gonadotropin (Gn) dose, AFC, the numbers of ≥14 mm follicles on human chorionic Gn (hCG) day, and the number of follicles aspirated and that of oocytes retrieved. No major correlations were between TUG1 expression and any other characteristics were observed.
Table 1. Characteristics of PCOS and control participants for qRT-PCR analyses
Table 2. Pearson’s rank correlation coefficients of the expression of TUG1 and patients’ characteristics
Figure 1. TUG1 expression levels in human luteinized granulosa cells (hLGCs) and its receiver operating characteristic (ROC) curve. (A) Quantitative real-time PCR (qRT-PCR) analysis of TUG1 expression in polycystic ovary syndrome (PCOS) GCs (n = 100) and non-PCOS GCs (n = 100). TUG1 levels are normalized to that of GAPDH mRNA. ***P < 0.001. (B) ROC curve was used to evaluate the diagnostic value of TUG1 using a GC marker. The area under the ROC curve (AUC) was used to evaluate the sensitivity and specificity of TUG1 as a diagnostic marker for PCOS
Diagnostic value of TUG1 in PCOS
ROC curve analysis was used to identify the value of TUG1 in differentiating patients with PCOS from healthy controls. The expression levels of TUG1 in the PCOS and control groups were detected via quantitative real-time PCR (qRT-PCR). As shown in , AUC was 0.702 (95% confidence interval [CI]: 0.630–0.773; P < 0.001) for all participants, indicating a significant separation between patients with PCOS and controls.
Distribution of TUG1 and impact of TUG1 silencing on GC proliferation
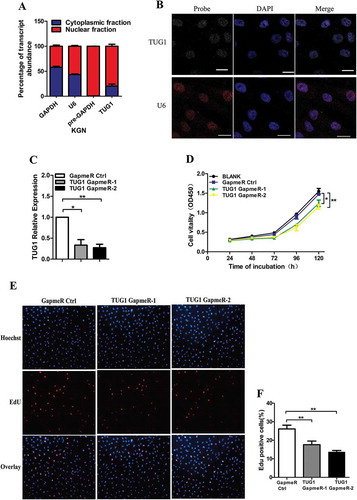
The association between TUG1 RNA distribution, and other functional and structural entities, can provide critical insights into the function of TUG1. Thus, RNA from nuclear and cytoplasmic fractions was analysed, and RNA fluorescence in situ hybridization (FISH) was applied to visualize the cellular localization of TUG1 in KGN cells. We found that although TUG1 was distributed in both cytoplasm and nucleus, nuclear localization predominated (). Next, we used LNA GapmeRs, which are single-stranded oligonucleotides composed of a DNA stretch flanked by LNA nucleotides, to silenced TUG1 expression in order to explore whether aberrant TUG1 expression in GC affected GC function. As shown in , LNA GapmeRs could effectively inhibit TUG1 expression (P < 0.05). CCK-8 and EdU assays were used to evaluate cell proliferation in KGN cells. The results showed that TUG1 knockdown could remarkably attenuate cell proliferation ().
Figure 2. Distribution of TUG1 and effect of TUG1 knockdown on cellular proliferation. (A) qRT–PCR quantification of TUG1 expression in RNA purified from cytoplasmic or nuclear fractions of KGN cells. GAPDH served as positive control for cytoplasmic gene expression, whereas pre-GAPDH and U6 served as positive controls for nuclear gene expression. The percentage of transcript abundance in the nucleus (or cytoplasm) was calculated by the 2 CYT (or NUC) CT/(2NUC CT + 2CYT CT) method. (B) TUG1 intracellular localization was visualized in KGN cells by RNA-FISH assays. Blue, DAPI. Yellow, TUG1. The U6 probe was used as a nucleus control (Red). Scale bar, 20 μm. (C) Transfection efficiency was determined by qRT-PCR after KGN cells were incubated for 48 h with 25 nM TUG1 GapmeRs or GapmeR control (GapmeR Ctrl). TUG1 levels are normalized to expression levels of GAPDH mRNA. GapmeR control (GapmeR Ctrl) was set to 1. (D) The proliferation of transfected cells was measured using a Cell Counting Kit-8 (CCK-8) assay at 24–120 h post-transfection. (E and F) Cell proliferation was determined using an ethynyl-2-deoxyuridine (EdU) assay. Proliferating cells were labelled with EdU (red). Cell nuclei were stained with DAPI (blue). Images were acquired using fluorescence microscopy (at 200× magnification). Data are shown as mean ± standard deviation (SD). *P < 0.05, **P < 0.01
TUG1 knockdown promotes GC apoptosis by activating the MAPKs pathway
Flow cytometry was used to explore whether inhibition of cellular proliferation via TUG1 knockdown involved increased levels of apoptosis or cell-cycle arrest. Our results indicate that TUG1 knockdown increased the percentage of apoptotic cells (); however, no significant differences in cell-cycle distributions were observed in TUG1-transfected cells as compared with negative-control cells (Supplementary Fig. S1A, B). We then analysed the levels of pro-apoptotic proteins, including Bax, Bak, caspase-3, cleaved caspase-3, caspase-9, and cleaved caspase-9 in TUG1-transfected and negative-control cells. Our results show that TUG1 knockdown significantly increased the levels of Bax, Bak, cleaved caspase-3, caspase-9 and cleaved caspase-9, but decreased the levels of caspase-3, suggesting that TUG1 knockdown may have simultaneously promoted the expression and cleavage of caspase-9, while promoting only the cleavage of caspase-3 (). These results indicate that TUG1 inhibited Bax/Bak and caspase-9/caspase-3-mediated apoptosis.
Figure 3. Effect of TUG1 knockdown on MAPKs pathway-mediated apoptosis. (A and B) KGN cells were transfected with GapmeR Ctrl or TUG1 GapmeRs for 48 h with or without 20 μM U0126 pretreatment, stained with annexin V-FITC and propidium iodide (PI), and analysed via FACScan flow cytometer. Data were analysedKGN cells. KGN cells were treated with a using FlowJo software, and apoptotic cells in early (Q3; annexin Vpos; PIneg) and late apoptotic stages (Q2; annexin Vpos; PIpos) were counted. (C and D) The expression levels of ERK, phosphorylated-ERK (p-ERK), Bax, Bak, caspase-9, cleaved caspase-9, caspase-3 and cleaved caspase-3 were assessed by western blotting in KGN cells at 48 h post-transfection with or without 20 μM U0126 pretreatment. ImageJ software was used to analyse and normalize band intensity, and protein levels were normalized to the expression levels of β-tubulin. (E and F) Total and phosphorylated levels of ERK, JNK and p38 MAPK were assessed by western blotting in KGN cells at 48 h post-transfection. ImageJ software was used to analyse and normalize band intensity, and protein levels were normalized to the expression levels of GAPDH. Data are expressed as mean ± SD. *P < 0.05, **P < 0.01, ***P < 0.001
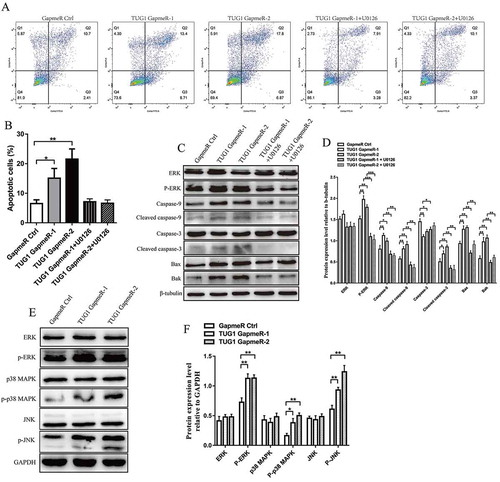
The MAPKs pathway, which includes the ERKs, JNKs and p38 MAPK subfamilies, is a vital and highly studied intracellular signalling pathway that mediates cellular proliferation and apoptosis [Citation26]. Our results show that silencing of TUG1 expression increased the levels of phosphorylated ERK (p-ERK), JNK (p-JNK) and p38 MAPK (p-p38 MAPK; ), but had no effect on the total levels of ERK, JNK and p38 MAPK. The ERK/MAPK pathway is currently the best characterized MAPKs pathway, and in our previous study, we showed that ERK/MAPK pathway plays an important role in GC proliferation [Citation15]. Therefore, in our present study, we used the specific ERK/MAPK kinase inhibitor U0126 to further investigate the association between the ERK/MAPK pathway and apoptosis. Our results show that treatment of KGN cells with U0126 attenuated the up-regulated expression of p-ERK, Bax, Bak, cleaved caspase-9, cleaved caspase-3 and caspase-9, and downregulated expression of caspase-3, induced by TUG1 knockdown (, D). Flow cytometry shows that U0126 abrogated the increased levels of cellular apoptosis induced by TUG1 knockdown (). These results indicate that TUG1 knockdown promoted cellular apoptosis by stimulating the MAPKs pathway.
TUG1 knockdown promotes GC autophagy by increasing P21 expression
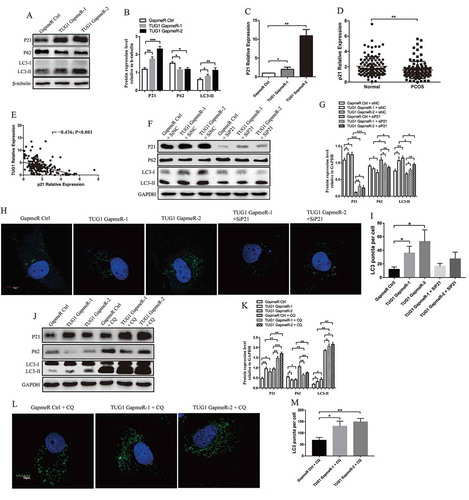
In the initial autophagy process, nascent LC3 (pro-LC3) is progressed into LC3-I. During autophagy, cytosolic LC3-I is conjugated to phosphatidylethanolamine to generate LC3-II, which is critical for activating the formation of the autophagosome. Intravacuolar LC3-II is then degraded by a subsequent combination of autophagosome and lysosome, known as an autolysosome. Because LC3-II levels correlate well with those of autophagosomes [Citation27], and the sensitivity of an LC3-II immunoblot assay is much higher than that employing LC3-I [Citation28], we used the LC3-II/housekeeping protein for our western blotting assay used to evaluate autophagy activity in our present study. Another broadly used autophagy marker, P62, also known as SQSTM1, binds to LC3 via a short LC3 interaction region (LIR). During autophagy, LC3 mediates the delivery of P62 into lysosomes for degradation [Citation29]. As shown in and B, TUG1 knockdown promoted autophagy by reducing P62 expression and increasing that of LC3-II. P21 was originally identified as a universal inhibitor of cyclin-dependent kinases (CDKs). In addition to its classic role as an inhibitor of cell-cycle progression, P21 is also important in autophagy [Citation30]. Therefore, we targeted P21 to evaluate whether TUG1 was involved in the regulation of cell autophagy. Expectedly, the mRNA and protein levels of P21 were significantly increased by TUG1 knockdown (). We next determined whether P21 expression was influenced by TUG1 in the patient enrolled in our present study. Our results show that P21 levels were markedly down-regulated in the PCOS group of patients compared with the levels of the control group (P < 0.01; ). Pearson’s rank correlation analysis indicates a negative correlation between TUG1 expression and that of P21 in 200 hLGCs obtained from patients with or without PCOS (R = −0.436; P < 0.001; ). Next, we evaluated whether P21 was involved in down-regulation of TUG1-induced autophagy. SiRNA-mediated knockdown of P21 expression significantly increased the abundance of P62 and decreased that of LC3-II in KGN cells (). Moreover, KGN cells with TUG1 knockdown showed a significant increase in the numbers of GFP-LC3 puncta compared with those in control cells; P21 knockdown inhibited punctate accumulation of GFP-LC3 induced by TUG1 knockdown (). These results indicate that TUG1 knockdown may promote autophagy in a P21-dependent manner.
Figure 4. Effect of TUG1 knockdown on P21-dependent autophagy. (A and B) The expression levels of P62, LC3-I, LC3-II, and P21 were detected by western blotting in KGN cells at 48 h post-transfection. ImageJ software was used to analyse and normalize band intensity, and protein levels were normalized to the expression of β-tubulin. (C) qRT–PCR quantification of P21 mRNA levels in KGN cells at 48 h post-transfection. GapmeR Ctrl was set to 1. (D) qRT–PCR quantification of P21 mRNA expression levels in total hLGCs obtained from patients with and without PCOS (n = 100 versus 100). (E) Correlations between TUG1 expression and that of P21 were analysed in 200 hLGC samples obtained from patients with PCOS and healthy controls using Pearson’s rank correlation. (F and G) The expression levels of P62, LC3-I, LC3-II, and P21 were detected by western blotting in KGN cells at 48 h post-transfection with GapmeRs and siRNAs. ImageJ software was used to analyse and normalize band intensity, and protein levels were normalized to the expression of GAPDH. (H and I) Confocal laser microscope images of green fluorescent protein (GFP)-LC3 expression (green fluorescence) and DAPI (blue fluorescence) in KGN cells (Scale bars = 10 μm). The numbers of GFP-LC3 puncta were calculated using five randomly selected fields, and were quantified using at least 20 cells per specimen. (J and K) KGN cells transfected with the corresponding GapmeRs were treated for 4 h with or without the lysosomal inhibitor chloroquine (CQ). The expression levels of P62, LC3-I, LC3-II, and P21 were detected by western blotting. ImageJ software was used to analyse and normalize band intensity, and protein levels were normalized to the expression of GAPDH. (L and M) The formation of GFP-LC3 puncta in KGN cells was measured using a confocal laser microscope (Scale bars = 10 μm). The numbers of GFP-LC3 puncta were calculated using five randomly selected fields, and were quantified using at least 20 cells per specimen. Data are expressed as mean ± SD. *P < 0.05, **P < 0.01, ***P < 0.001
CQ blocks TUG1 knockdown-induced autophagy
Assessing autophagic flux using LC3 as a marker is somewhat distinct due to its dynamic involvement in the autophagy process. Therefore, it is important to measure LC3-II levels in the presence or absence of a lysosomal inhibitor, such as chloroquine (CQ), to determine whether autophagy flux is enhanced, reduced, or blocked. CQ is a weak base with hydrophobic features; it permeates into the lysosomes, and is then protonated and trapped, resulting in increased lysosomal pH. The CQ-loaded lysosomes cannot fuse with autophagosomes, resulting in blockade of autolysosome formation in the late stages of autophagy [Citation31]. In our present study, western blotting showed that protein levels of LC3-II and P62 were elevated by treatment of CQ in KGN cells (). Additional increase in LC3-II levels and decrease in P62 levels were observed in TUG1-silenced cells after these cells were treated with CQ, suggesting that TUG1 knockdown increased autophagic flux. Additionally, P21 showed a tendency for the autophagy marker, LC3-II. After CQ treatment, TUG1 knockdown-induced autophagy was inhibited, leading to the accumulation of LC3-II, and the expression of P21 was stimulated (). Therefore, we speculate that increased expression of P21 may be a feedback regulation by the accumulation of LC3-II. To visualize the autophagic activity, the formation of GFP-LC3 puncta was examined in KGN cells using a confocal laser microscope. Expectedly, a significant increase in the number of GFP-LC3 puncta was observed in TUG1-silenced cells under treatment with CQ (). An additional increase in LC3-II levels and numbers of GFP-LC3 puncta, and decrease in P62 levels, were observed in the presence of CQ, suggesting that TUG1 knockdown increased autophagic flux.
Protein levels of p-ERK, p-JNK, p-38 MAPK and P21 are decreased in hLGCs obtained from PCOS patients
Next, we assessed the total and phosphorylated levels of ERK, JNK and p38 MAPK, and the levels of P21 in hLGCs obtained from patients with and without PCOS (12 patients with PCOS versus 12 controls). As shown in , protein levels of p-ERK, p-JNK, p-p38 MAPK and P21 were significantly decreased in hLGCs obtained from women with PCOS, while the total levels of ERK, JNK and p38 MAPK were no different between the two groups, suggesting negative correlations between TUG1 expression and protein levels of P21 and phosphorylated MAPKs.
Figure 5. Levels of P21 and MAPKs in hLGCs; effects of TUG1 knockdown on aromatase expression and oestradiol (E2) biosynthesis in KGN cells. (A and B) The expression of ERK, JNK, p38 MAPK, p-ERK, p-JNK, p-p38 MAPK, and P21 in hLGCs obtained from patients with PCOS (n = 12) and healthy controls (n = 12) was assessed by western blotting. ImageJ software was used to analyse and normalize band intensity, and expression levels were normalized to that of GAPDH. (C-F) Cells were cultured for 24 h in the presence of androstenedione (100 nM) after transfection with the corresponding LNA GapmeRs. Aromatase mRNA levels (CYP19A1) were measured by qRT-PCR, and GapmeR Ctrl was set to 1 (C). Aromatase protein expression was assessed by western blotting. ImageJ software was used to analyse and normalize band intensity, and expression levels were normalized to that of GAPDH (D and E). E2 accumulation in KGN cell supernatant was measured by a chemiluminescence assay (F). Data are expressed as mean ± SD. *P < 0.05, **P < 0.01, ***P < 0.001
TUG1 knockdown promotes aromatase expression and estradiol biosynthesis
To explore the effects of TUG1 knockdown on steroidogenesis, we induced TUG1 knockdown in KGN cells, and then treated these cells with 100 nM androstenedione for 24 h; then, we assessed the relative levels of CYP19A1 mRNA and protein levels of aromatase via qRT-PCR and western blotting, respectively. Our results show that TUG1 knockdown markedly increased the levels of CYP19A1 mRNA and protein levels of aromatase (). TUG1 knockdown increased oestradiol (E2) accumulation in KGN cells (). These results suggest that TUG1 knockdown stimulated aromatase expression and E2 biosynthesis.
Androstenedione and FSH levels do not affect TUG1 expression
Given the hyperandrogenism, the required supraphysiologic stimulation with Gn, and the difference in dosing required between PCOS cases and controls, we treated KGN cells with a vehicle control, androstenedione (100 nM), or combined FSH (0.2 IU/mL) and androstenedione, for 48 h to determine the effects of FSH and androgen on TUG1 expression. Our results show that treatment with androstenedione, or combined treatment with FSH and androstenedione, did not affect TUG1 levels in KGN cells (Supplementary Fig. S2). Our results suggest that TUG1 expression may be not affected by the levels of androstenedione and FSH.
Impact of insulin treatment on TUG1 expression
Hyperinsulinemia is one of the most characteristics of PCOS. Therefore, we evaluated the effects of insulin by adding 1, 10, or 100 ng/mL insulin into the culture media of KGN cells. As shown in Supplementary Fig. S3, TUG1 expression in KGN cells treated with insulin for 24 h did not differ from that of controls. Our results indicate that insulin levels may do not affect TUG1 expression.
Discussion
Our results show that TUG1 expression was markedly increased in PCOS GCs compared with that of controls; this increase in TUG1 expression was related to increased AFC. ROC curve showed a significant separation between patients with PCOS and controls, indicating that TUG1 may be a potential diagnostic biomarker for PCOS. TUG1 was predominantly localized in the nuclei of human GCs. Using in vitro analysis, we found that TUG1 silencing inhibited cell proliferation, which may be correlated with the increase of cellular apoptosis and autophagy. TUG1 knockdown regulated apoptosis in MAPKs pathway-dependent manner and autophagy in a P21-dependent manner. Moreover, TUG1 knockdown increased aromatase expression and E2 biosynthesis in GCs.
PCOS is a multifactorial endocrine disorder characterized by hyperandrogenism and anovulatory infertility. Ordinarily, patients with PCOS have more follicles than non-PCOS individuals, but these follicles fail to become dominant follicles. Thus, numerous patients with PCOS ultimately require assisted reproductive technology (ART) to address their infertility. Ovarian hyperstimulation syndrome (OHSS) is a primary complication of ART and is especially associated with women having increased AFC and/or PCOS. In our present study, AFC levels were increased in patients with PCOS compared with the levels of control participants. Elevated GC proliferation in early-growing follicles is also common in women with PCOS [Citation32]. Hence, GC dysfunction in patients with PCOS may contribute to PCOS pathology.
LncRNAs, which were initially regarded as spurious transcriptional noise, are pivotal in fundamental cellular processes and disorders such as PCOS. Several lncRNAs, including LINC-01572:28 [Citation8], HOTAIR [Citation33], H19 [Citation13], are associated with PCOS. Most of these lncRNAs are highly abundant and conserved genes that play essential roles in various diseases; the highly conserved sequences of these lncRNAs are associated with critical physiological functions.
TUG1 is important in the lncRNA family because of its evolutionarily conserved sequences and extensive expression in mammals. Recent studies have highlighted its function in tumorigenesis, but whether it plays tumour-suppressive or oncogenic roles remains unclear. Additionally, few studies have explored the involvement of TUG1 in the regulation of ovarian cell functions or its involvement in PCOS. To the best of our knowledge, our present study is the first to show that TUG1 expression is elevated in PCOS GCs, and that this increased TUG1 expression is related to increased levels of AFC. We assessed the diagnostic value of TUG1 in the GCs of patients with PCOS using ROC curve analysis. ROC curve indicates that TUG1 alone was sufficient for effectively distinguishing patients with PCOS from participants without PCOS. Furthermore, increased GC proliferation is observed in PCOS [Citation34], which agrees with our findings showing that knockdown of TUG1 led to decreased GC proliferation. Therefore, upregulated TUG1 expression in PCOS GCs may increase GC proliferation and contribute to excess antral follicles.
LncRNAs stimulate cellular proliferation by mechanisms such as suppression of cellular apoptosis or/and autophagy and acceleration of cell-cycle progression [Citation35,Citation36]. In our present study, we found that TUG1 silencing promoted apoptosis and autophagy, but may not affect cell-cycle progression, in GCs.
Both apoptosis and autophagy are highly conserved processes that play pivotal roles in cellular proliferation, death, and homoeostasis, as well as in physiologic processes. Dysfunction of these regulatory pathways results in various human diseases [Citation37,Citation38]. Apoptosis is orchestrated by caspases, a family of cysteine proteases that specifically cleave proteins at aspartic acid residues [Citation39]. Initiation and execution of apoptosis are modulated by Bcl-2 and the caspase family of proteins [Citation40,Citation41]. Activation of the Bcl-2 family members Bax and Bak leads to the release of pro-apoptotic proteins, including cytochrome c, from the mitochondrial inter-membrane space into the cytosol [Citation42,Citation43,Citation44]. Cytochrome c can bind Apaf-1 forming the apoptosome and stimulating activation of caspase-9. Activated caspase-9 then directly cleaves and stimulates caspase-3 [Citation45,Citation46]. Our results show that apoptotic activity, induced by TUG1 knockdown in KGN cells, may be related to the activated Bax/Bak and caspase-9/caspase-3. The MAPKs pathway, which includes ERKs, JNKs, and p38 MAPK subfamilies, modulates cellular proliferation. The ERK/MAPK pathway is currently the best-characterized MAPKs pathway. Abnormal activation of the MAPKs pathway can promote apoptosis [Citation47,Citation48]. Therefore, we used western blotting to assess changes in the activity of the MAPKs pathway, and interactions between this pathway and apoptosis, in TUG1-knockdown KGN cells. Our results show that the MAPKs pathway was abnormally activated in TUG1-knockdown KGN cells. Furthermore, inhibition of the ERK/MAPK pathway using U0126 could attenuate or reverse the high levels of apoptotic proteins and increased numbers of apoptotic cells induced by TUG1 knockdown. This further suggests that the MAPKs pathway was involved in TUG1-mediated apoptosis.
Autophagy not only protects cells from cellular metabolic stress but also functions as an inhibitor of cell proliferation [Citation49,Citation50]. In KGN cells, TUG1 knockdown induces the accumulation of autophagosomes, shown by redistribution of diffused LC3 to punctate structures, increased LC3-II expression and decreased P62 expression in KGN cells. Thus far, the molecular mechanisms linking the induction of autophagy and TUG1 expression are not well documented. Accumulating evidence indicates that P21 plays a pivotal role in autophagy [Citation51]. The P21 protein is one of the key signals causing autophagic cell death. Li et al. reported that up-regulated expression of P21, following treatment with oridonin, enhances autophagy in human prostate cancer cells [Citation30]. Mohapatra et al. reported that quinacrine-mediated autophagy in colon cancer cells occurs via P21-dependent mechanism [Citation52]. Similarly, we found that P21 was involved in TUG1-modulated autophagy in KGN cells.
Hormonal abnormalities and ovarian dysfunction play important roles in PCOS [Citation53,Citation54]. Aromatase, encoded by the CYP19A1 gene, is a rate-limiting enzyme that catalyzes the conversion of androgen to oestrogen during steroidogenesis. Reduced aromatase activity may lead to PCOS development [Citation55,Citation56]. Targeted disruption of the CYP19A1 gene in mice stimulates the ovaries to generate abundant follicles accompanied by increased GC numbers [Citation57]. Women with defective mutations in CYP19A1 show features typical of PCOS [Citation58]. Aromatase conversion activity is reduced in PCOS follicular fluid compared with that obtained from women without PCOS, while GCs obtained from the antral follicles of patients with PCOS show lower aromatase activity compared with those of controls [Citation59]. Suppression of aromatase activity at the time of initial aromatase expression may attenuate increased E2 production, which can be crucial for dominant-follicle development [Citation60]. Modulation of aromatase expression in human cells is stimulated or attenuated by diverse hormones used in the COH protocol, highlighting the complexity of E2 biosynthesis in the human body. Therefore, in our present study, we explored the effects of TUG1 knockdown on aromatase expression and E2 biosynthesis in KGN cells. Our results show that TUG1 knockdown increased aromatase expression and E2 biosynthesis, indicating that TUG1 may affect follicle growth and disturb the selection of dominant follicle by modulating GC steroidogenesis.
Our study had several limitations exist in the current research. First, human GCs were extracted from patients undergoing IVF/ICSI, and ovarian hyperstimulation may have affected TUG1 expression. Second, the extraction of primary cells unavoidably involves contamination with other components such as blood cells; hence, it is important to identify the biological function of TUG1 in human GC-derived cell lines, such as KGN cells. Third, TUG1 knockdown increased the expression of P21; P21 is a key regulator of the G1-phase cell cycle checkpoint. Intriguingly, flow cytometry analyses showed that TUG1 knockdown did not affect the cell-cycle distributions of KGN cells. TUG1 may simultaneously influence other cell-cycle regulators to maintain normal progression of cell cycle. In addition, information on the involvement of cell cycle regulators in autophagy regulation has increased [Citation61]. However, the specificity of autophagy in cell cycle regulation should be clarified. Furthermore, our current study only explored the effects of TUG1 knockdown on GC function. Therefore, future studies should examine how TUG1 overexpression influences GC function. Finally, because of the multifaceted nature of PCOS, a single gene or genetic signal does not adequately explain genetic susceptibility to PCOS. Thus, future studies need to analyse how interactions within the genetic network may contribute to PCOS development.
In summary, increased TUG1 expression in PCOS GCs may contribute to excessive follicle activation and growth and disturb the selection of dominant follicle by modulating GC proliferation and steroidogenesis. TUG1 has potential diagnostic value in PCOS. Therefore, the discovery of TUG1 and its molecular mechanisms has improved our understanding of genetic regulatory networks and brought a novel insight into the pathogenesis of PCOS. Also, if TUG1 proves to be an accurate and reliable diagnostic tool, PCOS women can get diagnosed sooner, and can be treated sooner, resulting in less issues later in life.
Material and Methods
The research was approved by the Ethics Committee of Nanfang Hospital of Southern Medical University (Guangzhou, China), and written informed consent was obtained from all participants. This research follows the principles of the Declaration of Helsinki.
Patients
Human luteinized GC samples were isolated from the pre-ovulatory follicles of 200 participants with or without PCOS undergoing in vitro fertilization (IVF) or intracytoplasmic sperm injection (ICSI) programme at the Nanfang Hospital during the period of 5 February 2016 to 30 May 2019. The diagnosis of PCOS was made according to the Rotterdam revised criteria [Citation2]. All control participants had normal menstrual cycles (26–35 days) and ovarian reserve and morphology; these participants showed no evidence of hyperandrogenism, the definition of which was limited to tubal disease or male factor and assessed using biochemical or clinical tests. The COH protocol for patients entering the IVF/ICSI programme included stimulus with recombinant follicle-stimulating hormone (FSH; Gonal F, Merck Serono, Modugno, Italy), highly purified FSH (Lishenbao, Livzon, Guangdong, China) and cetrorelix (Cetrotide, Merck Serono, Halle, Germany), followed by the administration of hCG (Libao Biochemistry Co. Zhuhai, China) and triptorelin (Diphereline, IPSEN, Signes, France) via injection at 34 to 36 h before oocyte retrieval. Additionally, basal levels of sex hormones on day 2–3 of the participants’ menstrual cycles were determined by a chemiluminescence kit (Roche Diagnostics, Basel, Switzerland). GC samples were purified by density centrifugation from follicular aspirates collected from women undergoing oocyte retrieval, as described previously [Citation62] (see Supplementary Data).
Cell culture
The KGN cell line was obtained from RIKEN BioResource Centre (Tsukuba, Japan). KGN cells were cultured in a humidified incubator at 5% CO2 using a DMEM/nutrient mixture F-12 Ham (DMEM/F12; HyClone, Logan, UT, USA) medium supplemented with 10% foetal bovine serum (FBS; HyClone). For inhibition of the ERK/MAPK pathway, KGN cells were pretreated for 24 h with 20 μM ERK/MAPK inhibitor U0126 (Beyotime, Shanghai, China), and then transfected with corresponding LNA GapmeRs. For assessment of autophagic flux, KGN cells were treated for 4 h with 30 μM chloroquine (CQ, Sigma, USA), which is a lysosomal inhibitor, and then harvested.
Cell transfection
LncRNAs were targeted using locked nucleic acid (LNA)-modified phosphorothioate oligonucleotide technology (Exiqon, Vedbaek, Denmark). The sequences of LNA GapmeRs targeting TUG1 were: TUG1 GapmeR-1: 5ʹ-GCTAGTCAACCAGATT-3ʹ, TUG1 GapmeR-2: 5ʹ-GAGTATGGCAGGATTA-3ʹ. The sequence of control LNA GapmeR (GapmeR Ctrl) was: 5ʹ-AACACGTCTATACGC-3ʹ. The sequences of small interfering RNAs (siRNAs) targeting P21 were as follows: sense, 5ʹ-CCUCUGGCAUUAGAAUUAUTT-3ʹ and antisense, 5ʹ-AUAAUUCUAAUGCCAGAGGTT-3ʹ. KGN cells, grown to 30–40% confluence, were transfected for 48 h with 25 nM LNA GapmeRs or siRNA using Lipofectamine RNAiMax (Life Technologies, Carlsbad, CA, USA) according to the manufacturer’s instructions. qRT-PCR was then used to detect the efficiency of RNA silencing.
Nuclear and cytoplasmic RNA fractionation
Cytoplasmic and nuclear extracts were obtained using a Nuclear/Cytoplasmic Isolation Kit (PARIS Kit, Life Technologies). Briefly, KGN cells were harvested using a cell scraper, washed with cold phosphate buffered saline (PBS), and resuspended in 1 ml PBS. The cells were then centrifuged at 500 g for 5 min at 4◦C. The cell pellet was lysed for 10 min on ice in 500 µl Cell Fractionation Buffer containing RNase inhibitors. The nuclear and cytoplasmic fractions were separated by centrifugation at 500 g and 4◦C for 5 min. The nuclear fraction (pellet) was washed with cold Cell Fractionation Buffer and then lysed in 500 µl of Cell Disruption Buffer. The portion of cytoplasmic fraction or nuclear lysate that was going to be used for RNA isolation was combined with an equal volume of 2× Lysis/Binding Solution at room temperature (~25◦C). This mixture was then combined with ACS-grade 100% ethanol, drawn through a filter cartridge, and washed with 700 µl wash solution 1 and with 2 × 500 μl wash solution 2/3. Finally, total RNA from nuclear and cytoplasmic fractions was eluted with 40–60 μl elution solution at ~95°C and again with 10–60 μl elution solution at ~95°C. RNA was extracted with RNAiso Plus (TaKaRa Bio, Shiga, Japan) according to the manufacturer’s instructions. The purity of the resulting fractions was assessed by qRT-PCR.
RNA extraction and qRT-PCR
Total RNA from hLGCs and KGN cells was extracted using RNAiso Plus (TaKaRa Bio) in accordance with the manufacturer’s instructions. RNA was then recovered via phenol/chloroform/isoamyl alcohol (PCA) extraction and ethanol precipitation. RNA concentration was analysed using a NanoDrop 8000 spectrophotometer (Thermo Scientific, America). For the synthesis of cDNA, 1 μg RNA was reverse-transcribed using a PrimeScript RT reagent Kit (TaKaRa Bio) in a 10 or 20-μl reaction volume. Then, cDNA was utilized as a template for qRT-PCR using an SYBR Green PCR kit (TaKaRa Bio) and LightCycler 480 Software (Roche Diagnostics). GAPDH was used as an internal control to normalize gene expression data. Each sample was measured in triplicate. Relative RNA-expression levels were analysed using the 2–ΔΔCT method. Sequences of primers used to amplify TUG1, GAPDH, pre-GAPDH, U6, CYP19A1, and P21 are provided in Supplementary Table S1.
RNA fluorescence in situ hybridization
The subcellular localization of TUG1 in KGN cells was detected using a FISH kit (RiboBio, Guangzhou, China) according to the manufacturer’s protocol. Briefly, KGN cells were grown on cover slips, fixed with 4% paraformaldehyde for 10 min, and then permeabilized in PBS containing 0.5% Triton X-100. Next, the slides were washed and incubated with prehybridization buffer for 30 min at 37°C before hybridization. Hybridization was performed using FISH probes in a moist chamber at 37°C for 12 to 16 h in the dark. Subsequently, the cells were washed and mounted for detection, and 4,6-diamidino-2-phenyl-indole (DAPI) was used to stain the cell nuclei. Imaging was obtained using an FV10i confocal laser microscope (Olympus, Tokyo, Japan).
Ethynyl-2-deoxyuridine assays, Cell Counting Kit-8 assays, western blotting, and flow cytometry
Ethynyl-2-deoxyuridine (EdU) assay, Cell Counting Kit-8 (CCK-8), western blotting, and flow cytometry were conducted as described previously [Citation15,Citation63]. Details of these procedures are provided in Supplementary Data.
Transient transfection and identification of autophagy
A green fluorescent protein (GFP)-LC3 expression vector (GeneCopoeia, Rockville, MD, USA) was used to identify the presence of autophagy. GFP-LC3 expression plasmid (1 μg) was transiently transfected into KGN cells using Lipofectamine 3000 (Life Technologies, Carlsbad, CA, USA) in accordance with the manufacturer’s protocol. Afterwards, the cells were subjected to the different treatments, and then LC3 puncta were observed and analysed using an FV10i confocal laser microscope (Olympus). The numbers of GFP-LC3 puncta were calculated using five randomly selected fields, and were quantified using more than 20 cells per specimen.
Measurement of E2 concentration
E2 secretion in KGN cells was measured by quantitating E2 accumulation in cell culture medium. KGN cells were seeded onto a 24-well plate in serum-free DMEM/F12 medium and cultured overnight. The cells were then transfected with TUG1 GapmeRs or GapmeR Ctrl for 48 h, and then treated with 100 nM androstenedione (Sigma Aldrich) for an additional 24 h. E2 concentration in culture medium was then assayed using a chemiluminescence kit (Roche Diagnostics), and the cells were used for RNA and protein isolation to determine the expression of aromatase.
Statistical analyses
Statistical analyses were performed using GraphPad Prism 5 (GraphPad Software, Inc., La Jolla, CA, USA) and SPSS 16.0 software (SPSS Inc., Chicago, IL, USA). Student’s t-test or Mann–Whitney U test were used to identify statistically significant differences between patients with PCOS and control patients. Correlations between TUG1 expression and clinical characteristics of the patients were analysed using Pearson’s rank correlation. The area under the receiver operating characteristic (ROC) curve (AUC) was used to evaluate the sensitivity and specificity of TUG1 as a diagnostic marker for PCOS. All data are presented as mean ± SD, and P < 0.05 was considered statistically significant.
Supplemental Material
Download Zip (1.2 MB)Disclosure statement
No conflicts of interests are declared by the authors.
Supplementary material
Supplemental data for this article can be accessed here.
Additional information
Funding
References
- Diao FY, Xu M, Hu Y, et al. The molecular characteristics of polycystic ovary syndrome (PCOS) ovary defined by human ovary cDNA microarray. J Mol Endocrinol. 2004;33:59–72.
- Rotterdam ESHRE/ASRM-Sponsored PCOS Consensus Workshop Group. Revised 2003 consensus on diagnostic criteria and long-term health risks related to polycystic ovary syndrome. Fertil Steril. 2004;81:19–25.
- Norman RJ, Dewailly D, Legro RS, et al. Polycystic ovary syndrome. Lancet. 2007;370:685–697.
- Corbett S, Morin-Papunen L. The polycystic ovary syndrome and recent human evolution. Mol Cell Endocrinol. 2013;373:39–50.
- Coticchio G, Dal Canto M, Mignini Renzini M, et al. Oocyte maturation: gamete-somatic cells interactions, meiotic resumption, cytoskeletal dynamics and cytoplasmic reorganization. Hum Reprod Update. 2015;21:427–454.
- Yilmaz B, Vellanki P, Ata B, et al. Metabolic syndrome, hypertension, and hyperlipidemia in mothers, fathers, sisters, and brothers of women with polycystic ovary syndrome: a systematic review and meta-analysis. Fertil Steril. 2018;109:356–64.e32
- Jiao J, Shi B, Wang T, et al. Characterization of long non-coding RNA and messenger RNA profiles in follicular fluid from mature and immature ovarian follicles of healthy women and women with polycystic ovary syndrome. Hum Reprod. 2018;33:1735–1748.
- Zhao J, Xu J, Wang W, et al. Long non-coding RNA LINC-01572:28 inhibits granulosa cell growth via a decrease in p27 (Kip1) degradation in patients with polycystic ovary syndrome. EBioMedicine. 2018;36:526–538.
- Rinn JL, Kertesz M, Wang JK, et al. Functional demarcation of active and silent chromatin domains in human HOX loci by noncoding RNAs. Cell. 2007;129:1311–1323.
- Brown CJ, Ballabio A, Rupert JL, et al. A gene from the region of the human X inactivation centre is expressed exclusively from the inactive X chromosome. Nature. 1991;349:38–44.
- Brannan CI, Dees EC, Ingram RS, et al. The product of the H19 gene may function as an RNA. Mol Cell Biol. 1990;10:28–36.
- Willingham AT, Orth AP, Batalov S, et al. A strategy for probing the function of noncoding RNAs finds a repressor of NFAT. Science (New York, NY). 2005;309:1570–1573.
- Wang Q, Shang J, Zhang Y, et al. Metformin and sitagliptin combination therapy ameliorates polycystic ovary syndrome with insulin resistance through upregulation of lncRNA H19. Cell Cycle (Georgetown, Tex). 2019;18:2538–2549.
- Liu G, Liu S, Xing G, et al. lncRNA PVT1/MicroRNA-17-5p/PTEN axis regulates secretion of E2 and P4, proliferation, and apoptosis of ovarian granulosa cells in PCOS. Mol Ther Nucleic Acids. 2020;20:205–216.
- Li Y, Liu YD, Chen SL, et al. Down-regulation of long non-coding RNA MALAT1 inhibits granulosa cell proliferation in endometriosis by up-regulating P21 via activation of the ERK/MAPK pathway. Mol Hum Reprod. 2019;25:17–29.
- Chai Y, Liu J, Zhang Z, et al. HuR-regulated lncRNA NEAT1 stability in tumorigenesis and progression of ovarian cancer. Cancer Med. 2016;5(7):1588–1598.
- Young TL, Matsuda T, Cepko CL. The noncoding RNA taurine upregulated gene 1 is required for differentiation of the murine retina. Curr Biol. 2005;15:501–512.
- Lin YH, Wu MH, Huang YH, et al. Taurine up-regulated gene 1 functions as a master regulator to coordinate glycolysis and metastasis in hepatocellular carcinoma. Hepatology. 2018;67:188–203.
- Long J, Badal SS, Ye Z, et al. Long noncoding RNA Tug1 regulates mitochondrial bioenergetics in diabetic nephropathy. J Clin Invest. 2016;126:4205–4218.
- Zhang L, Cheng H, Yue Y, et al. TUG1 knockdown ameliorates atherosclerosis via up-regulating the expression of miR-133a target gene FGF1. Cardiovasc pathol. 2018;33: 6–15.
- Chen C, Cheng G, Yang X, et al. Tanshinol suppresses endothelial cells apoptosis in mice with atherosclerosis via lncRNA TUG1 up-regulating the expression of miR-26a. Am J Transl Res. 2016;8:2981–2991.
- Yan HY, Bu SZ, Zhou WB, et al. TUG1 promotes diabetic atherosclerosis by regulating proliferation of endothelial cells via Wnt pathway. Eur Rev Med Pharmacol Sci. 2018;22:6922–6929.
- Dong P, Xiong Y, Yue J, et al. Exploring lncRNA-mediated regulatory networks in endometrial cancer cells and the tumor microenvironment: advances and challenges. Cancers (Basel). 2019;11:234.
- Du SS, Zuo XJ, Xin Y, et al. Expression of lncRNA TUG1 in hypertensive patients and its relationship with change state of an illness. Eur Rev Med Pharmacol Sci. 2020;24:870–877.
- Nishi Y, Yanase T, Mu Y, et al. Establishment and characterization of a steroidogenic human granulosa-like tumor cell line, KGN, that expresses functional follicle-stimulating hormone receptor. Endocrinology. 2001;142:437–445.
- Wang Y, Qi YX, Qi Z, et al. TRPC3 regulates the proliferation and apoptosis resistance of triple negative breast cancer cells through the TRPC3/RASA4/MAPK pathway. Cancers (Basel). 2019;11:558.
- Kabeya Y, Mizushima N, Ueno T, et al. LC3, a mammalian homologue of yeast Apg8p, is localized in autophagosome membranes after processing. Embo J. 2000;19:5720–5728.
- Kabeya Y, Mizushima N, Yamamoto A, et al. LC3, GABARAP and GATE16 localize to autophagosomal membrane depending on form-II formation. J Cell Sci. 2004;117:2805–2812.
- Sahani MH, Itakura E, Mizushima N. Expression of the autophagy substrate SQSTM1/p62 is restored during prolonged starvation depending on transcriptional upregulation and autophagy-derived amino acids. Autophagy. 2014;10:431–441.
- Li X, Li X, Wang J, et al. Oridonin up-regulates expression of P21 and induces autophagy and apoptosis in human prostate cancer cells. Int J Biol Sci. 2012;8:901–912.
- Klionsky DJ, Abeliovich H, Agostinis P, et al. Guidelines for the use and interpretation of assays for monitoring autophagy in higher eukaryotes. Autophagy. 2008;4:151–175.
- Stubbs SA, Stark J, Dilworth SM, et al. Abnormal preantral folliculogenesis in polycystic ovaries is associated with increased granulosa cell division. J Clin Endocrinol Metab. 2007;92(11):4418–4426.
- Jiang B, Xue M, Xu D, et al. Down-regulated lncRNA HOTAIR alleviates polycystic ovaries syndrome in rats by reducing expression of insulin-like growth factor 1 via microRNA-130a. J Cell Mol Med. 2020;24:451–464.
- Das M, Djahanbakhch O, Hacihanefioglu B, et al. Granulosa cell survival and proliferation are altered in polycystic ovary syndrome. J Clin Endocrinol Metab. 2008;93:881–887.
- Cao C, Sun J, Zhang D, et al. The long intergenic noncoding RNA UFC1, a target of MicroRNA 34a, interacts with the mRNA stabilizing protein HuR to increase levels of beta-catenin in HCC cells. Gastroenterology. 2015;148:415–26.e18.
- Gomes LC, Odedra D, Dikic I, et al. Autophagy and modular restructuring of metabolism control germline tumor differentiation and proliferation in C. elegans. Autophagy. 2016;12:529–546.
- Jiang P, Mizushima N. Autophagy and human diseases. Cell Res. 2014;24:69–79.
- Sankari SL, Masthan KM, Babu NA, et al. Apoptosis in cancer–an update. Asian Pac J Cancer Prev. 2012;13:4873–4878.
- Parrish AB, Freel CD, Kornbluth S. Cellular mechanisms controlling caspase activation and function. Cold Spring Harb Perspect Biol. 2013;5:a008672.
- Danial NN, Korsmeyer SJ. Cell death: critical control points. Cell. 2004;116:205–219.
- Galluzzi L, Vitale I, Aaronson SA, et al. Molecular mechanisms of cell death: recommendations of the nomenclature committee on cell death 2018. Cell Death Differ. 2018;25:486–541.
- Wei MC, Lindsten T, Mootha VK, et al. tBID, a membrane-targeted death ligand, oligomerizes BAK to release cytochrome c. Genes Dev. 2000;14:2060–2071.
- Eskes R, Desagher S, Antonsson B, et al. Bid induces the oligomerization and insertion of Bax into the outer mitochondrial membrane. Mol Cell Biol. 2000;20:929–935.
- Wei MC, Zong WX, Cheng EH, et al. Proapoptotic BAX and BAK: a requisite gateway to mitochondrial dysfunction and death. Science (New York, NY). 2001;292:727–730.
- Li P, Nijhawan D, Budihardjo I, et al. Cytochrome c and dATP-dependent formation of Apaf-1/caspase-9 complex initiates an apoptotic protease cascade. Cell. 1997;91:479–489.
- Srinivasula SM, Ahmad M, Fernandes-Alnemri T, et al. Autoactivation of procaspase-9 by Apaf-1-mediated oligomerization. Mol Cell. 1998;1:949–957.
- Krifka S, Hiller KA, Bolay C, et al. Function of MAPK and downstream transcription factors in monomer-induced apoptosis. Biomaterials. 2012;33:740–750.
- Arimoto K, Fukuda H, Imajoh-Ohmi S, et al. Formation of stress granules inhibits apoptosis by suppressing stress-responsive MAPK pathways. Nat Cell Biol. 2008;10:1324–1332.
- Liu S, Fei W, Shi Q, et al. CHAC2, downregulated in gastric and colorectal cancers, acted as a tumor suppressor inducing apoptosis and autophagy through unfolded protein response. Cell Death Dis. 2017;8:e3009.
- Wang X, Li Y, Fan Y, et al. PTBP1 promotes the growth of breast cancer cells through the PTEN/Akt pathway and autophagy. J Cell Physiol. 2018;233:8930–8939.
- Fujiwara K, Daido S, Yamamoto A, et al. Pivotal role of the cyclin-dependent kinase inhibitor p21WAF1/CIP1 in apoptosis and autophagy. J Biol Chem. 2008;283:388–397.
- Mohapatra P, Preet R, Das D, et al. Quinacrine-mediated autophagy and apoptosis in colon cancer cells is through a p53- and p21-dependent mechanism. Oncology Research Featuring Preclinical and Clinical Cancer Therapeutics. 2012;20(2):81–91.
- De Leo V, Musacchio MC, Cappelli V, et al. Genetic, hormonal and metabolic aspects of PCOS: an update. ReprodBiol Endocrinol. 2016;14:38.
- Bakhshalizadeh S, Amidi F, Alleyassin A, et al. Modulation of steroidogenesis by vitamin D3 in granulosa cells of the mouse model of polycystic ovarian syndrome. Syst Biol Reprod Med. 2017;63:150–161.
- Gabrilove JL. The pathogenesis of the polycystic ovary syndrome: a hypothesis. Endocr Pract. 2002;8:127–132.
- Grumbach MM, Auchus RJ. Estrogen: consequences and implications of human mutations in synthesis and action. J Clin Endocrinol Metab. 1999;84:4677–4694.
- Fisher CR, Graves KH, Parlow AF, et al. Characterization of mice deficient in aromatase (ArKO) because of targeted disruption of the cyp19 gene. Proc Natl Acad Sci U S A. 1998;95:6965–6970.
- Belgorosky A, Pepe C, Marino R, et al. Hypothalamic-pituitary-ovarian axis during infancy, early and late prepuberty in an aromatase-deficient girl who is a compound heterocygote for two new point mutations of the CYP19 gene. J Clin Endocrinol Metab. 2003;88:5127–5131.
- Naessen T, Kushnir MM, Chaika A, et al. Steroid profiles in ovarian follicular fluid in women with and without polycystic ovary syndrome, analyzed by liquid chromatography-tandem mass spectrometry. Fertil Steril. 2010;94:2228–2233.
- Jakimiuk AJ, Weitsman SR, Brzechffa PR, et al. Aromatase mRNA expression in individual follicles from polycystic ovaries. Mol Hum Reprod. 1998;4:1–8.
- Zheng K, He Z, Kitazato K, et al. Selective autophagy regulates cell cycle in cancer therapy. Theranostics. 2019;9:104–125.
- Kaur S, Archer KJ, Devi MG, et al. Differential gene expression in granulosa cells from polycystic ovary syndrome patients with and without insulin resistance: identification of susceptibility gene sets through network analysis. J Clin Endocrinol Metab. 2012;97:E2016–21.
- Li Y, Liu YD, Zhou XY, et al. MiR-29a regulates the proliferation, aromatase expression, and estradiol biosynthesis of human granulosa cells in polycystic ovary syndrome. Mol Cell Endocrinol. 2019;498:110540.