
ABSTRACT
SYNCRIP, a member of the cellular heterogeneous nuclear ribonucleoprotein (hnRNP) family of RNA binding proteins, regulates various aspects of neuronal development and plasticity. Although SYNCRIP has been identified as a component of cytoplasmic RNA granules in dendrites of mammalian neurons, only little is known about the specific SYNCRIP target mRNAs that mediate its effect on neuronal morphogenesis and function. Here, we present a comprehensive characterization of the cytoplasmic SYNCRIP mRNA interactome using iCLIP in primary rat cortical neurons. We identify hundreds of bona fide SYNCRIP target mRNAs, many of which encode for proteins involved in neurogenesis, neuronal migration and neurite outgrowth. From our analysis, the stabilization of mRNAs encoding for components of the microtubule network, such as doublecortin (Dcx), emerges as a novel mechanism of SYNCRIP function in addition to the previously reported control of actin dynamics. Furthermore, we found that SYNCRIP synergizes with pro-neural miRNAs, such as miR-9. Thus, SYNCRIP appears to promote early neuronal differentiation by a two-tier mechanism involving the stabilization of pro-neural mRNAs by direct 3ʹUTR interaction and the repression of anti-neural mRNAs in a complex with neuronal miRISC. Together, our findings provide a rationale for future studies investigating the function of SYNCRIP in mammalian brain development and disease.
Introduction
SYNCRIP (also known as hnRNP-Q or NASIP) is a sequence-specific RNA-binding protein (RBP) with widespread expression in multiple organisms and tissues throughout development. It belongs to the hnRNP family of RRM-containing RBPs which have well-documented roles in the control of alternative splicing, but recently also have been shown to regulate RNA metabolism in the cytoplasm (e.g. mRNA stability, transport and translation). Originally, SYNCRIP was identified by virtue of its association with several isoforms of the presynaptic protein Synaptotagmin [Citation1], thereby pointing to an important neuronal function of the protein. However, later studies demonstrated important roles of SYNCRIP in other tissues, e.g. as part of the translational GAIT complex in immune cells [Citation2], as well as cancer [Citation3]. In biochemical studies, SYNCRIP was isolated as part of protein complexes involved in RNA transport in neuronal processes [Citation4–7]. A function of SYNCRIP in neuritogenesis is further supported by loss-of-function studies in [Citation42] rodent primary neurons [Citation8,Citation9], where SYNCRIP represses neurite outgrowth and dendrite complexity. Mechanistically, SYNCRIP appears to regulate the dynamics of the actin cytoskeleton by controlling the expression of signalling molecules, such as RhoA [Citation8], Cdc42 [Citation9] and GAP-43 [Citation10]. More recently, SYNCRIP was also associated with the microRNA (miRNA) pathway, either as regulator of the miRNA effector complex at the level of poly-adenylation [Citation11], as part of the exosomal miRNA sorting machinery [Citation12,Citation13] or most recently as part of the miRNA biogenesis pathway [Citation14]. Studies in flies further contributed to our understanding of SYNCRIP function and largely support its role in neuronal development. There, it is part of the RNA localization machinery in oocytes [Citation15] and regulates synaptic transmission and morphology at the Drosophila neuromuscular junction (NMJ) [Citation16–18]. Intriguingly, SYNCRIP might in addition promote the late neural stem cell fate by controlling the translation of the transcription factor chinmo [Citation19].
Altogether, a picture is emerging whereby post-transcriptional control of cytoplasmic gene expression by [Citation6] SYNCRIP might have a uniquely important role at the transition from a late neural stem cell stage to post-mitotic neurons. However, to better understand the specific roles played by SYNCRIP, a more comprehensive knowledge about its downstream targets is required. RNA-IP followed by microarray or RNA sequencing has been performed in N2A cells [Citation9] and the Drosophila brain [Citation16] in an effort to identify SYNCRIP targets at a genomic scale. However, these approaches suffered from several limitations. First, the low stringency that can be achieved by conventional RNA-IP likely led to the discovery of many false-positive targets. Second, RNA-IP did not provide any information regarding the specific [Citation17] binding sites within target RNA. Third, Chen et al. used overexpression of Flag-tagged SYNCRIP in a neuronal cell line, which is an artificial system and does not necessarily recapitulate binding properties of endogenous SYNCRIP. Finally, these previous approaches did not take into account the differential sub-cellular localization of SYNCRIP isoforms. Therefore, we performed SYNCRIP individual-nucleotide resolution UV cross-linking and immunoprecipitation (iCLIP) specifically in the cytoplasmic fraction of primary rat neurons as a way to delineate the cytoplasmic RNA interactome of endogenous SYNCRIP in post-mitotic mammalian neurons. Thereby, we obtained evidence that cytoplasmic SYNCRIP binds mostly to the 3ʹUTR of neuronal mRNAs. SYNCRIP targets are enriched for genes involved in neuronal differentiation. Many of these genes encode for components of the microtubule cytoskeleton, implicating the regulation of microtubule dynamics in SYNCRIP functions, such as neurito- and synaptogenesis. Based on these findings, we postulate a model for a novel function of SYNCRIP at the transition from the neural progenitor to the fully differentiated neural stage.
Materials and methods
Primary neuronal culture, transfection, nucleofection
Primary cortical and hippocampal neuron cultures were prepared from embryonic day 18 (E18) Sprague-Dawley rats (Charles River Laboratories) as previously described [Citation20]. Neurons were cultured in Neurobasal (NB) medium containing 2% B27 supplement, penicillin-streptomycin (100 U/ml penicillin, 100 µg/ml streptomycin), and GlutaMax (1 mM). All reagents were purchased from Thermo Fisher Scientific. Neuron-enriched cultures were obtained by adding Floxuridine (FUDR) (10 µM) at DIV0. Transfection of neurons was performed with Lipofectamine 2000 (Thermo Fisher Scientific). Per single well of a 24-well plate, 1 μg DNA was mixed with a 1:50 dilution of Lipofectamine 2000 in 100 µl NB medium and incubated at RT for 20 min. The DNA/lipofectamine mixture was added into each well containing 400 µl of NB medium and incubated for 2 h. Nucleofection of primary cortical neurons at DIV0 was performed using the 4D-Nucleofector kit (Lonza), the P3 Primary Cell solution and programme DC-104, according to the manufacturer’s instructions.
Plasmids and oligonucleotides
SYNCRIP X3 and X7 were amplified from rat cortical neuron culture cDNA library and cloned between SalI and AgeI restriction sites of pEGFP-N1 (Clontech). X6 isoform was inserted between XhoI and EcoRI restriction sites of pEGFP-C1 (Clontech). Histone stem loop (HSL) and hammerhead ribozyme (HhR) sequences from RL-5BoxB-HSL+HhR (kind gift from W. Filipowicz) were cloned between SpeI and ClaI restriction sites of pISI1. Two consecutive Let-7 binding sites (BS) from pIS1-HMGA2-3ʹUTR (D. Bartel, Addgene) were cloned between SacI and XbaI restriction sites of pIS1 to obtain pIS1-2xLet7 BS and −2xLet7 BS-mut vectors. The 2xmiR-9 BS was designed to have mismatches to nucleotides 10–12, 20–21 and 23 of mature miR-9 and cloned either into pIS1 or pISI1-HSL-HhR. The previously described DCX 3ʹUTR fragment 1 [Citation21] was cloned into pmirGLO. For knockdown experiments, pSuper vectors containing either a Syncrip targeting (shRNA-1: TGAGAAAGCTGGACCTATA; shRNA-2: GATCAGAAGAGGAAAGAAA; cyt-shRNA: GATCAGAGCTTATACCTAA) or a scrambled sequence (shControl, AAACCTTGTGGTCCTTAGG [Citation22]) were cloned. For sequences of oligonucleotides used for cloning see supplementary data.
Nuclear fractionation protocol
Nucleo-cytoplasmic fractionation of cortical neurons at DIV7 was performed as previously described [Citation23]. In brief, 40 million cells from cortical cultures at DIV7 were used. Cells were washed once with ice-cold 1 x Phosphate buffered saline (PBS; Thermo Fisher Scientific), pelleted by centrifugation at 100 g for 5 min at 4°C. Subsequently, the cell pellet was resuspended in 600 μl of ice-cold hypotonic homogenization buffer (HHB; 10 mM KCl, 1.5 mM MgCl2, 1 mM Ma-EDTA, 1 mM Na-EGTA, 10 mM Tris-HCl pH = 7.4, 1 mM DTT, 2 u/ul RNasin Plus RNase inhibitor (Promega)) and was incubated on ice for 30 min. After supplying cell suspension with 600 μl of 0.2% Igepal CA630 containing HHB, it was homogenized with 40 strokes in a Dounce potter. From the obtained cell lysate, nuclear and cytoplasmic fractions were separated by centrifugation at 720 g for 5 min at 4°C. The nuclear fraction (pellet) was washed three times with 1.5 mL of isotonic homogenization buffer (IHB; HHB, supplemented with 250 mM sucrose). The total protein from nuclear (pellet) and cytoplasmic (supernatant) fractions were extracted using peqGOLD TriFast reagent (Peqlab) as per manufacturer’s instructions.
Western blotting
Protein extracts, obtained by lysing cells in lysis buffer (50 mM Tris-pH: 7.5, 150 mM NaCl, 1% Triton-X100, 1x Complete Protease Inhibitor Cocktail (Roche)), were supplemented with Laemmli loading buffer, separated by 10% SDS-PAGE and transferred overnight at 4°C with 27 V onto a poly-vinylidene difluoride (PVDF) membrane (GE Healthcare) using a mini-Protean electrophoresis system (Biorad). Non-Specific antibody binding was blocked in Tris-buffered saline containing 5% milk powder and 0.2% Tween 20 (TBS-T/milk). Antibody dilutions (mouse anti-hnRNPQ (1:1600, clone 18E4, Sigma), rabbit anti-hnRNPQ (1:1000, ab199417, Abcam), rabbit anti-Tubulin (1:5000, clone 11H10, Cell signalling), rabbit anti-Doublecortin (1:1500, ab18723, Abcam), mouse anti-MAP2 (1:5000, clone Hm-2, Sigma), mouse anti-Vinculin (1:5000, MAB3574, Millipore), rat anto-AGO2 (1:10, clone 6F4, a kind gift from G. Meister), mouse anti-GAPDH (1:1000, #5718, R&D systems) and rabbit anti-HDAC2 (1:1000, ab32117, Abcam)) were prepared in TBS-T/milk. Membranes were incubated with antibody dilutions for 2 hours at RT. After three washes with TBS-T/milk, the membrane was treated with HRP (horseradish peroxidase)-conjugated secondary antibodies in TBS-T/milk for 1 h. Then membranes were washed three times with TBS-T before developing with Amersham ECLplus reagent (GE Healthcare) for 5 min in the dark.
Immunocytochemistry
For immunostaining, hippocampal neurons were once washed with PBS, fixed for 15 min at RT in 4% paraformaldehyde/sucrose, rinsed in PBS and sequentially incubated with mouse anti-hnRNPQ (1:1500, clone 18E4, Sigma) and anti-mouse-Alexa Fluor 546 (Thermo Fisher Scientific), both diluted in 0.02% (wt/vol) gelatin–0.5% (vol/vol) Triton X-100–PBS. After five washes with PBS, coverslips were mounted on microscope slides using AquaPoly/mount (Polysciences Inc.).
iCLIP
iCLIP procedure was performed according to [Citation24] with some modifications. Rat primary cortical neurons (DIV6) grown on 10 cm plates at a density of 10 million cells/plate were subjected to UV-C irradiation (300 mJ/cm2, CROSSLINKER (BLX-254)). Cell pellets were resuspended in lysis buffer (10 mM Tris-HCl (pH = 7.5), 100 mM NaCl, 0.25% Igepal CA630, 1 mM EDTA, 1x Complete Protease Inhibitor Cocktail), incubated on ice for 10 min and homogenized with 20 stokes in a teflon-coated Dounce-Potter. Cell debris, including nuclei, were removed by centrifugation at 13,000 rpm for 10 min at 4°C. Partial digestion (low RNase I) of RNA was carried out for 3 min at 37°C with 10 µl of diluted (1:70) RNase I (#10,330,065, Thermo Fischer Scientific) per 1 mL of cleared cell lysate. SYNCRIP protein was immunoprecipitated with 10 µg of mouse anti-hnRNPQ antibody (clone 18E4, Sigma) coupled to 50 µl of Dynabeads Protein G (#10004D, Thermo Fischer Scientific) for 2 hours at 4°C. As a control for unspecific binding, mAb IgG1 Isotype (#5415, Cell signalling) was applied. Beads were washed 4x with lysis buffer and 3x with polynucleotide kinase (PNK) buffer (20 mM Tris–HCl (pH = 7.4), 10 mM MgCl2, 0.2% Tween-20). Immunoprecipitated RNA was dephosphorylated with T4 PNK (Thermo Fischer Scientific) and ligated to pre-adenylated linker L3. 5ʹ end 32P-γ-ATP (Perkin Elmer) labelled RNA-SYNCRIP complexes, corresponding to ~70-150 kDa size on PAGE, were extracted from nitrocellulose membrane. After treatment of RNA-protein complexes with Proteinase K (Roche) and subsequent isolation of RNA, a reverse transcription reaction was performed using Superscript III (Thermo Fischer Scientific) and RT1-6clip primers containing unique molecular identifiers (UMI). Three different sizes of cDNA – 70-80 nt (low), 80–150 nt (medium) and 150–200 nt (high) – were extracted from a TBE-Urea gel. cDNA was circularized with CircLigase II (Epicentre) and then linearized using FastDigest BamHI (Thermo Fischer Scientific). PCR amplification of cDNA with 23 (for medium-sized cDNA) – 25 (low) – 30 (high) cycles were performed using Accuprime Supermix 1 enzyme (Thermo Fischer Scientific). In order to create a mixed iClip library, different sized PCR products were cleaned via MinElute PCR Purification Kit (Qiagen) and pooled together in a ratio of 1 (high):8 (medium):2 (low). The quality and size distribution of iClip library was determined with Bioanalyzer 2100 (Agilent). iClip library was sequenced for 50 cycles on Illumina HiSeq2000 platform by EMBL genomic core facility (Heidelberg, Germany). Primers and oligonucleotides used for iCLIP library generation are provided as supplementary data.
iCLIP data analysis
Raw sequencing reads were trimmed from 3ʹ-adapter (AGATCGGAAGAGCGGTTCAG) and filtered according to quality and length using default parameters of Fastx-Toolkit for fastq data on Galaxy, a web-based genome analysis tool [Citation25]; https://usegalaxy.org]. Unique sequencing reads were obtained by collapsing sequencing reads that contain the same UMI, which removes PCR overamplification artefacts. After removal of 5ʹ barcode and UMI, unique reads longer than 15 nt were mapped to the rat genome (RGSC Rnor_6.0) with STAR RNA-aligner software [Citation26] using default parameters (suppl. Table T1). Unique reads that map to the best single genomic position were used as an input for the peak-caller software Piranha (http://smithlabresearch.org/software/piranha/) [Citation27]. In order to find bona-fide unique crosslink sites of SYNCRIP, a two-step procedure was applied. First, SYNCRIP peaks with a < 0.05 false discovery rate (FDR) were called using Piranha software with a -bin_size = 1 (with this parameter, only the first nucleotide at the 5ʹ end of unique sequence read, which is equivalent to +1 nt of the crosslink site, will be taken into consideration) or -bin_size = 20; second, only those peaks (<0.05 FDR) that are found in at least 2 out of 3 replicates (suppl. Table T2-3) were considered for mapping to NCBI RefSeq genes (RGSC Rnor_6.0, suppl. Table T4-5).
Reanalysis of published sequencing data
In order to obtain a specific expression background for GO-Term and miRNA binding site analysis, we downloaded and analysed sequencing data from rat cortical neurons (DIV 7, control group of a KCL treatment experiment) (GSE78688~ [Citation28]). Reads were mapped to the rat genome (Rnor_6.0, Ensembl annotations) with STAR (v. 2.7) [Citation26] and counted with featureCounts (v. 1.6) [Citation29]. Genes with more than 10 reads in all three samples were considered as expressed. Further analysis has been performed with edgeR (v. 3.28) [Citation30].
Transcript specific analysis (Suppl. Fig. S1) was conducted with Salmon (v. 1.0.0) [Citation31] based on the Rnor_6.0 rat ensemble reference genome. Subsequent logcpm computations were conducted via edgeR (no further count filters).
GO enrichment analysis
Gene Ontology enrichment analysis was essentially performed as described previously [Citation32]. In brief, significant genes, obtained by calling peaks with a -bin_size = 20 in the Piranha software were mapped to the NCBI RGSC Rnor_6.0 genome. Published sequencing data from rat cortical neurons (DIV 7) was reanalysed (see above) in order to compare the list to a specific expression background. Unique Ensembl-IDs of the SYNCRIP bin_20 genes were used as input gene set for topGO (v. 2.38) [Citation33] in R (v. 3.6).
STRING analysis
A STRING interaction network (String database v.11.0) was generated of unique, significant SYNCRIP bin_20 peak genes associated with the Top 4 Biological Process GO-Term results (Dendrite Morphogenesis, Positive Regulation of Microtubule Polymerization, Learning, Neuron Migration). The following network parameters were used:
Meaning of network edges: confidence
Active interaction sources: textmining, experiments and databases
Minimum required interaction score: medium confidence
Max numbers of interactors to show: Query proteins only
The network layout was adapted with Cytoscape 3. Nodes with less than three interactors are not shown.
Motif analyses
Bioconductor packages GenomicRanges (v. 1.38) [Citation34] and BSgenome (Rnorvegicus.UCSC.rn6) were used to get genomic sequence stretches of SYNCRIP +1 crosslink coordinates (bin_1, suppl. Table T2) extended for 27 nt upstream and 20 nt downstream. Overlapping sequences were reduced and the resulting Fasta files used as input for the DREME tool of the Meme-Suite (5.1.1) [Citation35] to perform an unbiased motif enrichment search against shuffled control sequences (standard parameters).
miRNA binding site enrichment analyses
Predicted conserved microRNA binding sites of conserved microRNA families (Targetscan 7.1) [Citation36] were counted in unique SYNCRIP bin_20 genes and used for enrichment tests against binding sites in tissue specific control genes (see above [Citation28]). Only expressed miRNAs (total expression = sum of cytosolic and nuclear fraction) were considered for the analysis [Citation23]. Processing and statistical testing (an adapted form of the hypergeometric test) were conducted with the EnrichMir package for R (to be published elsewhere).
Real-time PCR
The total RNA extraction from neuronal cultures was performed using PeqGOLD TriFast reagent (VWR Peqlab) per manufacturer’s instructions. RNA samples were treated with TURBO DNase (Thermo Fisher Scientific). Total RNA was reverse transcribed with iScript cDNA synthesis kit (Bio-Rad) and real-time PCR was performed on the StepOnePlus Real-Time PCR System (Applied Biosystems), using iTaq SYBR Green Supermix with ROX (Bio-Rad). Each sample was measured in triplicates. Primers used for the real-time PCR are provided as supplementary data.
Luciferase reporter assay
Primary cortical neurons were transfected in duplicate with either 100 ng of pIS1-2xmiR-9 BS/pIS1-2xLet7 BS (and -mut) renilla reporter constructs and equal amounts of empty pGL4.13 firefly luciferase reporter as a transfection control or only pmirGLO-DCX. Knockdown of SYNCRIP was performed by transfection of 7–20 ng of the relevant pSuper shRNA construct. Luciferase assays were carried out using the Dual-Luciferase reporter assay system (Promega) on the GloMax R96 Microplate Luminometer (Promega).
RNA-pull down
RNA-pull down assay was performed as previously described [Citation20] with some modifications outlined below.
Preparation of 2xmiR-9/2xmiR124 binding site (BS) transcripts
The DNA template for in vitro transcription was obtained by annealing, phosphorylation, ligation and TBE-agarose gel purification of oligonucleotides (see supplementary data). Short RNA transcripts containing a 5ʹ extension complementary to the 3ʹ end biotinylated adapter DNA oligonucleotide were synthesized using MEGAshortscript T7 Transkriptionskit (Thermo Fisher Scientific), as per manufacturer’s instructions.
Preparation of beads
The 3′-biotinylated DNA adapter (Thermo Fischer Scientific) was incubated with streptavidin-conjugated agarose beads (#S1638, Sigma) in buffer A (20 mM Tris-HCl (pH 7.4), 100 mM NaCl, 2 mM EDTA) at 4°C for 1 h at constant rotation. Beads were washed twice with buffer B (20 mM Tris-HCl (pH 7.4), 300 mM NaCl, 0.2 mM EDTA) and coupled with the in vitro transcribed 2x miR-9 BS/2x miR-124 BS (-mut) in buffer B supplemented with 0.1 U/ml SUPERase inhibitor (Thermo Fischer Scientific) and 0.25 x Complete Protease Inhibitor Cocktail for 3 h at RT with constant rotation. The beads were washed twice with buffer A (supplemented with 0.1 U/ml SUPERase inhibitor) and incubated with precleared cell extract.
Preparation of cell extracts
DIV6 rat cortical neurons (40 million cell/pull-down) were homogenized in buffer C (20 mM Tris-HCl (pH 7.4), 150 mM NaCl, 2 mM EDTA, 0.5% Igepal 630; supplemented with 0.5 U/μl SUPERase inhibitor (Thermo Fisher Scientific) and 1x Complete Protease Inhibitor Cocktail (Roche)) with a teflon-coated Dounce-Potter homogenizer by 40 up and down strokes. Cell debris and nuclei were removed by centrifugation at 15,000 x g for 10 min at 4°C. After adding 100 μg/ml yeast tRNA (Sigma) to block unspecific binding, the cell extracts were precleared twice with ‘empty’ streptavidin-agarose beads.
Incubation, washing and protein elution
The miRNA binding site RNA transcript loaded beads were incubated with the precleared protein extract overnight at 4°C at constant rotation. The beads were washed five times with buffer D (20 mM Tris-HCl (pH 7.4), 250 mM NaCl, 2 mM EDTA; supplemented with 0.1 U/ml SUPERase inhibitor). Buffers for the first four washes contained 10 μg/ml yeast tRNA. Bound proteins were eluted with Western blot sample buffer and separated by SDS-PAGE using a 4–15% gradient gel (Mini-Protean TGX gels, Bio-Rad). Proteins were stained using Colloidal Blue Staining Kit (Thermo Fisher Scientific), and analysed by MALDI-TOF mass spectrometry on an Autoflex Bruker Daltonics mass spectrometer as previously described [Citation20].
RNA immunoprecipitation
Preparation of beads
For each immunoprecipitation assay, 5 µg mouse anti-hnRNPQ (clone 18E4, Sigma) or mouse IgG1 (clone G3A1, Cell signalling) were coupled to 50 µl of Dynabeads Protein G (#10004D, ThermoFischer) in IP lysis buffer (20 mM Tris-HCl (pH = 7.5), 200 mM NaCl, 0.5% Igepal 630, 2 mM EDTA, 1x Complete™ Protease Inhibitor Cocktail) for 1 hour at RT with constant rotation. Antibody-conjugated beads were washed four times with IP lysis buffer prior to immunoprecipitation.
Cell extract preparation, immunoprecipitation and washing
Primary cortical neurons (10 million/experiment) grown to DIV6 were collected with cell scraper in ice-cold PBS, centrifuged at 100 g for 5 min at 4°C and incubated on ice for 10 min after resuspending the cell pellet in IP lysis buffer. Cell lysate was homogenized with a teflon-coated Dounce-Potter by 20 up and down strokes and cell debris was removed by centrifugation at 15,000 g for 10 min at 4°C. After incubation of cell extracts with antibody-coupled beads at 4°C for 2 hours, the latter was washed three times first with IP lysis buffer and then with washing buffer (20 mM Tris-HCl (pH = 7.5), 10 mM MgCl, 0,2% Tween 20, 1x Complete Protease Inhibitor Cocktail) with constant rotation. Twenty percent of the beads were used for Western blotting, the remaining 80% for RNA extraction using PeqGOLD TriFast reagent per manufacturer’s instructions.
Statistical analysis
Experiments are reported as mean ± standard deviation (SD) and based on three (if not otherwise stated) independent biological replications. For data with single comparison the statistical significance was calculated using Student’s t-test (two-sample, unpaired; one sample, unpaired), for those with multiple comparisons, one-way or two-way ANOVA with Tukey/Dunnet’s post hoc test, where applicable, was used.
Results
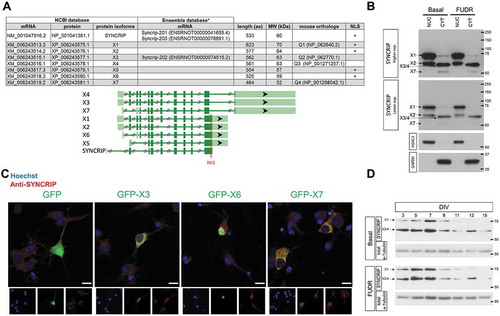
We used rat primary hippocampal and cortical neuron cultures as a model system to study SYNCRIP function in mammalian neurons. However, the expression and subcellular localization of SYNCRIP isoforms in rat has not been described so far. A search in the NCBI database revealed a total of seven different isoforms (X1-X7) (). Of those, four (X1, X3, X4, X7) have a corresponding mouse orthologue (Q1-4) and are therefore likely functionally relevant. One of the conserved isoforms (X1) possesses a nuclear localization signal (NLS) which should allow the protein to enter the nucleus. The other three (X3, X4, X7) lack a canonical NLS and are therefore candidates for cytoplasmic isoforms. Of note, two of the NLS-lacking isoforms (X3, X4) differ by only one amino acid, rendering them indistinguishable in analyses such as Western blot and immunocytochemistry (ICC). To validate these predictions, we first performed Western blotting with a SYNCRIP-specific antibody in nuclear (NUC) and cytoplasmic (CYT) extracts from cortical (DIV7) neurons (). In agreement with predictions based on database entries, the major band in cytoplasmic extracts runs around 63 kD and therefore likely represents X3/4. The additional bands likely correspond to X1 (70 kD) and X7 (52 kD). This interpretation is supported by the results obtained with nuclear extracts, where SYNCRIP X1 (70 kD) is the predominant band and X7 (52 KD) is virtually absent. An additional band at around 60 kD specifically present in nuclear extracts likely represents X2. We note that we loaded equal protein amounts of nuclear and cytoplasmic extracts. However, nuclear volume only takes up about 20% of the total cellular volume. Therefore, this analysis likely overestimates the contribution of nuclear-enriched SYNCRIP isoforms to the total pool of neuronal SYNCRIP (see also ). Importantly, the observed expression of SYNCRIP isoforms appears to originate mainly from neurons in our mixed cultures, since depletion of glial cells by floxuridine (FUDR) gave nearly identical results (, right panel). Next, we sought to confirm the sub-cellular localization of putative nuclear (X6) and cytoplasmic (X3, X7) SYNCRIP isoforms. X6, which is identical to X1 except at the very N-terminus, was used in these experiments since we were unable to clone the more prevalent isoform X1. We expressed respective GFP-SYNCRIP fusion proteins in rat hippocampal neurons and performed ICC for either GFP (green channel) or SYNCRIP (red channel) (). Whereas X6 was mostly confined to the nucleus as evidenced by co-localization with the nuclear marker DAPI, X3 and X7 where almost exclusively localized in the neuronal cytoplasm, with very weak nuclear signal. In addition, endogenous SYNCRIP without the expression of GFP-SYNCRIP fusion protein (GFP condition, red channel) was mainly localized in the cytoplasm. Thus, our results from ICC largely confirm the Western blot data from fractionated neurons and together suggest that four SYNCRIP isoforms are substantially expressed in rat neurons. Whereas three of these isoforms (X3/4/7) are predominantly expressed in the cytoplasm, X1 is strongly nuclear-enriched. Our results are also in line with those from a previous publication which showed cytoplasmic localization of the corresponding mouse orthologues [Citation8]. We next investigated the expression of SYNCRIP over the course of neuronal differentiation in whole cell extracts of cortical neurons cultured for 3 to 15 days in vitro (DIV) by Western blotting (). We detected bands that likely correspond to the cytoplasmic X3/4 and the nuclear X1 isoforms. This expression pattern in whole cell extracts corresponds well with the results obtained from cell fractionation (). Re-analysis of published RNA-seq data further confirmed pre-dominant expression of X3 in rat cortical neurons (suppl. Fig. S1 [Citation28]). Expression of all isoforms declines over the course of neuronal differentiation compared to tubulin, which remains stable ().
Figure 1. Expression and sub-cellular localization of SYNCRIP protein isoforms in rat cortical neurons. (A). Upper panel: A list of provisional and predicted SYNCRIP isoforms according to the NCBI and Ensembl databases (upper panel). Predicted rat SYNCRIP protein isoforms are depicted as X1-X7, validated mouse orthologs as Q1-Q4. NLS: nuclear localization signal. * The NCBI and Ensemble database transcripts differ in length, but encode identical protein isoforms. Lower panel: SYNCRIP gene structure and exon composition of transcripts (lower panel, modified from NCBI genome browser). Dark green blocks represent coding, light green blocks untranslated regions. (B). Western blotting of SYNCRIP protein isoforms in nuclear (NUC) and cytoplasmic (CYT) extracts of primary cortical cultures at 7 days in vitro (DIV7), basal – mixed culture, FUDR: floxuridine-treated (neuron-enriched) culture. Western blotting for HDAC2 and GAPDH was used to confirm the purity of the cytoplasmic and nuclear fractions, respectively. (C). Subcellular localization of endogenous SYNCRIP (red) and indicated GFP- SYNCRIP fusion proteins (green) in DIV11 hippocampal neurons as detected by immunocytochemistry using anti-GFP (upper) or anti-SYNCRIP antibodies. Scale bar = 10 µm (D). Developmental expression of indicated SYNCRIP protein isoforms in cortical neuron cultures (3–15 DIV) left either untreated (upper) or floxuridine (FUDR)-treated as detected by Western blot
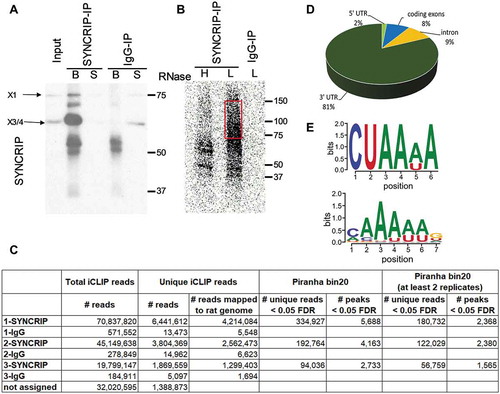
Using candidate approaches, several direct SYNCRIP targets have been identified in mammalian neurons in previous studies, including the actin regulatory proteins RhoA and GAP-43 [Citation8,Citation10]. However, a more systematic analysis of endogenous SYNCRIP association with cellular RNAs in primary mammalian neurons has not been performed. Thus, we established an iCLIP protocol for the genome-wide detection of SYNCRIP association with natural target RNAs in rat cortical neurons at nucleotide resolution. In order to focus on the role of cytoplasmic SYNCRIP, we used cytoplasmic extracts for the cross-linking experiments and used a time point (DIV6) with peak expression of SYNCRIP (; please refer to the Materials and Methods section for more details on our iCLIP protocol). First, we validated the specificity of the used anti-SYNCRIP antibody in immunoprecipitation (). As expected, the vast majority of SYNCRIP protein within cytoplasmic IPs corresponds to the X3/4 isoform (63 kD), with only a minor contamination from the predominantly nuclear X1 isoform (70 kD). Autoradiography showed a smear at high molecular weight specifically in the low (L) RNAse condition, thereby validating efficient cross-linking of RNA fragments to SYNCRIP during our iCLIP procedure (). In the high (H) RNAse condition (), the signal collapses to a band around 60 kD, confirming that the majority of RNA was cross-linked to the cytoplasmic X3/4 isoforms. Having confirmed efficient and specific cross-linking of cytoplasmic SYNCRIP to RNA, we prepared libraries from three independent iCLIP replicates (SYNCRIP vs. control IgG) and subjected them to massive parallel sequencing. We obtained between 1.3 and 4.2 Mio unique iCLIP reads in the SYNCRIP IP replicates mapped to the rat genome (, suppl. Table T1), which correspond to 2,733–5,688 iCLIP peaks based on Piranha bin20 peak calling (, suppl. Table T2-3). The majority of iCLIP peaks which map to rat mRNAs are present in 3ʹUTRs (81%), with the remaining sites located in 5ʹUTRs, introns and coding exons (, suppl. Fig. S2; suppl. Table T4-5). This result indicates that cytoplasmic SYNCRIP predominantly functions in a 3ʹUTR-dependent manner. Unbiased motif analysis revealed a strongly overrepresented AU-rich hexamer in the 3ʹUTR of SYNCRIP iCLIP targets (, upper panel). Interestingly, this motif largely corresponds to a SYNCRIP binding motif which was previously reported in a large-scale in vitro study [Citation37], except for uracil at position 2 (, lower panel).
Figure 2. Identification of direct SYNCRIP cytoplasmic target mRNAs in rat cortical neurons using iCLIP. (A). Western blot of SYNCRIP or IgG-immunoprecipitation (IP) of rat cortical neuron extracts after cross-linking using anti-SYNCRIP antibodies (B: beads, S: supernatant). (B). Autoradiography of RNA transcripts cross-linked to SYNCRIP in high (H, 1:100 dilution) or low (L, 1:7000 dilution) RNase conditions. The migration of the X3/4 isoform is indicated. For downstream iCLIP applications cross-linked RNA transcripts corresponding to 70–150 kDa size (red box) are used. (C). Summary of identified unique and clustered (peaks) reads in each of the three SYNCRIP iCLIP replicates. Unique iCLIP reads are used as input for the peak-caller software Piranha to generate iCLIP peaks (clusters) with a bin_size 20 parameter (see materials and methods section). (D). Pie chart representing the distribution of identified iCLIP peaks (Piranha bin 20 – at least 2 replicates) in 5ʹUTR, coding sequence (CDS), intron and 3ʹUTR of pre-mRNAs. Total iCLIP peaks mapping to pre-mRNAs are taken as 100%. (E). SYNCRIP binding motifs. Predicted neuronal SYNCRIP binding motif (upper panel), as obtained by means of an unbiased motif search near iCLIP peaks of mRNA 3ʹUTRs against shuffled control sequences (E-value = 0.00062). SYNCRIP binding motif from CISBP-RNA database, based on large-scale in vitro analysis (33, lower panel)
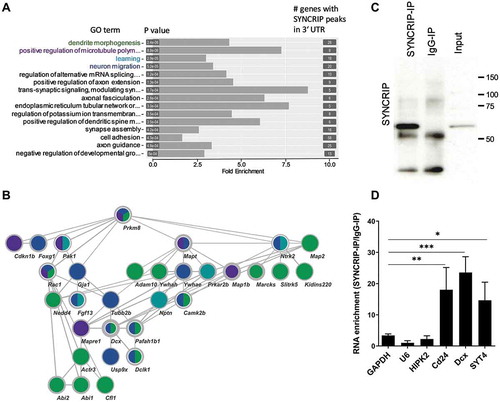
We next performed gene annotation (GO) analysis of SYNCRIP iCLIP targets to identify biological processes (BP) in which SYNCRIP could play an important role (; suppl. Fig. S3). When comparing to a background of all expressed genes in rat cortical neurons [Citation28], the most significantly enriched BPs are dendrite morphogenesis, positive regulation of microtubule polymerization, learning and neuronal migration. The intensive interconnection of genes from these four BPs is further illustrated by our STRING network analysis (, see M&M for further details). Interestingly, the known direct SYNCRIP target GAP-43 [Citation10] was identified among the list of 490 genes in our iCLIP experiment (suppl. Table T6), demonstrating that our approach was successful in identifying bona fide SYNCRIP target mRNAs. In order to further validate the results from our iCLIP experiment, we decided to investigate the association of top-ranking candidates (suppl. Table T6) by the independent RNA-IP approach. Western blotting confirmed that we could specifically pull-down cytoplasmic SYNCRIP (along with associated RNAs) using our protocol (). For the qPCR analysis in SYNCRIP-precipitated RNA samples, we decided to measure three high-ranking candidates with known functions in neuronal development (Dcx, Cd24, Syt4; suppl. Fig. S4). All three candidate RNAs were significantly enriched in SYNCRIP-IP over IgG-IP (). These results are specific, since RNAs not identified by SYNCRIP iCLIP (U6, Gapdh, HIPK2) were largely unchanged. We decided to investigate a putative regulatory role of SYNCRIP in the post-transcriptional control of Dcx and Cd24 in more detail.
Figure 3. GO and Network analysis of SYNCRIP iCLIP targets. (A). Gene ontology (GO) analysis of biological process (BP) terms enriched in SYNCRIP iCLIP target genes. Top 15 BP terms based on statistical enrichment (P-values) are indicated. The number of genes in each term is indicated on the right. (B). STRING network interaction analysis of SYNCRIP iCLIP target genes of the top four BP-GO terms (in green: dendrite morphogenesis, in violet: positive regulation of microtubules, in turquoise: learning and in blue: neuronal migration). Thickness of lines: STRING confidence of interaction; thickness of node borders (light grey): log2 iCLIP peaks. (C). Western blot of SYNCRIP- and IgG-RNA-IPs using anti-SYNCRIP-antibody. (D). qPCR of selected SYNCRIP iCLIP target mRNAs after RNA-IP (as in C). The RNA enrichment scores for each gene are calculated by dividing the relative RNA amounts recovered from the SYNCRIP-IP to those from the IgG IP. GAPDH, U6 and HIPK2 were not enriched in SYNCRIP iCLIP and therefore served as negative controls. Data are presented as mean ± SD (n = 3 independent IP experiments). Statistical test is performed using one-way ANOVA (F (6,14) = 13.81; P < 0.0001; Dunnett’s multiple comparisons test: adj. p-value, * < 0.05, ** < 0.01, *** <0.001)
To study the role of endogenous SYNCRIP in the regulation of these genes, we performed SYNCRIP knockdown using the transfection of three Syncrip shRNA-expressing constructs. Two of the shRNAs (shRNA-1, −2) target an exon common to all SYNCRIP isoforms and are therefore expected to knock down both nuclear and cytoplasmic isoforms. One shRNA construct (Cyt-shRNA) specifically targets a unique 3ʹUTR present exclusively in the cytoplasmic isoforms X3, X4 and X7 (see ). Upon transfection of shRNA-1 and −2, we observed a strong reduction in both the predominant cytoplasmic (X3/4) and nuclear (X1/2) SYNCRIP isoforms, as expected (). In contrast, transfection of Cyt-shRNA predominantly reduced expression of the cytoplasmic X3/4 isoforms. Next, we assessed the expression of candidate direct targets identified by iCLIP upon SYNCRIP knockdown using qPCR and Western blotting. SYNCRIP shRNA transfection led to a significant reduction in Cd24 and Dcx mRNA levels (). In contrast, mRNA levels of the negative controls 12sRNA and HIPK2 were unaffected by SYNCRIP knockdown. Since Cd24 antibodies did not work in our hands, we further focussed on Dcx in the context of protein regulation. In Western blotting, Dcx protein levels were strongly reduced upon SYNCRIP knockdown in whole neuron cell lysates (). This effect was specific for Dcx, since protein levels of Vinculin, which is not a SYNCRIP target based on our iCLIP data, were not affected by SYNCRIP knockdown (). We went on to test whether the observed stabilizing function of SYNCRIP on Dcx was mediated by the Dcx 3ʹUTR, the site of SYNCRIP interaction. Therefore, we performed luciferase reporter assays using a previously published (Dcx-Luc-1 [Citation21]) Dcx 3ʹUTR luciferase construct which covers the first 1.5 kb of the 7.4 kb long rat Dcx 3ʹUTR. Importantly, according to our iCLIP data, this region contains a number of SYNCRIP binding peaks (suppl. Fig. S4). Consistent with our results from qPCR and Western blotting, co-transfection of SYNCRIP shRNA constructs in cortical neurons reduced the expression of a Dcx-Luc 3ʹUTR reporter gene, but not an empty vector (). Therefore, binding of SYNCRIP to the Dcx 3ʹUTR correlates with stabilization of the Dcx transcript and high levels of Dcx protein expression (). Together, multiple lines of evidence support a role specifically for cytoplasmic SYNCRIP as a stabilizing trans-acting factor which associates with the 3ʹUTR of mRNAs encoding important regulators of early neural development.
Figure 4. SYNCRIP positively regulates Dcx and Cd24 mRNA and protein expression. (A). Western blot using anti-SYNCRIP antibody in primary cortical neurons that had been nucleofected at DIV0 with the indicated shRNA constructs and lysed at DIV5. Vinculin was used as a loading control. (B). qPCR of the SYNCRIP iCLIP target mRNAs Cd24 and Dcx in neurons treated as in 4A (B).12sRNA and HIPK2 are used as negative controls. RNA levels were normalized to GAPDH mRNA. Data are presented as mean ± SD (n = 3). Statistical test is performed using one-way ANOVA (12sRNA: F (3,8) = 4.45; P = 0.041; HIPK2: F (3,8) = 2.23; P = 0.162; Cd24: F (3,8) = 27.15; P = 0.0002; DCX: F (3,8) = 11.48; P = 0.0029; Dunnett’s multiple comparisons test: adj. p value, * < 0.05, ** < 0.01, *** <0.001) (C). Western blot using the indicated antibodies with cell extracts from neurons treated as in 4A. A representative blot from a total of 3 blots is shown. (D). Luciferase reporter gene assay in rat cortical neurons (DIV 6–9) transfected with a pmirGLO-DCX-3ʹUTR and the indicated shRNA constructs. Transfection of an empty pmirGLO vector was used as a negative control. Relative luciferase activity (firefly/renilla activity) is presented as mean ± SD (n = 3). Statistical test is performed using two-way ANOVA (empty vector: P = n.s., DCX-3ʹUTR: P < 0.05; UTR: F (1,8) = 21.26, P = 0.0017; shRNA: F (1,8) = 25.48, P = 0.0010; UTR x shRNA: F (1,8) = 1.168, P = n.s.)
Previous studies in non-neuronal cells reported a link between SYNCRIP and miRNA-dependent gene regulation [Citation11]. Thus, we speculated that post-transcriptional control of gene expression exerted by SYNCRIP in neurons might also involve miRNAs.
SYNCRIP knockdown increased the expression of luciferase reporter genes containing two binding sites for either miR-9 or let-7 (; suppl. Fig. S5), suggesting that endogenous SYNCRIP promotes miRNA-dependent repression of these reporters. The stimulatory effect of SYNCRIP knockdown was preserved when a reporter gene that cannot be poly-adenylated due to the presence of HSL-HhR stem loop sequences in the 3ʹUTR was used (suppl. Fig. S6), suggesting that Syncrip functions independent of polyadenylation. Importantly, mutation of the respective miRNA binding site (MBS) (suppl. Fig. S5) abolished the stimulatory effect of SYNCRIP knockdown on reporter gene expression, demonstrating that association of miRISC is required for SYNCRIP regulation (). Based on qPCR, luciferase RNA levels of 2x miR-9 and 2x let-7 wt and mut BS reporters were not significantly different, indicating that the regulation occurs primarily at the level of mRNA translation (suppl. Fig. S7).
Figure 5. SYNCRIP promotes miRNA-dependent repression. (A). Luciferase reporter gene assays in rat cortical neurons (DIV 6–9) transfected with the indicated 2xmiR binding site (BS) reporters (either wt (dark) or mutant (grey)) and shRNA constructs. Relative luciferase activity (firefly/renilla activity) is presented as mean ± SD (n = 3). For each reporter gene, results from co-transfection of a vector alone (without shRNA) were set to one. Statistical test is performed using two-way ANOVA. 2x miR-9 (2x miR-9 BS: P < 0.0001, 2x miR-9 BS-mut: P = n.s.; BS: F (1,8) = 96.05, P < 0.0001; shRNA: F (1,8) = 21.03, P = 0.0018; BS x shRNA: F (1,8) = 32.01, P = 0.0005), 2x Let7 (2x Let7 BS: P < 0.01, 2x Let7 BS-mut: P = n.s.; BS: F [1,8] = 21.08, P = 0.0018; shRNA: F (1,8) = 13.31, P = 0.0065; BS x shRNA: F (1,8) = 8.046, P = 0.0219). (B). Colloidal blue stained SDS-PAGE gel depicting proteins (bands) that have been pulled down from cortical neuron extracts using either in vitro transcribed 2x miR-9 BS RNA oligonucleotides or adapter only. Six proteins that were identified by mass spectrometry analysis in at least two independent pull-down experiments are indicated, together with their migration position in SDS-PAGE. (C). Western blot using the indicated antibodies with 2xmiR-9 and 2xmiR-124 pull-downs from cortical neuron extracts (as in 5B). (D). miRNA binding site enrichment analyses on SYNCRIP iCLIP target genes. Circle sizes indicate the number of SYNCRIP target genes, which contain binding sites of the specific indicated miRNA (overlap). A combined -log10 transformed p-value (lower number of a hypergeometric test for enrichment or depletion of miRNA binding sites) is displayed on the y-axis, the x-axis shows log2 fold enrichment of miRNA binding sites against the background. miRNA expression levels in DIV7 cortical neuronal cultures [Citation21] are colour-coded. Only miRNAs with a p-value ≤ 0.05 and an overlap > 5 are plotted. Pro-neural miRNAs miR-125a-5p, miR-124-3p, miR-9a-5p and let7a-5p are highlighted
![Figure 5. SYNCRIP promotes miRNA-dependent repression. (A). Luciferase reporter gene assays in rat cortical neurons (DIV 6–9) transfected with the indicated 2xmiR binding site (BS) reporters (either wt (dark) or mutant (grey)) and shRNA constructs. Relative luciferase activity (firefly/renilla activity) is presented as mean ± SD (n = 3). For each reporter gene, results from co-transfection of a vector alone (without shRNA) were set to one. Statistical test is performed using two-way ANOVA. 2x miR-9 (2x miR-9 BS: P < 0.0001, 2x miR-9 BS-mut: P = n.s.; BS: F (1,8) = 96.05, P < 0.0001; shRNA: F (1,8) = 21.03, P = 0.0018; BS x shRNA: F (1,8) = 32.01, P = 0.0005), 2x Let7 (2x Let7 BS: P < 0.01, 2x Let7 BS-mut: P = n.s.; BS: F [1,8] = 21.08, P = 0.0018; shRNA: F (1,8) = 13.31, P = 0.0065; BS x shRNA: F (1,8) = 8.046, P = 0.0219). (B). Colloidal blue stained SDS-PAGE gel depicting proteins (bands) that have been pulled down from cortical neuron extracts using either in vitro transcribed 2x miR-9 BS RNA oligonucleotides or adapter only. Six proteins that were identified by mass spectrometry analysis in at least two independent pull-down experiments are indicated, together with their migration position in SDS-PAGE. (C). Western blot using the indicated antibodies with 2xmiR-9 and 2xmiR-124 pull-downs from cortical neuron extracts (as in 5B). (D). miRNA binding site enrichment analyses on SYNCRIP iCLIP target genes. Circle sizes indicate the number of SYNCRIP target genes, which contain binding sites of the specific indicated miRNA (overlap). A combined -log10 transformed p-value (lower number of a hypergeometric test for enrichment or depletion of miRNA binding sites) is displayed on the y-axis, the x-axis shows log2 fold enrichment of miRNA binding sites against the background. miRNA expression levels in DIV7 cortical neuronal cultures [Citation21] are colour-coded. Only miRNAs with a p-value ≤ 0.05 and an overlap > 5 are plotted. Pro-neural miRNAs miR-125a-5p, miR-124-3p, miR-9a-5p and let7a-5p are highlighted](/cms/asset/ed270895-f4d7-4a9a-906a-137827113f45/krnb_a_1830553_f0005_oc.jpg)
We hypothesized that SYNCRIP might be in a physical complex with neuronal miRISC, in agreement with previous results that identified SYNCRIP in Ago pull-downs from human cell lines [Citation38]. We performed pull-downs in rat brain extracts with synthetic oligonucleotides containing two miR-9 binding sites, analogous to the design of the luciferase reporters used in . As a specificity control served oligonucleotides with miR-9 binding site mutations. Mass spectrometry analysis of pull-downs from rat cortical extracts revealed several proteins that specifically interacted with the wt miR-9 binding site oligo, including SYNCRIP, the closely related hnRNPR, the previously identified Ago interacting protein YBX1 and ILF3/NF90 [Citation38], as well as 2 other proteins not previously implicated in gene silencing (MAP2, KDIS/KIDINS220) (). The interaction of SYNCRIP with the wt miR-9 binding site (BS) oligonucleotide could be confirmed by Western blotting (). This interaction was specific, since MAP2, another candidate identified by mass spectrometry, did not detectably interact with the miR-9 BS oligonucleotide (). Furthermore, we detected the miRISC core component Ago2 in pull-downs with both miR-9 and miR-124 BS oligonucleotides, but to a lesser extent in the respective BS mutants ().
Finally, we wanted to more systematically address a potential interaction between SYNCRIP and specific miRNAs on target 3ʹUTRs. Therefore, we developed a bioinformatics tool, EnrichMiR, that computes the enrichment of MBS in omics datasets (e.g. RNAseq, iCLIP) compared to a given background gene set (to be published elsewhere). When applying EnrichMiR to our SYNCRIP iCLIP data, we identified several MBS for neuronal miRNAs that are either enriched or depleted in SYNCRIP iCLIP targets compared to a background of neuronally expressed genes [Citation28] (; suppl. Fig. S8). Strikingly, MBS for known abundant pro-neural miRNAs, such as the let-7 family, miR-124-3p, miR-9a-5p and miR-125a/b-5p, were consistently depleted from the 3ʹUTRs of SYNCRIP iCLIP targets ().
Together, our results suggest that SYNCRIP is a component of miRISC loaded with pro-neural miRNAs.
Discussion
In this study, by performing iCLIP, we obtained the first comprehensive map of the in vivo association of the SYNCRIP RBP with cytoplasmic mRNAs in primary neurons. While results from cellular fractionation and immunocytochemistry already indicated a primarily cytoplasmic function of SYNCRIP, our approach was able to distinguish the cytoplasmic role of SYNCRIP from a well-established nuclear function in control of alternative splicing. We observed that the vast majority (81%) of SYNCRIP interaction sites reside within the 3ʹUTR of target mRNAs, consistent with previous results and a potential role of cytoplasmic SYNCRIP in 3ʹUTR-dependent RNA regulation, e.g. mRNA transport, stability and translation efficiency. However, at the level of individual target mRNAs, we did not observe a strong overlap between our study and a previous study which used RNA immunoprecipitation in neurons followed by microarray profiling. Although we could also identify GAP-43 mRNA as a bona fide target of SYNCRIP, other reported interactors, such as RhoA and Cdc42, were not validated. We believe that our approach is more stringent due to the harsh washing conditions that can be applied in iCLIP. Furthermore, previous approaches used heterologous cell lines and did not focus on the cytoplasmic RNA pool [Citation9]. Intriguingly, when performing GO term analysis with RNAs that display peak enrichment in SYNCRIP iCLIP, we observed a strong overrepresentation of RNAs encoding for important regulators of neurogenesis and neuronal migration, e.g. Dcx/Dclk1, Pafah1b1 (Lis1), Dpysl2, GAP-43, Syt4, Cd24, Neurod6 and others. This results points to a hitherto unrecognized role of SYNCRIP at early stages of neural differentiation, which is further supported by the high expression of SYNCRIP in immature neurons (). Previous studies had focused on SYNCRIP function in neurite outgrowth, synapse formation and plasticity, but our results warrant a more detailed investigation of SYNCRIP at earlier stages of neuronal development. At the mechanistic level, many of the validated SYNCRIP target mRNAs encode for regulators of the microtubule cytoskeleton, e.g. several tubulin subunits, microtubule-associated proteins (MAPs), Pafa1hb1 (Lis1) and Dcx/Dclk1. In addition, we obtained further support for SYNCRIP regulation of actin dynamics, e.g. through interaction with Rac1, Pak1, Cfl1 and Abi1/2 (). Therefore, SYNCRIP might play a pivotal role at the crossroads between actin and microtubule dynamics. The coordinate regulation of these two main components of the cellular cytoskeleton is of critical importance at the neural progenitor – neuron transition, e.g. by initiating cellular polarity and subsequent process outgrowth [Citation39,Citation40]. In this regard, SYNCRIP has already been shown to be required for neuritogenesis [Citation8,Citation9]. Another important function of the microtubule cytoskeleton is the control of intracellular transport, e.g. mRNA transport in axons and dendrites. Accordingly, SYNCRIP has been identified as a component of KIF-associated RNA transport granules in the rodent brain [Citation5], and the RNA localization machinery in Drosophila oocytes [Citation15]. Surprisingly, our analysis did not provide substantial evidence for the regulation of synaptic genes by SYNCRIP, as would have been expected from a previous study at the Drosophila NMJ [Citation16]. Either there are different mechanisms operating in Drosophila and mammalian synapse formation, or the developmental time point used in our study (DIV6) was too early to pick up a significant number of synapse-related genes. Future studies are required to identify the SYNCRIP mRNA interactome at later stages of neural development that are more relevant for synapse formation and/or plasticity.
An important unresolved issue regarding the post-transcriptional role of SYNCRIP is how its role as a sequence-specific mRNA interacting factor and its modulatory role of the activity of miRNAs [Citation11], another class of important gene-specific post-transcriptional regulators, are coordinated. Here, we could confirm SYNCRIP as a component of the miRNA pathway [Citation38,Citation41] and further show that it is able to enhance miRNA-dependent repression of targets for neuronal miRNAs, such as miR-9 and let-7. At first glance, this seems at odds with the stabilizing effect of SYNCRIP on neurogenesis genes. However, it has been reported that neuron-specific miRNAs, such as miR-9, promote neural cell fate by repressing non-neuronal genes (so-called ‘anti-target’ model) [Citation41–43]. In line, binding sites for pro-neural miRNAs, e.g. miR-9, let-7, miR-124 and miR-125, were strongly depleted in SYNCRIP iCLIP targets compared to the background of all neuronally expressed genes (). Thus, simultaneous binding of SYNCRIP either directly or indirectly in association with miRISC to the same target appears to be disfavoured, which might prevent the presence of repressive and stabilizing SYNCRIP complexes on the same target mRNA.
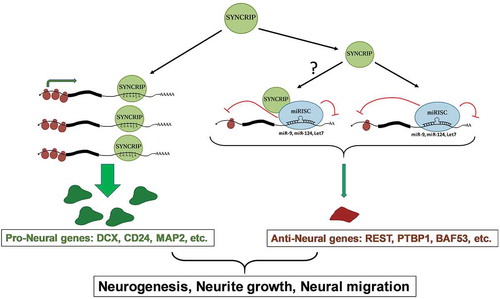
Taken together, it is tempting to speculate that SYNCRIP might promote neural development by two different mechanisms (): on the one hand, it might stabilize a pool of pro-neural genes (e.g. Dcx, Cd24) involved in the regulation of neurogenesis, neurite outgrowth and neural migration. On the other hand, it might repress another pool of genes that block neural differentiation together with pro-neural miRNAs [Citation41]. It remains to be determined how SYNCRIP is able to specifically control targets of pro-neuronal miRNAs. This presumably does not involve a direct interaction of SYNCRIP with sequence motifs in the 3ʹUTR of target mRNAs, but rather an indirect recruitment by miRISC to MBS. Whether SYNCRIP directly interacts with miRISC in neurons will have to be assessed in future experiments. Alternatively, SYNCRIP might directly associate with the miR-9 MBS due to its preference for A-rich binding motifs (). We did however not obtain any evidence for a direct competition between SYNCRIP and miR-9 on target 3ʹUTRs (unpublished observation). A recent study reported that SYNCRIP interferes with miRNA function in a polyA-tail dependent mechanism in non-neuronal cells [Citation11]. In contrast, the repressive function of SYNCRIP on reporter gene expression in neurons was both dependent on an intact miR-9 BS () and independent of the polyA tail (suppl. Fig. S6). Thus, Syncrip might employ different modes of regulation dependent on the cellular context. In the future, it will be interesting to determine the effect of SYCNRIP knockdown on the expression of known targets of pro-neural miRNAs, such as REST, PTBP1 and BAF53.
Figure 6. Model for the dual role of SYNCRIP in the post-transcriptional regulation of neuronal mRNAs. See text for further details
Finally, although the in vivo function of SYNCRIP in the mammalian brain is not known, our results already provide intriguing links to potential pathophysiological roles of SYNCRIP. Mutations in some of the top targets involved in microtubule dynamics have been found in neurodevelopmental disorders such as lissencephaly (Dcx, Dclk1, Pafah1b1, Tuba1a) and polymicrogyria (Tuba1a, Tubb3) [Citation44]. Follow-up functional experiments, e.g. SYNCRIP knockdown by in utero electroporation, therefore promise to yield important insight into disease-relevant processes of early brain development, such as layering and growth of the mammalian cortex.
Supplemental Material
Download MS Excel (204.7 KB)Supplemental Material
Download PDF (921.2 KB)Acknowledgments
We thank E. Becker and R. Gondrum for excellent technical assistance and O. Rossbach for helpful advice during establishment of iCLIP procedure.
Disclosure statement
The authors declare no conflict of interest.
Data availability
SYNCRIP iCLIP data is provided in Supplementary Tables T1-T6 and has been submitted to the GEO database, accession number GSE149561. A secure token for peer-review will be provided upon request. Sequence tracks can be downloaded from the following link: https://eur03.safelinks.protection.outlook.com/?url=https%3A%2F%2Fgenome-euro.ucsc.edu%2Fs%2FKhudaybe%2FiCLIP_SYNCRIP_rn6&data=01%7C01%7Cnar%40soton.ac.uk%7C71e461bf2bdb485f193c08d7eb415f3f%7C4a5378f929f44d3ebe89669d03ada9d8%7C0&sdata=4QylAn9Zg9vqDpLHeS8siF27KZ0J6PuIJ4rAI0YqT4Y%3D&reserved=0
Supplementary material
Supplemental data for this article can be accessed here.
Additional information
Funding
References
- Mizutani A, Fukuda M, Ibata K, et al. SYNCRIP, a cytoplasmic counterpart of heterogeneous nuclear ribonucleoprotein R, interacts with ubiquitous synaptotagmin isoforms. J Biol Chem. 2000;275:9823–9831.
- Mukhopadhyay R, Jia J, Arif A, et al. The GAIT system: a gatekeeper of inflammatory gene expression. Trends Biochem Sci. 2009;34:324–331.
- Vu LP, Prieto C, Amin EM, et al. Functional screen of MSI2 interactors identifies an essential role for SYNCRIP in myeloid leukemia stem cells. Nat Genet. 2017;49:866–875.
- Rossoll W, Kroning AK, Ohndorf UM, et al. Specific interaction of Smn, the spinal muscular atrophy determining gene product, with hnRNP-R and gry-rbp/hnRNP-Q: a role for Smn in RNA processing in motor axons? Hum Mol Genet. 2002;11:93–105.
- Bannai H, Fukatsu K, Mizutani A, et al. An RNA-interacting protein, SYNCRIP (heterogeneous nuclear ribonuclear protein Q1/NSAP1) is a component of mRNA granule transported with inositol 1,4,5-trisphosphate receptor type 1 mRNA in neuronal dendrites. J Biol Chem. 2004;279:53427–53434.
- Duning K, Buck F, Barnekow A, et al. SYNCRIP, a component of dendritically localized mRNPs, binds to the translation regulator BC200 RNA. J Neurochem. 2008;105:351–359.
- Kanai Y, Dohmae N, Hirokawa N. Kinesin transports RNA: isolation and characterization of an RNA-transporting granule. Neuron. 2004;43:513–525.
- Xing L, Yao X, Williams KR, et al. Negative regulation of RhoA translation and signaling by hnRNP-Q1 affects cellular morphogenesis. Mol Biol Cell. 2012;23:1500–1509.
- Chen HH, Yu HI, Chiang WC, et al. hnRNP Q regulates Cdc42-mediated neuronal morphogenesis. Mol Cell Biol. 2012;32:2224–2238.
- Williams KR, McAninch DS, Stefanovic S, et al. hnRNP-Q1 represses nascent axon growth in cortical neurons by inhibiting Gap-43 mRNA translation. Mol Biol Cell. 2016;27:518–534.
- Svitkin YV, Yanagiya A, Karetnikov AE, et al. Control of translation and miRNA-dependent repression by a novel poly(A) binding protein, hnRNP-Q. PLoS Biol. 2013;11:e1001564.
- Santangelo L, Giurato G, Cicchini C, et al. The RNA-binding protein SYNCRIP is a component of the hepatocyte exosomal machinery controlling MicroRNA sorting. Cell Rep. 2016;17:799–808.
- Hobor F, Dallmann A, Ball NJ, et al. A cryptic RNA-binding domain mediates Syncrip recognition and exosomal partitioning of miRNA targets. Nat Commun. 2018;9:831.
- Chen Y, Chan J, Chen W, et al. SYNCRIP, a new player in pri-let-7a processing. RNA. 2020;26:290–305.
- McDermott SM, Meignin C, Rappsilber J, et al. Drosophila Syncrip binds the gurken mRNA localisation signal and regulates localised transcripts during axis specification. Biol Open. 2012;1:488–497.
- McDermott SM, Yang L, Halstead JM, et al. Drosophila Syncrip modulates the expression of mRNAs encoding key synaptic proteins required for morphology at the neuromuscular junction. RNA. 2014;20:1593–1606.
- Halstead JM, Lin YQ, Durraine L, et al. Syncrip/hnRNP Q influences synaptic transmission and regulates BMP signaling at the Drosophila neuromuscular synapse. Biol Open. 2014;3:839–849.
- Titlow J, Robertson F, Jarvelin A, et al. Syncrip/hnRNP Q is required for activity-induced Msp300/Nesprin-1 expression and new synapse formation. J Cell Biol. 2020;219. DOI:10.1083/jcb.201903135
- Liu Z, Yang CP, Sugino K, et al. Opposing intrinsic temporal gradients guide neural stem cell production of varied neuronal fates. Science. 2015;350:317–320.
- Schratt GM, Tuebing F, Nigh EA, et al. A brain-specific microRNA regulates dendritic spine development. Nature. 2006;439:283–289.
- Rajman M, Metge F, Fiore R, et al. A microRNA-129-5p/Rbfox crosstalk coordinates homeostatic downscaling of excitatory synapses. Embo J. 2017;36:1770–1787.
- Bicker S, Khudayberdiev S, Weiss K, et al. The DEAH-box helicase DHX36 mediates dendritic localization of the neuronal precursor-microRNA-134. Genes Dev. 2013;27:991–996.
- Khudayberdiev SA, Zampa F, Rajman M, et al. A comprehensive characterization of the nuclear microRNA repertoire of post-mitotic neurons. Front Mol Neurosci. 2013;6:43.
- Sutandy FX, Hildebrandt A, Konig J. Profiling the binding sites of RNA-binding proteins with nucleotide resolution using iCLIP. Methods Mol Biol. 2016;1358:175–195.
- Afgan E, Baker D, Batut B, et al. The Galaxy platform for accessible, reproducible and collaborative biomedical analyses: 2018 update. Nucleic Acids Res. 2018;46:W537–W544.
- Dobin A, Davis CA, Schlesinger F, et al. STAR: ultrafast universal RNA-seq aligner. Bioinformatics. 2013;29:15–21.
- Uren PJ, Bahrami-Samani E, Burns SC, et al. Site identification in high-throughput RNA-protein interaction data. Bioinformatics. 2012;28:3013–3020.
- Ataman B, Boulting GL, Harmin DA, et al. Evolution of Osteocrin as an activity-regulated factor in the primate brain. Nature. 2016;539:242–247.
- Liao Y, Smyth GK, Shi W. featureCounts: an efficient general purpose program for assigning sequence reads to genomic features. Bioinformatics. 2014;30:923–930.
- Robinson MD, McCarthy DJ, Smyth GK. edgeR: a Bioconductor package for differential expression analysis of digital gene expression data. Bioinformatics. 2010;26:139–140.
- Patro R, Duggal G, Love MI, et al. Salmon provides fast and bias-aware quantification of transcript expression. Nat Methods. 2017;14:417–419.
- Lackinger M, Sungur AO, Daswani R, et al. A placental mammal-specific microRNA cluster acts as a natural brake for sociability in mice. EMBO Rep. 2019;20. DOI:10.15252/embr.201846429.
- Alexa A, Rahnenfuhrer J, Lengauer T. Improved scoring of functional groups from gene expression data by decorrelating GO graph structure. Bioinformatics. 2006;22:1600–1607.
- Lawrence M, Huber W, Pages H, et al. Software for computing and annotating genomic ranges. PLoS Comput Biol. 2013;9:e1003118.
- Bailey TL. DREME: motif discovery in transcription factor ChIP-seq data. Bioinformatics. 2011;27:1653–1659.
- Agarwal V, Bell GW, Nam JW, et al. Predicting effective microRNA target sites in mammalian mRNAs. Elife. 2015;4. DOI:10.7554/eLife.05005
- Ray D, Kazan H, Cook KB, et al. A compendium of RNA-binding motifs for decoding gene regulation. Nature. 2013;499:172–177.
- Hock J, Weinmann L, Ender C, et al. Proteomic and functional analysis of Argonaute-containing mRNA-protein complexes in human cells. EMBO Rep. 2007;8:1052–1060.
- Coles CH, Bradke F. Coordinating neuronal actin-microtubule dynamics. Curr Biol. 2015;25:R677–691.
- Kapitein LC, Hoogenraad CC. Building the neuronal microtubule cytoskeleton. Neuron. 2015;87:492–506.
- Yoo AS, Staahl BT, Chen L, et al. MicroRNA-mediated switching of chromatin-remodelling complexes in neural development. Nature. 2009;460:642–646.
- Makeyev EV, Zhang J, Carrasco MA, et al. The MicroRNA miR-124 promotes neuronal differentiation by triggering brain-specific alternative pre-mRNA splicing. Mol Cell. 2007;27:435–448.
- Herranz H, Cohen SM. MicroRNAs and gene regulatory networks: managing the impact of noise in biological systems. Genes Dev. 2010;24:1339–1344.
- Jamuar SS, Lam AT, Kircher M, et al. Somatic mutations in cerebral cortical malformations. N Engl J Med. 2014;371:733–743.