
ABSTRACT
RNA modifications are dynamic chemical entities that expand the RNA lexicon and regulate RNA fate. The most abundant modification present in mRNAs, N6-methyladenosine (m6A), has been implicated in neurogenesis and memory formation. However, whether additional RNA modifications may be playing a role in neuronal functions and in response to environmental queues is largely unknown. Here we characterize the biochemical function and cellular dynamics of two human RNA methyltransferases previously associated with neurological dysfunction, TRMT1 and its homolog, TRMT1-like (TRMT1L). Using a combination of next-generation sequencing, LC-MS/MS, patient-derived cell lines and knockout mouse models, we confirm the previously reported dimethylguanosine (m2,2G) activity of TRMT1 in tRNAs, as well as reveal that TRMT1L, whose activity was unknown, is responsible for methylating a subset of cytosolic tRNAAla(AGC) isodecoders at position 26. Using a cellular in vitro model that mimics neuronal activation and long term potentiation, we find that both TRMT1 and TRMT1L change their subcellular localization upon neuronal activation. Specifically, we observe a major subcellular relocalization from mitochondria and other cytoplasmic domains (TRMT1) and nucleoli (TRMT1L) to different small punctate compartments in the nucleus, which are as yet uncharacterized. This phenomenon does not occur upon heat shock, suggesting that the relocalization of TRMT1 and TRMT1L is not a general reaction to stress, but rather a specific response to neuronal activation. Our results suggest that subcellular relocalization of RNA modification enzymes may play a role in neuronal plasticity and transmission of information, presumably by addressing new targets.
Introduction
Epigenetic processes involving DNA methylation and histone modifications are vital for learning and memory formation [Citation1]. RNA modifications, which are much less characterized, add an additional and largely unexplored layer of regulation and avenue for environmental response in cellular function [Citation2–9]. Dysregulation of the RNA modification machinery has already been linked to many human diseases [Citation10–13], including several neurological diseases [Citation14–20]. A number of studies have pointed to RNA modifications as potential molecular mechanisms underlying the experience-dependent plasticity of the brain [Citation2,Citation7,Citation21–23], but a systematic characterization of which RNA modifications may be playing a role in neuronal plasticity and response to environmental signals is lacking.
Cognitive impairment of intellectual disability (ID) is a genetically heterogeneous neurodevelopmental disorder, estimated to affect 2–3% of the population [Citation24]. Mutations in three RNA methyltransferase-encoding genes have been linked to intellectual disability, suggesting an important role for RNA modifications in the development of cognitive functions. These include the 2ʹ-O-methyltransferase FTSJ1, identified in X-linked non-syndromic intellectual disability in which mental retardation is the sole clinical feature [Citation25,Citation26], as well as the m5C methyltransferase NSUN2 and the m2,2G methyltransferase TRMT1, both of which have been identified as the cause of autosomal-recessive intellectual disability (ARID) [Citation27–30].
TRMT1 is an RNA methyltransferase responsible for the formation of N2,N2-dimethylguanosine (m2,2G) at position 26 in both cytosolic and mitochondrial tRNAs [Citation31,Citation32]. In vertebrates, TRMT1 has a homolog, TRMT1-like (TRMT1L), in which the methyltransferase domain is conserved [Citation33]. The enzymatic activity of human TRMT1 has been previously demonstrated [Citation31,Citation32], but the function and targets of TRMT1L are unknown. Similarly to TRMT1, the TRMT1L gene is involved in cognitive functioning [Citation33]. Indeed, knockout of TRMT1L in mice has been shown to cause altered motor coordination and aberrant exploratory behaviour [Citation33], suggesting that its activity is also associated with neurological functions.
To dissect the biological role of TRMT1L, here we employed a combined strategy of Liquid Chromatography-Mass Spectrometry (LC-MS/MS) and next-generation sequencing (NGS) to map m2,2G modifications both in long and short RNAs in TRMT1L knock-out and wild type mouse brain samples. As a control, we also analysed the m2,2G modifications in TRMT1-deficient and control cell lines. Through this analysis, we confirm the previously reported dimethylase activity of TRMT1 in cytosolic and mitochondrial tRNAs [Citation31,Citation32], as well as show that TRMT1L specifically dimethylates a subset of tRNAAla(AGC) isodecoders at position 26.
Using a cellular in vitro model that mimics neuronal activation and long term potentiation [Citation34], we examine the behaviour of these RNA methyltransferases, finding that both TRMT1 and TRMT1L change their subcellular localization upon neuronal activation. Specifically, we observe a major subcellular relocalization from mitochondria and other cytoplasmic domains (TRMT1) and nucleoli (TRMT1L) to different small punctate compartments in the nucleus, which are as yet uncharacterized. This phenomenon does not occur upon stresses such as heat shock, suggesting that the relocalization of TRMT1 and TRMT1L is not a general reaction to stress, but rather a specific response to neuronal activation.
Results
Evolutionary analysis of the human m2,2G modification machinery: TRMT1 and TRMT1L
Human TRMT1 and TRMT1L only share 20% similarity in their DNA sequence [Citation32]; however, their domain structure is relatively similar, including a conserved homologous methyltransferase domain (). Whilst the dimethylguanosine transferase activity of TRMT1 has been previously reported [Citation31,Citation32], the activity of TRMT1L is unknown.
Figure 1. Characterization of the m2,2G modification machinery. (A) Chemical structure and dimethylation reaction catalysed by TRMT1 and potentially by TRMT1L is depicted. On the right part of the panel, a schematic representation of the domains found in proteins containing TRM1 methyltransferase domain (TRMT1L, TRMT1 and TRM1) is shown. The canonical isoform has been chosen to depict each protein. See algo Figure S2 for predicted domains in individual isoforms. (B) Phylogenetic tree of eukaryotic proteins with homology to the TRM1 methyltransferase domain, showing that TRMT1L proteins are paralogs of TRMT1. (C) Immunoblotting of TRMT1L and TRMT1 in human SH-SY5Y cells, which were fractionated into nuclear and cytoplasmic content. H3 was used as a nuclear marker, whereas GAPDH was used as cytoplasmic marker. Biological triplicates are shown. See also Figure S3 for uncropped immunoblot images. (D,E) Immunofluorescence of TRMT1 (D) and TRMT1L (E) in SH-SY5Y cells. Nucleus has been marked with DAPI, cytoplasm has been labelled using anti-phalloidin antibody, mitotracker has been used to label the mitochondria, and anti-fibrillarin has been used to label the nucleolus. See also Figure S4 for immunofluorescence results in HeLa and HEK293
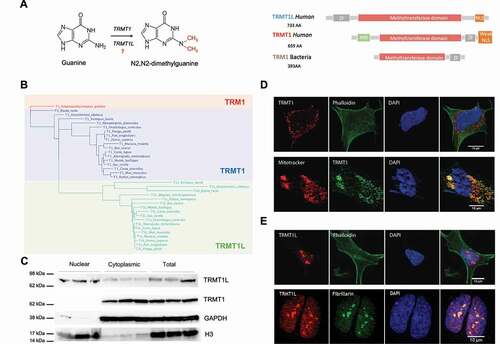
To identify the full set of enzymes potentially capable of placing m2,2G in the human transcriptome, we performed a Hidden Markov Model (HMM)-based search of the m2,2G methyltransferase domain (Pfam domain annotation: TRM), finding that only TRMT1 and TRMT1L showed statistically significant matches in human (see Methods). We found that the duplication of TRMT1 occurred at the base of vertebrates, originating TRMT1L (), which was retained in all vertebrate species analysed. From our analyses, we find that the TRM m2,2G methyltransferase domain is found in all eukaryal and archaeal species analysed, as previously reported [Citation35], but also in a limited set of bacterial phyla (Aquificales and Cyanobacteria), likely acquired via horizontal gene transfer (Figure S1).
TRMT1 and TRMT1L have different subcellular localizations
TRMT1 and TRMT1L are predicted to reside in different organelles based on their signal peptides (, see also Figure S2). Specifically, TRMT1 is predicted to contain a mitochondrial-targeting peptide signal, and thus is likely driving m2,2G methylation of mitochondrial RNAs, whereas a second TRMT1 isoform is predicted to remain in the cytoplasm (Figure S2, see also Methods). By contrast, TRMT1L contains a predicted strong NLS signal, and is therefore expected to reside in the nucleus.
To confirm the subcellular localization predictions, both Western Blot and immunofluorescence assays were performed. We observed that TRMT1 was located in punctate domains in the cytoplasm and in the mitochondria of neuroblastoma-derived SH-SY5Y cells ( see also Figure S3), whereas HeLa cells showed also nuclear localization in addition to cytoplasmic and mitochondrial localization (Figure S4A). The observed localizations are in agreement with the previously described activity of TRMT1 on both cytosolic and mitochondrial tRNAs [Citation31,Citation32]. By contrast, TRMT1L in SH-SY5Y cells was mainly localized in the nucleus (), in agreement with previous works studying TRMT1L localization in HeLa [Citation31], and more specifically, co-localizing with nucleoli (). To further validate the subcellular localization of TRMT1 and TRMT1L as well as the specificity of the respective TRMT1 and TRMT1L antibodies used, we performed a transfection for transient expression of TRMT1-FLAG and TRMT1L-FLAG in HEK293 cells (see Methods), finding that TRMT1 and TRMT1L stainings colocalized with those obtained using anti-FLAG in transfected cells (Figure S4B,C). Altogether, the distinct subcellular locations of these two enzymes suggest that TRMT1 and TRMT1L are addressing different RNA targets.
M2,2G is found in tRNAs, but also in higher RNA fractions in neuronal cell lines and tissues
Early in vitro studies in human cells showed that TRMT1 is responsible for placing m2,2G in numerous tRNAs at position 26 [Citation32]. More recently, using CRISPR gene knockout systems, it was shown that TRMT1 deletion leads to a loss of m2,2G in cytoplasmic and mitochondrial tRNAs [Citation31], confirming its activity in a cellular context. However, whether TRMT1 places m2,2G in substrates other than tRNAs, and what the activity and biological targets of TRMT1L may be, are still open questions.
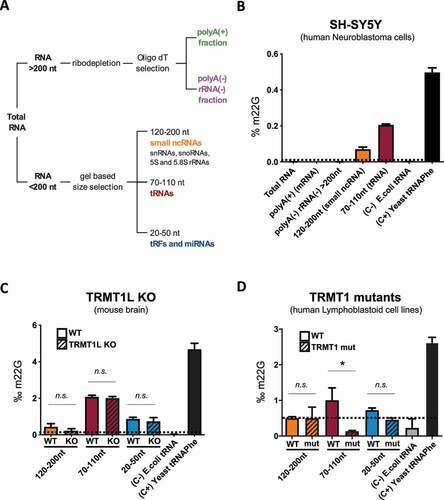
To decipher whether m2,2G is found beyond tRNAs, we performed LC-MS/MS analysis of specific RNA pools. Total RNA samples were fractionated into 5 different pools (see Methods), corresponding to: (i) total RNA fraction (containing mostly rRNAs), (ii) ribodepleted polyA(+) fraction (containing mostly mRNAs), (iii) ribodepleted non-polyA(+) fraction (containing lncRNAs), (iv) 120–200nt RNAs (containing snRNAs and snoRNAs), and (v) 70–110nt RNAs (containing mostly tRNAs) (). For each RNA pool, we quantified the m2,2G levels using LC-MS/MS, in biological triplicates, and normalized its abundance to the abundance of unmodified bases in each RNA pool. As expected, we were able to detect m2,2G in the 70–110nt RNA pool, which includes mature tRNAs. In addition, we also detected significant levels of m2,2G in the 120–200nt RNA fraction (), suggesting that m2,2G is not only found in mature tRNA molecules. Similarly, we detected significant levels of m2,2G in the 120–200nt RNA fraction in mouse brain samples (), suggesting that m2,2G is present beyond the mature tRNA fraction not only in neuronal cell lines, but also in tissues.
Figure 2. Quantification of m2,2G in different RNA pools using LC-MS/MS. (A) RNA fractionation strategy used for LC-MS/MS samples. (B) LC-MS/MS m2,2G quantification in the 5 different RNA pools of neuron-derived SH-SY5Y cells. (C) Relative proportion of m2,2G in 3 size selected RNA pools in TRMT1L KO mice brain samples, relative to WT mice brain samples. Standard deviation in panels B C and D denotes biological triplicates, except in the positive and negative controls, where standard deviation denotes technical triplicates. E. coli total tRNA was used as negative control (C-), as it does not contain m2,2G modifications, and S. cerevisiae tRNAPhe was used as positive control (C+), as it is known to contain m2,2G in position 26. (D) Relative proportion of m2,2G in 3 size selected RNA pools in human TRMT1 mutant patient-derived lymphoblastoid cells, relative to human TRMT1 wild-type patient-derived lymphoblastoid cells. Statistical significance was assessed using unpaired t-test (ns = non-significant change; * = p-value < 0.05)
LC-MS/MS identifies tRNAs as TRMT1 targets, but does not provide hints on TRMT1L targets
To identify the biological targets of TRMT1 or TRMT1L, we analysed the m2,2G levels in mouse TRMT1L knockout and human patient-derived TRMT1-deficient samples, compared to wild-type, using LC-MS/MS (-D, see also Methods). The data show that TRMT1 is largely responsible for m2,2G modification in tRNAs, in agreement with previous observations [Citation31,Citation32]. By contrast, TRMT1L knockout did not significantly alter the global m2,2G modification levels of any of the 3 RNA fractions examined ().
We then wondered whether TRMT1L might in fact be responsible for placing an RNA modification different to m2,2G, which could explain why m2,2G levels do not significantly vary between TRMT1L knockout and wild type samples. Using LC-MS/MS, we quantified the RNA modification levels of 27 distinct RNA modifications across 7 RNA pools of distinct RNA sizes (Figure S5A,B). We found that the depletion of TRMT1L led to modest decrease in the m2,2G levels in the 120–200nt RNA fraction as well as in the m2G levels in the 70–110nt RNA fraction (Figure S5A), although neither of these were found to be significant.
Mapping of TRMT1L-dependent modifications in the brain transcriptome
Whilst LC-MS/MS is a sensitive methodology that can accurately quantify RNA modifications, it does not identify which RNAs molecules are in fact modified. Therefore, we examined the RNA modification activity of TRMT1L using next-generation sequencing. Indeed, certain RNA modifications, such as m2,2G, affect the Watson-Crick base pairing moiety, and can be detected in the form of ‘mismatch signatures’ in RNA-seq datasets [Citation36–39]. The dimethylation of guanosine at the N2 position eliminates the ability of the N2 to function as a hydrogen bond donor, altering its pairing behaviour, and consequently affects the misincorporation and/or drop-off rate at that given position when reverse transcribed [Citation40]. Similarly, previous studies have shown that m1G and m2G modifications can be detected in the form of altered mismatch frequencies [Citation41], although the latter only causes moderate misincorporation defects [Citation40,Citation42,Citation43]. Overall, m2,2G RNA modifications constitute strong candidates for being detected using the non-random mismatch signature strategy in RNA-seq datasets.
We performed both small and long RNA sequencing of mouse brain samples in both TRMT1L knockout and wild-type mice in biological triplicates (), using a modified library preparation protocol to capture small RNAs up to 150 nt (see Methods). We found that our strategy was able to capture known m2,2G modification sites in position 26 of multiple tRNAs, in a highly reproducible manner (). We observed that the presence of m2,2G modifications caused characteristic mismatch signatures at the modified sites, mainly in the form of G-to-T mismatches (), in agreement with previous reports [Citation41]. By contrast, we were unable to identify mismatch signatures in the vast majority of m2G-modified sites in mouse tRNAs. Thus, we concluded that our RNA-seq mismatch analysis would be capturing information related to changes in m2,2G modifications levels, but not from m2G-modified sites.
Figure 3. M2,2G, but not m2G, can be identified via non-random mismatch signatures in RNA-seq datasets. (A) Strategy for transcriptome-wide detection of m2,2G RNA modifications. (B) IGV tracks illustrating that previously known m2,2G modifications are detected in position 26 of eukaryotic tRNAs, both in wild type and knockout strains. Positions with mismatch frequency greater than 10% are coloured according to the relative base frequency at that position (A: green, G: orange; T:red, C: blue), otherwise the position is depicted in grey. (C) Ternary plot of the mismatch signatures of m2,2G, m1G and m2G in known tRNA-modified positions. (D) IGV tracks of both WT and TRMT1L KO centred on several tRNAAla(AGC) gene clusters, showing that the mismatch signatures observed in position 26 consistently disappear in the knockout strain, in all 3 biological replicates. The m2,2G26 sites are depicted with green asterisks. Positions with mismatch frequency greater than 10% are coloured according to the relative base frequency at that position (A: green, G: orange; T:red, C: blue), otherwise the position is depicted in grey. (E) Comparison of the mean mismatch frequencies observed in tRNA gene clusters of TRMT1L knockout brain samples, relative to wild type. Only tRNA positions with mismatch frequencies greater than 0.1 in the wild type strains have been included in the analysis. The 3 tRNAAla(AGC) gene clusters that show differential mismatch frequency in TRMT1L knockout samples are highlighted in red. Mismatches seen in positions 34 and 37 of tRNAAla(AGC) correspond to mismatch signatures caused by the presence of inosine (I34) and 1-methylinosine (m1I37), respectively
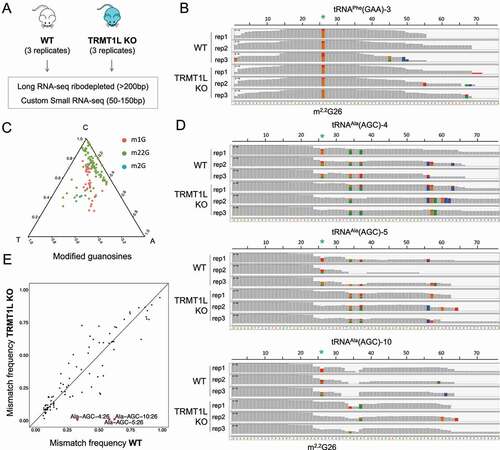
We then proceeded with differential mismatch frequency analysis, first focusing on the subset of reads mapping to mature tRNAs (see Methods). Our analysis identified 3 tRNAAla(AGC) gene clusters whose mismatch error at position 26 completely disappeared in all 3 replicates, suggesting that m2,2G modifications present in these tRNAs were exclusively placed by TRMT1L (,E). We then examined the mismatch signature in reads mapping to other RNA pools, including small non-coding RNAs, pre-tRNAs, rRNAs, lincRNAs and mRNAs; however, we did not identify any significant site whose mismatch frequency changed upon TRMT1L knockout (Figure S6).
tRNAAla(AGC) genes modified by TRMT1L are not exclusively expressed in neuronal tissues
Previous studies have shown that a mutation in the central nervous system (CNS)-specific tRNAArg(UCU) gene can lead to neurodegeneration in mice [Citation44]. The fact that the tRNAArg(UCU) gene is only expressed in neuronal tissues explains why the phenotype of the mutant mice was neurological. Following this line of thought, we reasoned the subset of tRNAAla genes that is targeted by TRMT1L might be only expressed in neuronal tissues, thus potentially explaining the neurological phenotype observed in TRMT1L knockout mice.
To test this hypothesis, we re-analysed publicly available small RNA-seq data from mice brain and liver samples across developmental stages [Citation45]. Pairwise comparison of tRNA levels in brain and liver tissues identified two tRNAs that were brain-specific: tRNAArg(UCU), as previously reported, and tRNAAla(UGC) (Figure S7A). However, we did not identify any tRNAAla(AGC) that was brain-specific (Figure S7B). Thus, we conclude that the cognitive impairment observed in TRMT1L knockout mice is not a simple consequence of brain-specific expression of the tRNA genes that are being modified by the enzyme.
Neuronal activation causes subcellular relocalization of the m2,2G modification machinery
To explore the roles of TRMT1 and TRMT1L in neuronal activity, we compared SH-SY5Y neuroblastoma cells before and after depolarization with potassium chloride (KCl), a system that has been used to mimic long-term potentiation (LTP) [Citation34]. Adding 50 mM KCl to the medium for 30 seconds causes a short depolarization burst that leads to changes in the expression of immediate early gene (IEG) levels in neuronal cells [Citation46], which have been used as markers for LTP in neuronal cell lines [Citation47]. Stimulation-dependent changes in gene expression of the IEGs (C-FOS, ARC, EGR1) were validated by qPCR (Figu re S8). Under these conditions, we found that TRMT1 relocalizes from the cytoplasm and mitochondria to the nucleus (). Likewise, TRMT1L moves from the nucleoli to a similar dotted domain pattern in the nucleus (,C). A co-localization experiment showed that, even though TRMT1 and TRMT1L have a similar pattern after activation (), they do not colocalize in the nucleus (), suggesting that they are being trafficked to different specialized subnuclear domains whose function(s) are yet unknown, indicating the precision and importance of dynamic subcellular localization, the mechanisms of which are also unknown. Moreover, it suggests that these two enzymes may have different RNA targets both before and after activation.
Figure 4. Neuronal activation causes TRMT1 and TRMTL1 subcellular re-localization and affects m2,2G cellular levels. (A,B) Immunofluorescence experiments of SH-SY5Y cells upon neuronal activation, imaged at 0 h (untreated, T0), 1 hour post-activation (T1), 3 hours post-activation (T3) and 6 hours post-activation (T6). SH-SY5Y cells were stained with anti-TRMT1 (A) or anti-TRMT1L (B) antibodies. DAPI was used as a nuclear marker. (C) Schematic illustration of the relocation patterns that occur upon neuronal activation, for TRMT1 (left) and TRMT1L (right). (D) Relative proportion of cells stained in the nucleus (upper panel) upon neuronal activation. In the bottom panel, the proportion of cells with TRMT1L nuclear dotted pattern upon activation is shown. (E) Immunofluorescence of SH-SY5Y cells before (T0) and 6 hours after neuronal activation (T6). Upon activation, TRMT1 relocalizes from cytosol and mitochondrial to the nuclei, but does not colocalize with TRMT1L. (F) Abundance of m2,2G RNA modifications in different RNA pools upon neuronal activation, measured at three time points (t = 0 h, 6 h and 24 h post-activation). E. coli total tRNA was used as negative control (C-), and yeast tRNAPhe was used as positive control (C+). Error bars represent standard deviations from 3 biological triplicates. Statistical significance was assessed using unpaired t-test (ns = non-significant change; * = p-value < 0.05)
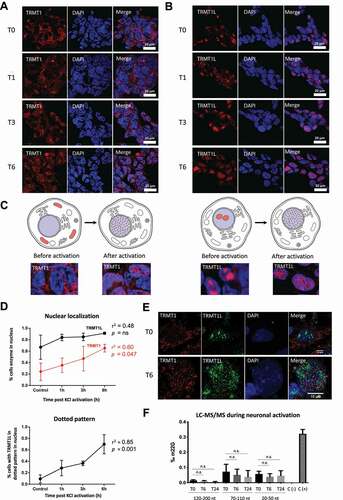
We then asked whether the relocation of TRMT1 to the nucleus upon neuronal activation might be accompanied by a change in the m2,2G levels of the cells. To this end, we analysed the m2,2G levels of each small RNA fraction individually (120–200nt, 70–110nt and 20–50nt) in SH-SY5Y cells during activation (t = 0 h, 6 h and 24 h post-activation). Although we observed a slight decrease in m2,2G levels upon neuronal activation, these differences were not statistically significant ().
Previous studies have shown that the activity of m6A RNA writer and reader enzymes, as well as the RNA modification levels, vary upon exposure of cells to stress conditions, such as heat shock or chemical stress [Citation48–50]. Thus, we investigated whether exposure to heat shock might also cause changes in the localization of TRMT1 and TRMT1L. We found that neither TRMT1 nor TRMT1L change their localization patterns upon exposure to heat shock stress (Figure S9) during a 24 h time course, in contrast to our observations when exposing SH-SY5Y cells to neuronal stimulation conditions (,B). Altogether, our results suggest that the relocalization of TRMT1 and TRMT1L is not a general response to cellular stress, but rather a specific phenotype related to neuronal activation.
Discussion
Base modifications overlay sequence information to expand the lexicon of RNA, introducing changes into structural, coding or regulatory information. RNA modifications are involved in many biological processes, including cellular differentiation [Citation51], sex determination [Citation52,Citation53], maternal-to-zygotic mRNA clearance [Citation54] and stress responses [Citation48,Citation55]. However, much less is currently known about the roles of RNA modification in synaptic plasticity and or memory formation [Citation2]. In this regard, several works have provided genetic evidence that some of these RNA modifications, including ribose, cytosine and guanine methylation, may play a role in cognitive function [Citation25–30]. Unfortunately, with the exception of m6A modifications [Citation21,Citation56–58], the dynamics of RNA modification in neuronal biology have yet to be studied, largely due to the difficulty of identifying RNA modifications, a problem that is beginning to be solved by the use of direct RNA sequencing nanopore technologies [Citation59–62].
In this study, we focused on two RNA methyltransferases that have been previously associated with cognitive dysfunctions: TRMT1, the loss of which causes intellectual disability in humans [Citation27], and its ortholog TRMT1L, the loss of which causes behavioural changes and motor defects in mice [Citation33]. We confirmed that TRMT1 is responsible for placing m2,2G in tRNA molecules (), and revealed that TRMT1L is responsible for placing m2,2G in a subset of tRNAAla(AGC) genes (,E). Perhaps not coincidentally, a number of neurological defects result from the loss of tRNAs and related enzymes, whose expression is not necessarily brain-specific [Citation10,Citation13,Citation63,Citation64] and whose effects may be mediated through products of tRNA processing [Citation65].
Our LC-MS/MS results suggest that m2,2G is present not only in tRNAs, but also in the RNA fraction of 120–200 nt (, see also Figure S5A). To our knowledge, this is the first time that m2,2G is observed beyond the tRNA fraction. Depletion of TRMT1 activity did not alter the m2,2G levels detected in this RNA fraction, suggesting that TRMT1 is not the enzyme responsible for placing m2,2G in this RNA pool. By contrast, we observed a modest -yet not statistically significant- decrease in the m2,2G levels present in the 120–200 nt fraction upon TRMT1L depletion. Unfortunately, our bioinformatic pipeline used to analyse the RNAseq libraries from TRMT1L wild type and knockout mice brain samples did not identify any m2,2G modifications present in RNA molecules beyond tRNAs (Figure S6). One possibility is that this specific RNA pool is in fact not modified by TRMT1L, and that an additional enzyme, evolutionarily unrelated to the TRM domain, might be placing m2,2G modifications in the 120–200 nt RNA fraction. Alternatively, the m2,2G modification stoichiometries in these RNAs might be low, which could explain why our bioinformatic pipeline to identify m2,2G modifications using mismatch signatures might have missed it, as they can only capture sites that are modified at mid-high stoichiometries. Future work will be needed to identify which RNA molecules -beyond tRNAs- contain m2,2G modifications, as well as to reveal which is the enzyme responsible for placing them.
Previous works have shown that nuclear bodies, including nucleoli, Cajal bodies, nuclear speckles and paraspeckles can dynamically respond to stress, altered metabolic conditions and alterations in cellular signalling [Citation66]. Here we show that TRMT1 and TRMT1L are localized in different subcompartments in the cell () and that their localization, and presumably their targets, are altered upon neuronal activation (). To the best of our knowledge this is the first time that the localization of RNA modification enzymes has been shown to change in response to neuronal activation. The subcellular and subnuclear compartments between which they shuttle (with the exception of the nucleolus) are as yet largely uncharacterized, indicating another unexplored level of neuronal organization, embedded in domains that are likely scaffolded and potentially phase-separated by other RNAs [Citation67,Citation68]. This level of complexity is unprecedented and opens new perspectives in the complex path to the understanding of brain development and neuronal function.
A plethora of molecular functions for RNA modifications have been revealed in the past few years, including the regulation of alternative splicing, translation efficiency and mRNA half-life [Citation69–72]. Although it is yet unclear to what extent RNA modifications may affect the subcellular localization of RNAs, previous works have shown that some RNA modifications facilitate phase separation [Citation68,Citation73] and have proposed their involvement in RNA relocalization in neuronal cells [Citation57,Citation74]. Although evidence for a widespread involvement of RNA modifications in RNA localization is somewhat limited, observations across diverse systems and organisms urge for additional investigation. Future work will be needed to elucidate what is the interplay between modified RNAs, their modifying enzymes and the RNA subcellular localization in neuronal systems, as well as to characterize the functional consequences of the relocalization of RNA molecules to specific subcellular compartments.
Materials and methods
Cell culture and passaging
Human SH-SY5Y neuroblastoma cell lines were cultured in Gibco Life Technologies Dulbecco’s modified Eagle medium (DMEM), supplemented with 10% (v/v) fetal bovine serum (FBS), and 1% Penicillin Streptomycin (Life Technologies, #15070-063). Cells were incubated at 37°C in a humidified atmosphere containing 5% CO2. Cells were grown until they reached 80% confluency and washed once with PBS before splitting. For a 150 cm2 flask, cells were incubated with 5 ml trypsin (Sigma), for 2 min at 37°C for detachment. Trypsin was neutralized by adding 15 ml of DMEM with 10% FBS. From this mix, 5 ml was added to 30 ml of DMEM with 10% FBS in a new flask of 150 cm2, bringing the cells to a confluence of 20%. Cells were discarded when they reached passage number 12.
Patient-derived TRMT1 mutant and control lymphoblastoid cell lines
B-lymphoid cell lines (LCLs) were established from healthy and affected individuals (Figure S10) by in vitro infection of peripheral blood mononuclear B cells with Epstein Barr Virus (EBV) based on standard protocols [Citation75]. The mutations in the TRMT1 gene (NM_017722) in the patients used to derive the LCLs, as well as the clinical phenotypes of these patients have been previously described [Citation27,Citation76]. Healthy individuals used in this work contained a single copy of the mutated TRMT1 gene and did not show intellectual disability or apparent clinical phenotypes [Citation76], whereas affected individuals contained both TRMT1 gene copies with the 1332_1333 deletion in the coding sequence of TRMT1, and showed intellectual disability (ID) as well as other clinical phenotypes (Table S1). All LCL cell lines used in this study were taken from a family with a pY445fs mutation in the TRMT1 coding region (c.1332_1333delGT; p.Y445fs). TRMT1 pY445fs mutation was also confirmed in the LCLs through RNAseq analysis (Figure S11). To generate LCLs, 10 ml of peripheral blood was collected from each patient in a sterile preservative-free heparin tube. Mononuclear cells were isolated from whole blood by density Ficoll-Hypaque gradient centrifugation, washed with medium RPMI three times. Pellets were resuspended in transformation-medium (B95-8 virus suspension, RPMI 1640, 20% FBS, 0.2 µg/ml Cyclosporin A). After obtaining appropriate growth, cells were transferred in a 25 cm2 filtrated flask, and cultured in RPMI 1640 (Gibco) supplemented with 1% penicillin-streptomycin (Gibco), 15% fetal bovine serum (FBS) (Gibco), 1 mM L-glutamine, 10 mM HEPES and 1% Gibco™ AmnioMAX™ in a 5% CO2, humidified, 37°C incubator up to 3–4 weeks. The culture media were changed every 3–4 days when cells showed extensive growth. Total cellular RNA was isolated from LCLs using VIOGENE miTotal RNA extraction miniprep kit (Cat #VTR1002), in biological triplicates.
TRMT1L knockout mice brain RNA samples
Trmtl1-like KO mice have been previously generated and described [Citation33]. Briefly, ES cells with a gene trap vector integration in intron 1 of the mouse Trmt1-like gene, were used to generate chimeric mice by morula aggregation with wildtype embryos (E2.5) obtained from superovulated CD1-females (Charles River). Following overnight culture of aggregates, blastocysts were transferred to foster mothers and chimeric offspring were mated to C57BL7/6 (Charles River) mice to generate heterozygous Trmt1-like progeny. Heterozygote mice were continuously backcrossed to the C57BL/6 line for more than 10 generations and characterized [Citation33]. Tissue samples for this study were obtained from Trmt1-likeWT/WTand Trmt1-likeGT/GT mutant mice at the same age of 96–97 days. Mice were culled by cervical dislocation and brains were immediately dissected and snap-frozen in liquid nitrogen and stored at −80°C. Total RNA was obtained by homogenizing whole brain tissues from wildtypes and Trmt1-like mutants using POLYTRON PT 1200E followed by TriZol extraction. TRMT1L knockout was also confirmed through RNAseq analysis (Figure S11).
Plasmids for over-expression of TRMT1-FLAG and TRMT1L-FLAG
TRMT1 and TRMT1L CDS sequences were cloned from the MGC premier human ORFeome v8.1 library. The TRMT1-FLAG construct consisted of the CDS of TRMT1 (Human ORFeome, Internal ID: 378, Clone ID: 3463518) followed by a FLAG epitope (DYKDDDDK) at the C-terminal end, whereas the FLAG-TRMT1L construct consisted of the CDS of TRMT1L (Human ORFeome, Internal ID: 10729, Clone ID: 5296208) with the addition of a FLAG epitope (DYKDDDDK) at the N-terminal end. FLAG-tagged constructs were inserted into a pcDNA3.1+ plasmid, respectively, and were used in subsequent transfection experiments. The FASTA sequences of the TRMT1-FLAG and TRMT1L-FLAG constructs used in this work can be found in Table S3.
Transfection and transient expression of TRMT1-FLAG and TRMT1L-FLAG
HEK293 cells were plated on glass coverslips in 12-well plates at 60.000 cells per coverslip and left overnight to adhere to the glass. Each well was transfected with 200 µl of serum-free medium, 4 µl of lipofectamine 2000 reagent and 1.6 µg of plasmid according to the manufacturer’s instructions. Cells were then transfected with either FLAG-tagged versions of TRMT1 (TRMT1-FLAG) or TRMT1L (TRMT1L-FLAG). Cells on coverslips were fixed 24 h after transfection and used for immunofluorescence assays.
Immunofluorescence assays
Coverslips were placed in 24-well plates, coated with Poly-L-Lysine for 5 min and dried overnight after washing 4 times with water. SH-SY5Y cells were plated at a density of 2.5 × 10⁵ in 500 μl of DMEM with 10% FBS and grown overnight. Cells were washed once at room temperature with PBS and fixed in pre-warmed (37°C) 4% paraformaldehyde/4% sucrose in phosphate-buffered saline (PBS) at room temperature for 15 min and then washed 3 times for 5 min with PBS. Cells were then permeabilized in 0.1% Triton X-100/0.1% Na-Citrate/PBS for 3 min at room temperature, and washed 3 times for 5 min in PBS. Cells were blocked in 10% FBS/PBS for 1 h at room temperature and incubated with anti-TRMT1 primary antibodies (dilution 1:100, Ab134965) or anti-TRMT1L (dilution 1:200, NBP18337) in blocking solution overnight at 4°C. Cells were then washed 3 times for 5 min in PBS, and incubated with secondary antibodies for 90 min at room temperature, followed by 4 washes with PBS. Coverslips were dipped in demineralized water, and mounted using immuno-fluore mounting medium (MP Biomedicals). Mitochondria staining was achieved using MitoTracker Red FM (Thermo Fisher), by adding MitoTracker 45 min before fixation to the growing medium to a final concentration of 100 nM. DAPI was employed at a 1:100 dilution, whereas phalloidin was employed at a 1:500 dilution. For co-immunofluorescence experiments of FLAG-tagged versions of TRMT1 and TRMT1L, coverslips were washed twice in PBS prior to fixation with 4% PFA for 20 minutes at room temperature, then washed twice with PBS. Cells were then permeabilized with 0.5% TritonX-100 in PBS for 15 minutes at room temperature, washed with PBS-T 0.1% and then blocked with 5% FBS in PBS-T 0.1%. Cells were then stained with rabbit anti-TRMT1 primary antibody (dilution 1:100, Ab134965), rabbit anti-TRMT1L (dilution 1:200, NBP18337) and/or mouse anti-FLAG (Sigma F1804-50UG, dilution 1:500) in blocking solution overnight at 4°C. Cells were then washed 3 times for 10 minutes in PBS-T 0.1%, and incubated with secondary antibodies Alexa Fluor 488 anti-mouse (Thermo Fisher Scientific A-11001, dilution 1:2000) and/or Alexa Fluor 555 anti-rabbit (Thermo Fisher Scientific A-21429, dilution 1:2000) in PBS-T 0.1% with Hoechst (1 μg/ml) for 90 minutes at room temperature, followed by 3 washes with PBS-T 0.1%, then coverslips were let dry and mounted.
Confocal imaging and image analysis
Confocal images were acquired using a LSM700 confocal laser-scanning upright microscope (Zeiss) with a 63x oil objective. The zoom was set between 1x and 2x, with a pinhole of 34 μM and a speed of 1.58 μs per pixel. Confocal laser intensity was set to 3 and the gain was adjusted per sample. The dimensions were set to 1024x1024pixels and averaged 4 times. All experiments were repeated 3 times and for each condition. The cell counter plugin of Fiji 1.49 (ImageJ) was used to quantify the movement of TRMT1 and TRMT1L after cell activation with KCl. Statistical analysis was done using GraphPad Prism 6, using linear regression analysis. Images for transient expression of FLAG-TRMT1 and FLAG-TRMT1L were acquired on a Leica-SPE microscope with a 63x oil objective and processed with Fiji 1.52.
Cellular fractionation
Cell fractionation was performed according to the protocol described by Suzuki et al [Citation77], with minor modifications. SH-SY5Y cells were grown as monolayers in 15 cm diameter dishes until reaching 80% confluence. Cells were washed twice in ice-cold phosphate buffer saline (PBS) pH 7.4 (130 mM NaCl, 2 mM KCl, 8 mM Na2HPO4, 1 mM KH2PO4), scraped from culture dishes and collected in 1.5 mL of ice-cold PBS. After 15 sec centrifugation in a top table microcentrifuge (Thermo Scientific, USA), cell pellets were resuspended in 750 μl of ice-cold 0.05% Nonidet P-40 (Roche Diagnostics, Germany) in PBS and 200 μl of the lysate was removed as ‘whole cell lysate’. The remaining material was centrifuged for 15 sec and 300 μl of the supernatant was removed as the ‘cytoplasmic fraction’. After removal of the remaining supernatant, the pellet was resuspended in 750 μl of ice-cold 0.075% NP40 in PBS, centrifuged for 15 sec and the supernatant was discarded. The pellet was designated as the nuclear fraction. Whole cell lysates and cytoplasmic fractions were quantified by measuring OD 280 nm in the Nanodrop 2000 Spectrophotometer (Thermo Scientific, USA).
Western Blot
Following subcellular fractionation, SH-SY5Y were washed with PBS, harvested and lysed with 70 μl of RIPA buffer Samples were then sonicated for 7 sec to fragment the DNA for easier loading. LDS Sample Buffer (Novex #B0007) was added and samples were heated to 70°C for 15 min. 20 μl were loaded onto a Novex Bolt 4–12% Bis-Tris Plus gel, and separated by electrophoresis for 50 min at 200 V. Following electrophoresis, samples were transferred to PVDF membranes using wet transfer apparatus (Xcell Surelock, Invitrogen) at 30 V for 90 min. Membranes were blocked in 5% (w/v) non-fat dry milk in TBS-T for 1 h at room temperature. Membranes were incubated with anti-TRMT1 (1:10,000, Ab134965) or anti-TRMT1L (1:2,000, NBP-1 88337) antibodies at 4°C overnight with rotation. After washing with TBS-T 3 times for 5 min, membranes were incubated for 90 min with appropriate horseradish peroxidase-conjugated secondary antibodies at 37°C. Protein bands were visualized using SuperSignal West Pico chemiluminescent Substrate (Thermo #34080) and imaged using Fusion FX (Vilber). Normalization and intensities were analysed using FusionCapt Advance FX7. For loading controls values were normalized against GAPDH (dilution 1:50.000, Ab8245) and Histone H3 (dilution 1:50.000, Ab1791).
RT-qPCR
SH-SY5Y cells plated in 6-well plates were lysed using 750 μl of QIAzol Lysis reagent (Qiagen) according to manufacturer’s instructions. Total RNA was extracted using the RNeasy mini kit (Qiagen #74104) according to manufacturer’s instructions. First strand cDNA was synthesized from 1 μg RNA, using SuperScript III First-Strand Synthesis System (Invitrogen, Life Technologies), and the synthesized cDNA was stored at −20°C until use. RT-qPCR was performed using the Bio-Rad CFX384 Real-Time PCR Detection System using primers (Table S2), using GAPDH and PGKI as internal controls. During the extension phase the fluorescent signals were collected and Ct values of the samples were calculated. Transcription levels of TRMT1 and TRMT1L were normalized to controls by the ∆∆Ct method (Livak and Schmittgen 2001). Results from triplicate experiments were grouped and an unpaired t-test was used to compare groups.
Preparation of samples for mass spectrometry: RNA isolation
For extracting different fractions of RNA from SH-SY5Y cell cultures, cells were grown until 80% confluency in a 150 cm2 flask. Cells were then washed once with PBS, incubated with 5 ml Trizol at room temperature for 5 min, and collected using a cell scraper. For each ml of sample, after which 300 μl of chloroform were added, vortexed for 15 s, incubated 5 min at RT, and spun down for 15 m at 4°C. The clear top phase was moved to a new tube, and the miRNeasy kit (Qiagen #217004) was used to separate the RNA contained in this phase in two fractions: <200 nt and >200 nt. Briefly, 1VOL of 70% ethanol was added to the RNA phase and vortexed for 5 s. The sample was then transferred to a miRNeasy spin column and spinned down for 30 s at max speed. This column collects all RNAs larger than 200 nt. 0.65 VOL 100% ethanol was added to the flow-through of the first spin column, and vortexed. Mix was then added to a second spin column to capture RNAs smaller than 200 nt. Both columns were washed with 700 μl RWT, 500 μl RPE (2x), and 80% Ethanol. Columns were centrifuged and air-dried before adding 30 μl RNase free H2O.
Preparation of samples for mass spectrometry: RNA fractionation
The >200 nt RNA fraction was ribo-depleted using non-overlapping DNA oligonucleotides that are complementary to rRNA 18s and 28s followed by digestion with HybridaseTM Thermostable RNaseH (Lucigen #H39500), as previously described [Citation78]. Briefly, 10 μg RNA sample was ribo-depleted by adding 10 μl of rRNA oligo library (100 μM), and incubated with 1x Hybridization buffer to a total volume of 20 μl. The incubation consisted in a down ramp from 95°C to 45°C with −0.1°C/s. When 45°C was reached, RNaseH (2 U/μl), MgCl2 (20 mM) was added and final volume was brought to 40 μl, and incubated at 45°C for 30 min. After incubation, 10 μl of H2O was added to bring the final volume to 50 μl. Then, 90 μl of RNAClean XP beads with 270 μl 100% Isopropanol was added for the purification step. Samples were placed on a magnet for 5 min and washed twice with 300 μl 85% Ethanol. Samples were then air-dried and RNA was eluted in 30 μl RNase free H2O. After ribodepletion, Dynabeads Oligo(dT)25 (Invitrogen #61,002) were used to separate the mRNA fraction. Dynabeads were resuspended thoroughly and placed on a magnet to aspirate the supernatant, and washed with 100 μl of Binding Buffer (20 mM Tris-HCl, pH7.5, 1.0 M LiCl, 2 mM EDTA) twice. After washing, Dynabeads were resuspended in 100 μl Binding Buffer. Samples were then adjusted to 75 μg in 100 μl 10 mM Tris-HCl pH 7.5, RNase-free H2O. 100 μl of Binding buffer was added to the samples, and were then incubated at 65°C for 2 min to disrupt secondary structures and immediately placed on ice. Then 100 μl of washed beads were added and the mix was placed on a rotator for 5 min. After rotation, samples were placed on a magnet for 2 min and supernatant containing lncRNA was removed and stored on ice. Beads were resuspended in Washing Buffer B by pipetting carefully. Supernatant was again removed on the magnet and this step was repeated once. mRNA was then eluted from the beads with 20 μl 10 mM Tris-HCl by heating to 80°C for 2 min. The samples were then immediately placed on the magnet and eluted mRNA was transferred to a new tube and stored in −80°C. The supernatant containing the lncRNA was precipitated by adding 0.1x the volume in Ammonium Acetate 7.5 M and 3x the volume in 100% Ethanol with 1 μl of Pellet paint. Samples were vortexed for 10 s and incubated overnight at −20°C. The next day samples were spinned down for 30 min at 4°C. Pellet was washed twice with 75% Ethanol and air-dried for 15 min before eluting in 30 μl RNase-free water.
The <200nt RNA fractions were treated with Turbo DNAse (Invitrogen AM2238) according to manufacturer recommendations. After the treatment, RNA samples were recovered on column using the kit RNA Clean & Concentrator (Zymo Research R1017). Samples were further subdivided into three fractions (120–200nt, 70–110nt, and 20–50nt) by electrophoretic separation and gel excision. Briefly, a 15% TBE-Urea gel (Invitrogen, 1.0 mm x 10wells, #EC6885BOX) was pre-run at 100 V for 30 min with 0.5x TBE (Novex TBE running buffer, #LC6675). Approximately 8 μg of <200nt RNA per sample was mixed to an equal volume of 2x loading dye (NEB #B0363A) and incubated at 70°C for 5 min. The gel wells were washed from urea, and 20 μl per well was added, leaving an empty well between samples to avoid cross-sample contamination. Electrophoresis was carried out at 100 V for 2 hours. The gel was then placed on a shaker for 5 min in 0.5x TBE, RNase free H2O with 1:10,000 SYBR Gold nucleic acid gel stain (Life tech #S11494), and three bands were excised under a UV-light. RNA was extracted from the gel and purified using the kit ZR small-RNA PAGE Recovery (Zymo Research R1070) following the manufacturer recommendations. Samples were eluted from the column in 10 μl RNAse-free water.
Digestion of RNA into nucleosides for LC-MS/MS
For RNA nucleoside digestion, a maximum of 1 μg of sample was mixed with 250 U Benzonase Nuclease (E1014-5KU), 200 mU Phosphodiesterase I (P-3243, Sigma), 200 U Alkaline phosphatase (P-7923-2KU, Sigma), 20 mM Tris-HCl buffer pH 7.9, 100 mM NaCl, 20 mM, and H2O up to 50 μl, and incubated for 6 hours at 37°C. After incubation samples were stored in −80°C until the LC-MS/MS experiment. tRNAPhe from S. cerevisiae (Sigma, R4018) was used as positive control (m2,2G-positive), and total tRNA from E. coli (Sigma, R1753) was used as negative control (m2,2G-negative).
LC-MS/MS analysis – m22G modifications
The UHPLC-MS/MS system consisted of an Ultra High Performance Liquid Chromatography Accela Pump (Thermo Fisher Scientific, Waltham, USA) and HTC PAL autosampler (CTC Analytics, Zwingen, Switzerland) coupled directly to a TSQ Quantum Access triple quadrupole mass spectrometer (Thermo Fisher Scientific) via an electrospray interface. Liquid chromatography was performed on an Acquity UHPLC HSS T3 Column, 2.1 × 100 mm, 1.8 µm (Waters, Milford, USA). 10 µl of the sample was analysed using gradient elution with aqueous 0.1% formic acid (Solvent A) and 0.1% formic acid in acetonitrile (Solvent B) at a flow of 0.4 ml/min over 7 minutes. The acetonitrile gradient increased linearly from 0% at 1.5 minutes to 100% at 6 minutes and held for 0.5 minutes before returning to 0% at 6.60 and remaining there until 8 minutes. The divert valve was set to waste during the first 0.6 minutes of the run. Analysis was performed in positive ionization mode using selected reaction monitoring (SRM). Mass spectrometric conditions were optimized for sensitivity using infusions of analyte standards. The sheath gas pressure and the auxiliary gas pressure were 30 and 5 (Thermo Fisher arbitrary units) respectively. The probe temperature was 200°C, the capillary temperature was 330°C and the tube lens offset was 90 V. The mass to charge transitions and collision energies used to detect and quantify the analytes monitored were, for adenosine (A): 268 (136 at 17 V), cytidine (C): 244 (112 at 12 V), guanosine (G): 284 (152 at 14 V), uridine (U): 245 (113 at 10 V), and d-(dimethylamino)guanosine (m2,2G): 312 (180 at 15 V). 1 alternate SRM transition was also acquired for each analyte as a qualifier to assist if required in the case of interference. Standards used for calibration curves included: adenosine (Sigma-Aldrich, A9251), cytidine (Sigma-Aldrich, C122106), guanosine (Sigma-Aldrich, G6752), uridine (Sigma-Aldrich, U3750), 2-(dimethylamino)guanosine (Santa Cruz, sc-220667). Data processing of chromatograms was performed using the Quanbrowser function of the Xcalibur Software package version 2.0.7 (Thermo Fisher Scientific). Quantification was performed using an external calibration curve over the range 10 pg to 200 ng for A, C, G, U and 10 pg to 40 ng for m2,2G. Samples were analysed in duplicate and the mean reported. Calibration curves were run at the start of each batch and then after approximately every 30 samples. The procedure described above applies to results shown in and .
LC-MS/MS analysis – panel of RNA modifications
The ribonucleosides were purified with HyperSep Hypercarb SPE Spin Tips (Thermo Fisher Scientific) prior to LC-MS/MS analysis. Samples were analysed using an LTQ-Orbitrap XL mass spectrometer (Thermo Fisher Scientific, San Jose, CA, USA) coupled to an EASY-nLC 1000 (Thermo Fisher Scientific (Proxeon), Odense, Denmark). Ribonucleosides were loaded directly onto the analytical column and were separated by reversed-phase chromatography using a 50 cm homemade column with an inner diameter of 75 μm, packed with 4 μm Hydro-RP 80 Å (Phenomenex cat #04A-4375), as previously described [Citation79]. Chromatographic gradients started at 95% buffer A and 5% buffer B with a flow rate of 300 nl/min for 5 minutes and gradually increased to 20% buffer B and 80% buffer A in 40 min. After each analysis, the column was washed for 10 min with 20% buffer A and 80% buffer B. Buffer A: 20 mM Ammonium Acetate pH 4.5. Buffer B: 95%ACN/5% 20 mM Ammonium Acetate pH 4.5. The mass spectrometer was operated in positive ionization mode with nanospray voltage set at 2 kV and source temperature at 200°C. Full MS scans were set at 1 microscans with a resolution of 60,000 and a mass range of m/z 100–700 in the Orbitrap mass analyser. Fragment ion spectra were produced via collision-induced dissociation (CID) at normalized collision energy of 35% and they were acquired in the ion trap mass analyser. Isolation window was set to 2.0 m/z and activation time of 10 ms. All data was acquired with Xcalibur software v2.1. Serial dilutions were prepared using commercial pure ribonucleosides (1–2000 pgl, Carbosynth, Toronto Research Chemicals) in order to establish the linear range of quantification and the limit of detection of each compound. A mix of commercial ribonucleosides was injected before and after each batch of samples to assess instrument stability and to be used as external standard to calibrate the retention time of each ribonucleoside. Acquired data were analysed with the Skyline-daily software (v20.1.1.83) and extracted precursor areas of the ribonucleosides were used for quantification. From the mix of commercial ribonucleosides used, m3C and m5C were excluded from the downstream analyses due to their strong overlap in retention time and fragmentation patterns. The procedure above applies to results shown in Figure S3.
Activation of SH-SY5Y cells via KCl treatment
Cells were plated on sterilized coverslips in 24-well plates for imaging at a density of 3 × 10⁵ cells, or in 6-well plates for RT-qPCR. Cells were activated at 60% confluence by adding 50 mM KCl to the medium. After 30 seconds, the medium was replaced with fresh medium. Cells were harvested and fixed at 0, 1, 3 and 6-hours post-activation. SH-SY5Y cell activation was validated using RT-qPCR, which confirmed the upregulation in the expression of immediate-early genes (Hoffman et al. 1993; Okuno 2011; Minatohara et al. 2015).
Heat stress exposure of SH-SY5Y cells
SH-SY5Y cells were plated on sterilized coverslips in 24-well plates for imaging at a density of 3 × 10⁵ cells. Once they reached 60% confluence, the cells were exposed to 42°C for 20 minutes, which is considered a mild heat stress [Citation80]. Cells were harvested and fixed at 0, 2, 6 and 24-hours post-heat exposure, and subsequently used for immunofluorescence assays.
Small and long RNA-seq library preparation and sequencing from mouse brains
Total RNA was extracted from TRMT1L KO and wild-type brain samples using TriZol. Both wild-type of TRMT1L KO brain mice were prepared for TruSeq Total RNA Illumina sequencing, in biological triplicates, for both the small (<200 nt) and large RNA fractions (>200 nt). Briefly, first-strand cDNA was synthesized using SuperScript II Reverse Transcriptase. RNA template was then removed, and second cDNA strand was synthesized using Second Strand Marketing MasterMix from the Illumina kit, cDNA was washed using AMPPure-Xp beads, and 3ʹends were adenylated with A-Tailing Mix from the Illumina kit. Adapters containing Illumina barcodes for multiplexing were ligated to the end of the double stranded cDNA, and cDNA was washed and purified using AMPPure beads. DNA fragments containing adaptors on both sides were amplified using 15 cycles of PCR. Size and purity of the sample was analysed on the Agilent 2100 Bioanalyzer, Sequencing was performed using the Illumina HiSeq 2500 platform with 125bp paired-end sequencing in the case o long RNA-seq datasets (>200 nt), and with 100 bp single-end reads in the case of small RNA-seq datasets (<200 nt).
Bioinformatic analysis of small RNAseq libraries
Small RNA-seq reads were processed with a mapping pipeline adapted from a previous tRNA mapping pipeline [Citation81], with minor changes. The adapted version of the pipeline is publicly available in GitHub (https://github.com/novoalab/tRNAmap_Hoffmann_adapted). Briefly, reads were trimmed with bbduk (from bbmap 36.14) keeping reads with length 15–100 nt. Trimmed reads were then mapped with Segemehl 0.2.0–418 [Citation82] to a modified mm10 genome complemented with tRNA genes and pseudogenes masked, and pre-tRNA genes appended as additional chromosomes. Segemehl options of this first mapping were: accuracy = 80, differences = 3. Reads mapping exclusively to the pre-tRNA reference (not mapping to other genomic sites) were kept for mapping to unique sequences of mature tRNAs (downloaded from gtRNAdb http://gtrnadb.ucsc.edu/genomes/eukaryota/Mmusc 10/ on October 2019). This second mapping was performed with Segemehl with accuracy = 85 and differences = 3. Multimapping reads were kept only if they were showing the same mismatch profile with the different mapping loci (‘phased’ multimapping handling), as done in the original tRNA mapping pipeline [Citation81]. In addition to tRNA mapping, we also analysed the mismatch signatures of other ncRNAs. For the ncRNA analysis, the trimmed reads were mapped with Segemehl 0.2.0–418 to a custom reference of selected types of ncRNAs (miRNA, scaRNA, snoRNA and snRNA) downloaded from BioMart (GRCm38.p6) with default options, accuracy = 95 and differences = 0.
Bioinformatic analysis of long RNAseq libraries
125 bp paired-end long RNASeq reads were processed with Cutadapt v.1.9.1 [Citation83] with (adapter sequence: AGATCGGAAGAG, with -m 1 option to exclude empty reads). Reads were aligned with STAR [Citation84] version 2.7.0 f with default parameters to mouse genome (GRCm38) with vM21 gencode annotation. Long RNAseq reads were also mapped to mouse canonical rRNA sequences using Bowtie2 (local mode, default settings, -N 1).
Detection of m2,2G modifications using mismatch signatures
Modified positions were identified for both small and long RNA mapped reads through the generation of mpileup files using the Samtools mpileup function [Citation85]. Mpileup files were further processed with an in-house script (https://github.com/novoalab/mpileup2stats), which generates frequency tables of mismatches, insertions, deletions and RT-drop offs using mpileup files as input. Only positions with a minimum coverage of 10reads/base were considered for downstream analysis. m2,2G candidate sites were identified as those with a mismatch frequency difference (WT-KO) greater than 25%.
Bioinformatic analysis of TRMT1 and TRMT1L sequences
Protein fasta sequences from TRMT1 and TRMT1L proteins were obtained from the Uniprot [Citation86] database (https://www.uniprot.org). Mitochondrial targeting peptides were predicted using MitoProt II [Citation87] version 1.101 (http://ihg.gsf.de/ihg/mitoprot.html). Predictions of Zinc finger annotations were extracted from the PFAM [Citation88] database (http://pfam.xfam.org/). Nuclear localization signals (NLS) were predicted using the SeqNLS [Citation89] software (http://mleg.cse.sc.edu/seqNLS/). SeqNLS predicted TRMT1L to have a strong NLS signal (NLS_score ≥ 0.9) and TRMT1 to have weak NLS signal (0.5 < NLS_score < 0.85).
Phylogenetic tree building and homology searches
Complete annotated and curated reference proteomes were downloaded from UniProt (www.uniprot.org/). Selecting only one strain per species, we obtained a final dataset of 1,597 complete proteomes, which included 119 Archaea, 1143 Bacteria, and 335 Eukarya. To identify all candidate m2,2G methyltransferase enzymes, as well as closely related homolog domains, the hidden Markov Model (HMM) profile corresponding to m2,2G methyltransferase catalytic domain (PF02005.15, TRM) was retrieved from the PFAM [Citation88] database (https://pfam.xfam.org/). The TRM HMM profile was then used to query all Uniprot proteomes using the hmmsearch function from HMMER [Citation90] software v.3.2.1 (http://hmmer.org/). Proteins above the default threshold were kept as candidate TRM proteins, and were aligned to the HMM profile using the hmmalign function in HMMER. This multiple sequence alignment was used as input to construct a maximum likelihood phylogenetic tree using PhyML [Citation91].
Ethics statement
Ethical approval for the patient-derived samples from TRMT1 mutant was waived by the Ethics Committee of the University of Social Welfare and Rehabilitation Sciences, Tehran, Iran (IR.USWR.REC.1395.356). Written informed consent form was obtained from legally authorized representatives (the living parents of patients) before the study.
Data and Code availability
Small RNA-seq and long RNA-seq data from TRMT1L knockout and WT brain mouse samples have been deposited in Gene Expression Omnibus (GEO), under the accession codes GSE152429 (small RNA-seq) and GSE156858 (long RNA-seq). RNAseq data from patient-derived LCLs containing heterozygous and homozygous 2bp deletions in TRMT1 gene have been deposited in GEO under the accession code GSE163829 (long RNA-seq). The pipeline used to map the reads to tRNA sequences has been made publicly available in GitHub (https://github.com/novoalab/tRNAmap_Hoffmann_adapted). The code used to analyze the mismatch frequencies has been made publicly available in GitHub (https://github.com/novoalab/mpileup2stats).
Author contributions
NJ performed the majority of wet lab experiments described in this work, including immunofluorescence, neuronal activation, RNA fractionation and preparation of samples for Mass Spectrometry and their corresponding data analysis. SC prepared TRMT1L knockout and wildtype samples for Mass Spectrometry in the Orbitrap, performed the transient transfections with TRMT1/TRMT1L-FLAG plasmids and the co-immunofluorescence experiments. SC and EMN performed bioinformatics analysis of the next-generation sequencing RNAseq libraries. GV and JT contributed with the setup of the gel fractionation experiments and Mass Spectrometry sample preparation. HL and GL helped with the initial stages of bioinformatic data analysis. RP performed the Mass Spectrometry sample processing on the Quantum Access. DK prepared the next-generation sequencing libraries. GRF performed the subcellular fractionation and Western Blots in SH-SY5Y cells. FV bred the mice from TRMT1L knockout and control groups, and collected brain tissues that were used for RNAseq and LC-MS/MS analysis. NC, SSA, HN and LRP cultured patient-derived TRMT1 wild-type and mutant lymphoblastoid cell lines and extracted total RNA for Mass Spectrometry and RNA-seq analyses. NS, JSM and EMN conceived the project. JSM and EMN supervised the project, with the contribution of DC. NJ, SC and EMN built the figures. NJ, SC, JSM and EMN wrote the paper, with the contribution from all authors.
Supplemental Material
Download PDF (1.2 MB)Acknowledgments
We thank all the members from the Mattick and Novoa labs for their valuable insights and discussion. NJ was supported by a UNSW International PhD fellowship. SC is supported by a fellowship from ”la Caixa’’ Foundation (LCF/BQ/DI19/11730036). This work was supported by NHMRC funds (Project Grant APP1070631 to JSM), funds from the Australian Research Council (DP180103571 to EMN) and funds from the Garvan Young Investigator Award (to NS). This work was partly supported by the Spanish Ministry of Economy, Industry and Competitiveness (MEIC) (PGC2018-098152-A-100 to EMN). Mass spectrometric results were obtained at the Bioanalytical Mass Spectrometry Facility within the Mark Wainwright Analytical Centre of the University of New South Wales, using infrastructure provided by NSW Government co-investment in the National Collaborative Research Infrastructure Scheme (NCRIS) subsidized access to this facility is gratefully acknowledged. The mass spectrometric analyses shown in Figure S3 were performed in the CRG/UPF Proteomics Unit which is part of the of Proteored, PRB3 and is supported by grant PT17/0019, of the PE I+D+i 2013-2016, funded by ISCIII and ERDF. We thank the Biomolecular Screening & Protein Technologies unit at CRG for producing the plasmids containing FLAG-tagged TRMT1 and TRMT1L constructs that were used for transfection. This work is in memoriam of Nicky Jonkhout, first author of this work, our colleague and friend. Nicky went on sick leave in June 2019. While he kept struggling back and forth, he persevered until the very end in his intention to return to research and pursue his PhD, with a love for science we could have never had imagined. We would like to thank and remember Nicky for all his passion, effort and the superb skill that he put into this work. Unfortunately he did not live to see this work in its finished form, but his legacy and findings will remain, which we hope will open new avenues in the fields of neurobiology and epitranscriptomics. We will greatly miss him.
Disclosure statement
No potential conflict of interest was reported by the authors.
Supplementary material
Supplemental data for this article can be accessed here.
References
- Day JJ, Childs D, Guzman-Karlsson MC, et al. DNA methylation regulates associative reward learning. Nat Neurosci. 2013;16:1445–1452.
- Nainar S, Marshall PR, Tyler CR, et al. Evolving insights into RNA modifications and their functional diversity in the brain. Nat Neurosci. 2016;19(10):1292–1298.
- Mattick JS, Amaral PP, Dinger ME, et al. RNA regulation of epigenetic processes. BioEssays. 2009;31(1):51–59.
- Li S, Mason CE. The pivotal regulatory landscape of RNA modifications. Annu. Rev. Genomics Hum. Genet. 2014;15(1):127–150.
- Roundtree IA, Evans ME, Pan T, et al. Dynamic RNA modifications in gene expression regulation. Cell. 2017;169(7):1187–1200.
- Hussain S, Bashir ZI. The epitranscriptome in modulating spatiotemporal RNA translation in neuronal post-synaptic function. Front Cell Neurosci. 2015;9:420.
- Widagdo J, Zhao Q-Y, Kempen M-J, et al. Experience-Dependent Accumulation of N 6 -Methyladenosine in the prefrontal cortex is associated with memory processes in mice. J. Neurosci. 2016;36(25):6771–6777.
- Engel M, Eggert C, Kaplick PM, et al. The Role of m6A/m-RNA methylation in stress response regulation. Neuron. 2018;99(2):389–403.e9.
- Weng Y-L, Wang X, An R, et al. Epitranscriptomic m6A regulation of axon regeneration in the adult mammalian nervous system. Neuron. 2018;97:313–325.e6.
- Jonkhout N, Tran J, Smith MA, et al. The RNA modification landscape in human disease. RNA. 2017;23(12):1754–1769.
- Klungland A, Dahl JA. Dynamic RNA modifications in disease. Curr Opin Genet Dev. 2014;26:47–52.
- Sarin LP, Leidel SA. Modify or die?–RNA modification defects in metazoans. RNA Biol. 2014;11:1555–1567.
- Torres AG, Batlle E, Ribas de Pouplana L. Role of tRNA modifications in human diseases. Trends Mol Med. 2014;20(6):306–314.
- Hideyama T, Yamashita T, Aizawa H, et al. Profound downregulation of the RNA editing enzyme ADAR2 in ALS spinal motor neurons. Neurobiol Dis. 2012;45:1121–1128.
- Simpson CL, Lemmens R, Miskiewicz K, et al. Variants of the elongator protein 3 (ELP3) gene are associated with motor neuron degeneration. Hum Mol Genet. 2009;18(3):472–481.
- Anderson SL, Coli R, Daly IW, et al. Familial dysautonomia is caused by mutations of the IKAP gene. Am J Hum Genet. 2001;68(3):753–758.
- Alazami AM, Hijazi H, Al-Dosari MS, et al. Mutation in ADAT3, encoding adenosine deaminase acting on transfer RNA, causes intellectual disability and strabismus. J Med Genet. 2013;50(7):425–430.
- Dai L, Xing L, Gong P, et al. Positive association of the FTSJ1 gene polymorphisms with nonsyndromic X-linked mental retardation in young Chinese male subjects. J. Hum. Genet. 2008;53(7):592–597.
- Zung A, Kori M, Burundukov E, et al. Homozygous deletion of TRMT10A as part of a contiguous gene deletion in a syndrome of failure to thrive, delayed puberty, intellectual disability and diabetes mellitus. Am J Med Genet A. 2015;167(12):3167–3173.
- Falk MJ, Gai X, Shigematsu M, et al. A novel HSD17B10 mutation impairing the activities of the mitochondrial RNase P complex causes X-linked intractable epilepsy and neurodevelopmental regression. RNA Biol. 2016;13(5):477–485.
- Livneh I, Moshitch-Moshkovitz S, Amariglio N, et al. The m6A epitranscriptome: transcriptome plasticity in brain development and function. Nat Rev Neurosci. 2020;21(1):36–51.
- Flamand MN, Meyer KD. The epitranscriptome and synaptic plasticity. Curr. Opin. Neurobiol. 2019;59:41–48.
- Leighton LJ, Ke K, Zajaczkowski EL, et al. Experience-dependent neural plasticity, learning, and memory in the era of epitranscriptomics. Genes Brain Behav. 2018;17(3):e12426.
- Daily DK, Ardinger HH, Holmes GE. Identification and evaluation of mental retardation. Am. Fam physician 2000;26:1059–67, 1070.
- Freude K, Hoffmann K, Jensen L-R, et al. Mutations in the FTSJ1 gene coding for a novel S-adenosylmethionine-binding protein cause nonsyndromic X-linked mental retardation. Am J Hum Genet 2004;75:305–309.
- Li J, Wang Y-N, Xu B-S, et al. Intellectual disability-associated gene ftsj1 is responsible for 2′-O-methylation of specific tRNAs. EMBO Rep. 2020;21(8). DOI:10.15252/embr.202050095.
- Davarniya B, Hu H, Kahrizi K, et al. The role of a novel trmt1 gene mutation and rare grm1 gene defect in intellectual disability in two azeri families. PLoS One. 2015;10(8):e0129631.
- Najmabadi H, Hu H, Garshasbi M, et al. Deep sequencing reveals 50 novel genes for recessive cognitive disorders. Nature. 2011;478(7367):57–63.
- Zhang K, Lentini JM, Prevost CT, et al. An intellectual disability‐associated missense variant in TRMT1 impairs tRNA modification and reconstitution of enzymatic activity. Hum Mutat. 2020;41(3):600–607.
- Khan MA, Rafiq MA, Noor A, et al. Mutation in NSUN2, which encodes an RNA methyltransferase, causes autosomal-recessive intellectual disability. Am J Hum Genet. 2012;90(5):856–863.
- Dewe JM, Fuller BL, Lentini JM, et al. TRMT1-catalyzed trna modifications are required for redox homeostasis to ensure proper cellular proliferation and oxidative stress survival. Mol. Cell. Biol. 2017;37(21). DOI:10.1128/MCB.00214-17
- Liu J, Strâby KB. The human tRNA(m(2)(2)G(26))dimethyltransferase: functional expression and characterization of a cloned hTRM1 gene. Nucleic Acids Res. 2000;28(18):3445–3451.
- Vauti F, Goller T, Beine R, et al. The mouse Trm1-like gene is expressed in neural tissues and plays a role in motor coordination and exploratory behaviour. Gene. 2007;389(2):174–185.
- Zhang J, Sutachan -J-J, Montoya-Gacharna J, et al. Isoflurane inhibits cyclic adenosine monophosphate response element-binding protein phosphorylation and calmodulin translocation to the nucleus of SH-SY5Y cells. Anesth. Analg. 2009;109(4):1127–1134.
- Sprinzl M. Compilation of tRNA sequences and sequences of tRNA genes. Nucleic Acids Res. 1998;26(1):148–153.
- Hauenschild R, Tserovski L, Schmid K, et al. The reverse transcription signature of N-1-methyladenosine in RNA-Seq is sequence dependent. Nucleic Acids Res. 2015;43(20):9950–9964.
- Novoa EM, Beaudoin JD, Giraldez AJ, et al. Best practices for genome-wide RNA structure analysis: combination of mutational profiles and drop-off information. bioRxiv 176883; doi: 10.1101/176883
- Vandivier LE, Anderson ZD, Gregory BD. HAMR: high-throughput annotation of modified ribonucleotides. Methods Mol Biol. 2019;1870:51–67.
- Kietrys AM, Velema WA, Kool ET. Fingerprints of modified RNA bases from deep sequencing profiles. J. Am. Chem. Soc. 2017;139(47):17074–17081.
- Werner S, Schmidt L, Marchand V, et al. Machine learning of reverse transcription signatures of variegated polymerases allows mapping and discrimination of methylated purines in limited transcriptomes. Nucleic Acids Res. 2020;48(7):3734–3746.
- Ryvkin P, Leung YY, Silverman IM, et al. HAMR: high-throughput annotation of modified ribonucleotides. RNA. 2013;19(12):1684–1692.
- Youvan DC, Hearst JE. Reverse transcriptase pauses at N2-methylguanine during in vitro transcription of Escherichia coli 16S ribosomal RNA. Proc. Natl. Acad. Sci. U. S. 1979;76(8):3751–3754.
- Findeiß S, Langenberger D, Stadler PF, et al. Traces of post-transcriptional RNA modifications in deep sequencing data. Biol. Chem. 2011;392(4):305–313.
- Ishimura R, Nagy G, Dotu I, et al. RNA function. Ribosome stalling induced by mutation of a CNS-specific tRNA causes neurodegeneration. Science. 2014;345(6195):455–459.
- Schmitt BM, Rudolph KLM, Karagianni P, et al. High-resolution mapping of transcriptional dynamics across tissue development reveals a stable mRNA–tRNA interface. Genome Res. 2014;24(11):1797–1807.
- Adler EM, Fink JS. Calcium regulation of vasoactive intestinal polypeptide mRNA abundance in SH-SY5Y human neuroblastoma cells. J. Neurochem. 2006;61(2):727–737.
- Okuno H. Regulation and function of immediate-early genes in the brain: beyond neuronal activity markers. Neurosci. Res. 2011;53(3):175–186.
- Zhou J, Wan J, Gao X, et al. Dynamic m(6)A mRNA methylation directs translational control of heat shock response. Nature. 2015;526:591–594.
- Chan CTY, Dyavaiah M, DeMott MS, et al. A quantitative systems approach reveals dynamic control of tRNA modifications during cellular stress. PLoS Genet. 2010;6(12):e1001247.
- Yu J, Li Y, Wang T, et al. Modification of N6-methyladenosine RNA methylation on heat shock protein expression. PLoS One. 2018;13(6):e0198604.
- Batista PJ, Molinie B, Wang J, et al. m6A RNA modification controls cell fate transition in mammalian embryonic stem cells. Cell Stem Cell. 2014;15(6):707–719.
- Haussmann IU, Bodi Z, Sanchez-Moran E, et al. m6A potentiates Sxl alternative pre-mRNA splicing for robust drosophila sex determination. Nature. 2016;540(7632):301–304.
- Lence T, Akhtar J, Bayer M, et al. m6A modulates neuronal functions and sex determination in drosophila. Nature. 2016;540(7632):242–247.
- Zhao BS, Wang X, Beadell AV, et al. m6A-dependent maternal mRNA clearance facilitates zebrafish maternal-to-zygotic transition. Nature. 2017;542(7642):475–478.
- Meyer KD, Patil DP, Zhou J, et al. 5′ UTR m6A promotes cap-independent translation. Cell. 2015;163(4):999–1010.
- Heck AM, Russo J, Wilusz J, et al. YTHDF2 destabilizes m 6 A-modified neural-specific RNAs to restrain differentiation in induced pluripotent stem cells. RNA. 2020;26(6):739–755.
- Edens BM, Vissers C, Su J, et al. FMRP modulates neural differentiation through m6A-dependent mrna nuclear export. Cell Rep. 2019;28(4):845–854.e5.
- Ma C, Chang M, Lv H, et al. RNA m6A methylation participates in regulation of postnatal development of the mouse cerebellum. Genome Biol. 2018;19(1). DOI:10.1186/s13059-018-1435-z.
- Liu H, Begik O, Lucas MC, et al. Accurate detection of m6A RNA modifications in native RNA sequences. Nat. Commun. 2019;10(1):4079.
- Garalde DR, Snell EA, Jachimowicz D, et al. Highly parallel direct RNA sequencing on an array of nanopores. 10.1101/068809.
- Novoa EM, Mason CE, Mattick JS. Charting the unknown epitranscriptome. Nat Rev Mol Cell Biol. 2017;18(6):339–340.
- Parker MT, Knop K, Sherwood AV, et al. 2020. Nanopore direct RNA sequencing maps the complexity of Arabidopsis mRNA processing and m6A modification. Elife. 9. DOI: 10.7554/eLife.49658.
- Schaffer AE, Pinkard O, Coller JM. tRNA metabolism and neurodevelopmental disorders. Annu Rev Genomics Hum Genet. 2019;20(1):359–387.
- Simons C, Griffin LB, Helman G, et al. Loss-of-function alanyl-tRNA synthetase mutations cause an autosomal-recessive early-onset epileptic encephalopathy with persistent myelination defect. Am J Hum Genet. 2015;96(4):675–681.
- Torres AG, Reina O, Stephan-Otto Attolini C, et al. Differential expression of human tRNA genes drives the abundance of tRNA-derived fragments. Proc. Natl. Acad. Sci. U. S. A. 2019;116(17):8451–8456.
- Mao YS, Zhang B, Spector DL. Biogenesis and function of nuclear bodies. Trends Genet. 2011;27(8):295–306.
- Polymenidou M. The RNA face of phase separation. Science. 2018;360(6391):859–860.
- Ries RJ, Zaccara S, Klein P, et al. m6A enhances the phase separation potential of mRNA. Nature. 2019;571(7765):424–428.
- Zhao BS, Roundtree IA, He C. Post-transcriptional gene regulation by mRNA modifications. Nat. Rev. Mol. Cell Biol. 2017;18(1):31–42.
- Zhou KI, Shi H, Lyu R, et al. Regulation of Co-transcriptional pre-mRNA splicing by m6A through the low-complexity protein hnRNPG. Mol. Cell. 2019;76(1):70–81.e9.
- Mao Y, Dong L, Liu X-M, et al. m6A in mRNA coding regions promotes translation via the RNA helicase-containing YTHDC2. Nat. Commun. 2019;10(1):5332.
- Shi H, Wang X, Lu Z, et al. YTHDF3 facilitates translation and decay of N6-methyladenosine-modified RNA. Cell Res. 2017;27(3):315–328.
- Liu S-Y, Feng Y, Wu -J-J, et al. m6 A facilitates YTHDF-independent phase separation. J. Cell. Mol. 2020;24(2):2070–2072.
- Madugalle SU, Meyer K, Wang DO, et al. RNA N6-Methyladenosine and the regulation of rna localization and function in the brain. Trends Neurosci. 2020;21(12):1011–1023.
- Neitzel H. A routine method for the establishment of permanent growing lymphoblastoid cell lines. Hum. Genet. 1986;73(4):320–326.
- Hu H, Kahrizi K, Musante L, et al. Genetics of intellectual disability in consanguineous families. Mol. Psychiatry. 2019;24(7):1027–1039.
- Suzuki K, Bose P, Leong-Quong RY, et al. REAP: a two minute cell fractionation method. BMC Res. Notes. 2010;3(1):294.
- Morlan JD, Qu K, Sinicropi DV. Selective depletion of rRNA enables whole transcriptome profiling of archival fixed tissue. PLoS One. 2012;7(8):e42882.
- Sarin LP, Kienast SD, Leufken J, et al. Nano LC-MS using capillary columns enables accurate quantification of modified ribonucleosides at low femtomol levels. RNA. 2018;24(10):1403–1417.
- Park HG, Han SI, Oh SY, et al. Cellular responses to mild heat stress. Cell. Mol. Life Sci. 2005;62(1):10–23.
- Hoffmann A, Fallmann J, Vilardo E, et al. Accurate mapping of tRNA reads. Bioinformatics. 2018;34(13):2339.
- Hoffmann S, Otto C, Kurtz S, et al. Fast mapping of short sequences with mismatches, insertions and deletions using index structures. PLoS Comput. Biol. 2009;5(9):e1000502.
- Martin M. Cutadapt removes adapter sequences from high-throughput sequencing reads. EMBnet.journal. 2011;17(1):10–12.
- Dobin A, Davis CA, Schlesinger F, et al. STAR: ultrafast universal RNA-seq aligner. Bioinformatics. 2013;29(1):15–21.
- Li H. A statistical framework for SNP calling, mutation discovery, association mapping and population genetical parameter estimation from sequencing data. Bioinformatics. 2011;27(21):2987–2993.
- The Uni Prot Consortium. UniProt: a worldwide hub of protein knowledge. Nucleic Acids Res. 2019;47(D1):D506–D515. doi:10.1093/nar/gky1049.
- Claros MG, Vincens P. Computational method to predict mitochondrially imported proteins and their targeting sequences. Eur. J. Biochem. 1996;241(3):779–786.
- El-Gebali S, Mistry J, Bateman A, et al. Deep sequencing reveals 50 novel genes for recessive cognitive disorders. Nucleic Acids Res. 2011;478(D1):D427–D432.
- Lin J-R, Hu J, Dalby AR. SeqNLS: nuclear localization signal prediction based on frequent pattern mining and linear motif scoring. PLoS One. 2013;8(10):e76864.
- Eddy SR. Accelerated profile HMM Searches. PLoS Comput. Biol. 2011;90(10):e1002195.
- Guindon S, Dufayard J-F, Lefort V, et al. New algorithms and methods to estimate maximum-likelihood phylogenies: assessing the performance of PhyML 3.0. Syst. Biol. 2010;19(3):307–321.