
ABSTRACT
Early detection of the severe acute respiratory syndrome coronavirus 2 (SARS-CoV-2) has been proven crucial during the efforts to mitigate the effects of the COVID-19 pandemic. Several diagnostic methods have emerged in the past few months, each with different shortcomings and limitations. The current gold standard, RT-qPCR using fluorescent probes, relies on demanding equipment requirements plus the high costs of the probes and specific reaction mixes. To broaden the possibilities of reagents and thermocyclers that could be allocated towards this task, we have optimized an alternative strategy for RT-qPCR diagnosis. This is based on a widely used DNA-intercalating dye and can be implemented with several different qPCR reagents and instruments. Remarkably, the proposed qPCR method performs similarly to the broadly used TaqMan-based detection, in terms of specificity and sensitivity, thus representing a reliable tool. We think that, through enabling the use of vast range of thermocycler models and laboratory facilities for SARS-CoV-2 diagnosis, the alternative proposed here can increase dramatically the testing capability, especially in countries with limited access to costly technology and reagents.
Introduction
Since its emergence in Wuhan during December 2019, the severe acute respiratory syndrome coronavirus 2 (SARS-CoV-2) has spread worldwide, affecting health, jobs, education and social interactions of millions as well as countries’ economies [Citation1]. Government authorities across the world have chosen different approaches to deal with this situation, often based on social distancing and early detection followed by contact tracing. For the latter, and considering the World Health Organization’s recommendations [Citation1,Citation2], the testing capacity has turned out to be a limiting factor in numerous countries.
Given the prevalence of transmission by individuals which are asymptomatic, pre-symptomatic or suffering from mild symptoms [Citation3–6], expanding the testing capacity becomes critical in order to rapidly detect and contain outbreaks. Initially, a testing strategy was adopted worldwide, which combined column-based RNA extraction from naso-pharyngeal swabs with retro-transcription followed by quantitative PCR (RT-qPCR) using TaqMan fluorescent probes [Citation7]. However, the whole pipeline is expensive, labour-intensive and requires specific qPCR equipment in terms of laboratory facilities. These issues, combined with the dramatically increased demand in the early days of the pandemic, resulted in testing bottlenecks that substantially delayed the tracking and isolation of infected individuals. In peripheral countries, these shortcomings tend to be amplified by economic struggling, shortage of key reagents in the international market and limited laboratory and equipment capacities. With that in sight, diagnosis alternatives have started to emerge, such as loop-mediated isothermal amplification (LAMP)-based assays, which offers a rapid diagnosis when compared to TaqMan-based RT-qPCR and does not require specialized detection equipment [Citation8,Citation9]. Each alternative has different advantages and limitations, such as laboratory infrastructure requirements for receiving and fractioning viral-containing swabs, analytical sensitivity and convenience or necessity for multiplex-capable thermocyclers.
In this study, we describe the optimization of a series of custom and commercial DNA-intercalating dye alternatives based on a previously described amplicon [Citation10], including specific reaction conditions for SARS-CoV-2 detection by RT-qPCR. Furthermore, we show here that this methodology is as sensitive and reliable for diagnosis as TaqMan-based RT-qPCR standards and can be used in any qPCR thermal cycler.
Materials and methods
Sample collection and fractionating
Swab samples were received by the Instituto de Investigaciones Biomédicas en Retrovirus y SIDA (INBIRS, CABA, Argentina) and fractionated in a Level II Biosafety Laboratory. Anonymized and randomized samples were either inactivated and transported to be extracted at Instituto de Fisiología, Biología Molecular y Neurociencias (IFIBYNE, CABA, Argentina) or directly extracted on site (as described).
Total RNA extraction
RNA was extracted out of 300 µl of swab samples using a Chemagic 360-D automated extraction equipment (Perkin-Elmer) according to the manufacturer’s instructions.
Retro-transcription from total RNA
Unless specified otherwise, retro-transcription reactions were done using MMLV-RT following manufacturer instructions (Invitrogen). A time-saving protocol was developed (thoroughly described in Supplementary Table 1). Program: 37°C-20'; 70°C-15', ran in a BioRad T100 thermal cycler. For the qPCR, obtained cDNAs were diluted 1:10.
To ensure that reverse transcriptases (RT) from other providers (MMLV-RT and GoScript, Promega) could be alternatively used, we tested them in parallel using the same retro-transcription conditions described above. In addition to these internationally available alternatives, we also evaluated a locally produced commercial RT, FLYE-Ultra Highway (INBIO Highway, Cat. N° K1610). It is important to note that the program’s temperatures had to be adapted for this last alternative: 60°C-20'; 95°C-15'.
Primer design and recollection
Since unspecific priming and/or primer dimer formation are the biggest challenges to overcome when switching from TaqMan to unspecific DNA dye as the method of detection in qPCR, we screened a vast set of custom designed and published primers [Citation10]. Custom designed oligos were obtained using Beacon Designer Software (Premier Biosoft International, Palo Alto, CA, USA) or Primer3Plus [Citation11]. All candidate pairs were checked for dimer formation in both Thermo Fisher Primer Analyser and Beacon Designer. Off-targets were analysed using Primer Blast [Citation12]. Finally, the presence of commonly described mutations on the target sequence and cross-priming with other coronaviruses was assessed with custom R scripts. We selected 10 candidates, depicted in Supplementary Table 2, for further screening.
On the other hand, we selected two pair of primers targeting housekeeping human genes (POLR2A and U1) commonly employed in our laboratory to be used as internal controls. Their primer sequences can also be found in Supplementary Table 2.
Primer screening
We screened the different primer pairs using a custom formulation for the PCR mix, containing SYBR® Green (Invitrogen™ SYBR™ Green I Nucleic Acid Gel Stain, 10,000X concentrate in DMSO, S7563 or SYBR Green I nucleic acid gel stain 10.000X, S9430, Sigma) as the intercalating dye. Given that we expected these initial conditions to be a priori sub-optimal in terms of specificity and efficiency, several minor adjustments were made (program settings, Magnesium/DMSO concentration, among others) to obtain final working conditions (Supplementary Table 1). For the screening, we used every primer pair and performed standard curves with serial dilutions (1:4) from pooled positive samples (previously diagnosed using a commercial RT-qPCR TaqMan Kit) and evaluated absolute cycle threshold (Ct) values, reaction efficiency, correlation between expected and observed Cts, the number and position of peaks in the melting curves and potential maximum threshold for detection due to unspecific amplification.
For the internal positive control of human RNA detection, serial standard curves were performed (5 points, 1:2 from a pool of samples) to corroborate the selected housekeeping genes worked efficiently and free of non-template amplification. The custom-made mix and the INBIO Highway master mix were used for this purpose (see belowfor further details on those mixes).
TaqMan onestep RT-qPCR
Following RNA extraction, detection of SARS-CoV-2 genetic material was performed using a commercial TaqMan RT-qPCR Kit (DisCoVery Kit by AP Biotech, Ref: APB-COV19R2ROX). The procedure was done following the manufacturer’s indications (https://apbiotech.com.ar/pub/media/Content/Datasheet/APB-COV19R2ROX.pdf). Alternatively, the GeneFinder RT-qPCR Kit was used for some experiments (REF: IFMR-45, https://www.fda.gov/media/137116/download). All reactions were run in a BioRad CFX-96 thermocycler.
For the comparison between the published Charité protocol [Citation7] and our modified method with SYBR Green, we prepared a mix (Supplementary Table 1) based on Thermo Fisher/Invitrogen SuperScript III OneStep RT-PCR System with Platinum® Taq DNA Polymerase. The qPCR was performed according to manufacturer’s instructions: 55°C-10'; 94°C-3'; (94°C-15'' & 58°C-30'') 45x. All reactions were run in either an ABI Quantstudio 3 or an ABI StepOnePlus.
SYBR green onestep RT-qPCR
The adapted Charité protocol for SYBR Green mix (Supplementary Table 1) was based on Thermo Fisher/Invitrogen SuperScript III OneStep RT-PCR System with Platinum® Taq DNA Polymerase. The qPCR cycling conditions used were: 60°C-10'; 95°C-3'; (95°C-15'' & 60°C-40'') 40x, melting curve. All reactions were run in either an ABI Quantstudio 3 or an ABI StepOnePlus.
SYBR Green qPCR
All SYBR Green-based mixes are thoroughly described in Supplementary Table 1. For every reaction the qPCR cycling was done with a 95°C-15'' denaturation step and 40 cycles of 60°C-40'' annealing/elongation, followed by a melting curve. The activation time was adapted to the one recommended by the manufacturers of each mix or Taq Polymerase (Supplementary Table 1). The master mixes tested were: INBIO Highway qPCR Mix (Ref M130, https://www.inbiohw.com.ar/es/productos/178591/pcr/Master-Mix-qPCR-con-SYBR.html), Solis Biodyne 5x HOT FIREPol EvaGreen® qPCR Mix Plus and Biodynamics Real Mix Ref B124-100. Two custom-made mixes were prepared using different Taq Polymerases (INBIO Highway T-FREE Taq REF E1202, https://www.inbiohw.com.ar/es/productos/168157/pcr/Kit-T-Free-ADN-polimerasa.html, and Qiagen Hot Start Taq REF 203203) with SYBR® Green I (Sigma-Aldrich S9430).
Determination of the limit of detection (LOD)
A SARS-CoV-2 RNA standard was kindly provided by INEI-ANLIS Dr. Carlos G. Malbrán (Buenos Aires, Argentina). This standard was quantified (4 × 10⁶ molecules per µL) using the SARS-like Wuhan, Iv-RNA E gene Standard; 1 × 10⁸ copies/µL provided by the Pan American Health Organization/World Health Organization. Serial dilutions (1:10) were done, starting from a quantity of 4 × 10⁵ molecules per µL and ending in 4 molecules per µL. Five µL of each dilution were used in each reaction (as described before).
Generation of a positive control for RT-qPCR
The positive control RNA was obtained by cloning a region of SARS-CoV-2 genome in the plasmid pBluescript under the control of a T7 RNA polymerase promoter. To this end, pBluescript KS+ plasmid was digested with BamHI and XhoI and gel-purified with an extraction kit. In turn, the insert was generated by RT-PCR using samples of positive patients as a source of SARS-CoV-2 genomic material. The primers (listed in Supplementary Table 2) included restriction enzyme adapters (BamHI and XhoI within the forward and reverse primers, respectively) to allow for cloning within the pre-digested pBluescript. Alternatively, the insert can be generated by gene synthesis or PCR amplification of overlapping primers. The amplified region included the target sequence of the primers listed as RdRP. The PCR product was subsequently digested with previously mentioned enzymes and ligated into the linearized vector with T4 DNA ligase. The cloned products were transformed into DH5α E. coli, followed by standard plasmid miniprep protocols. The plasmid constructs obtained were linearized with XhoI restriction enzyme and incubated with T7 RNA polymerase for in vitro transcription. Finally, DNA in the reaction was degraded by incubation with RNAse-free DNase I according to the manufacturer’s indications. Total RNA was purified with AGENCOURT® RNAClean® XP magnetic beads (Beckman Coulter) and quantified with a Nanodrop (Thermo Scientific) to be used as a positive control RNA standard sample in RT-qPCR reactions.
Results
Selection of a primer pair for SARS-CoV-2 detection
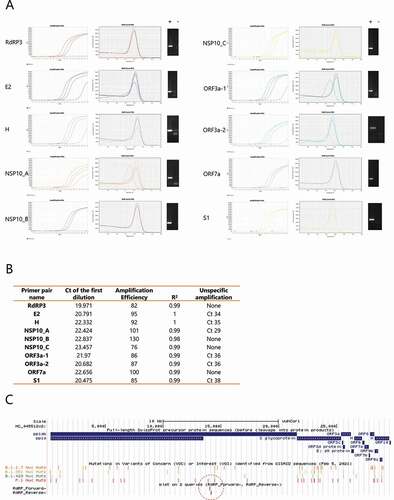
An initial screening was conducted with a set of candidate primer pairs (Supplementary Table 2). We tested the different primer pairs on serial dilutions of a pool of positive samples (already diagnosed using a commercially available TaqMan Kit) and no-template controls. We scored the Ct value for each of these reactions and assessed the different primers for: amplification efficiency, R2 for the linear regression of Ct vs. log(quantity), melting curves and the amplification cycle at which unspecific PCR products start to be detected in the no-template controls. shows the amplification and melting curves for each primer pair, and A summary of the data obtained. Based on this information, the RdRP primer pair was chosen for further studies. Furthermore, an in vitro transcribed RNA was generated and used as a positive control to monitor the quality of each RT-qPCR run. This is particularly relevant when using custom-made mixes that, according to the preparation, could yield variable outcomes. Given the continuous emergence of new variants, we checked whether our primer pair could be affected by known mutations, confirming that neither of the primer sequences corresponds to mutations on the main SARS-CoV-2 variants of concern ().
Figure 1. Selection of a primer pair for SARS-CoV-2 detection. (A) Serial dilutions of a pool of positive samples for each primer pair. Representative amplification (left panel) and melting curves (middle panel) are shown. Corresponding RT-qPCR products were solved by gel electrophoresis and representative images of positive samples (+) and negative controls (-) are shown (right panel). (B) Summary of the data generated for selection of a highly specific primer pair. Ct: cycle threshold. Amplification efficiency and R2 relates to the log-linear fit of the relation between Relative quantity vs. Ct for known serial dilutions of a positive control. An amplification efficiency of 100% represents a decrease of one Ct for a 1:2 dilution. Unspecific amplification: Ct of amplification curves observed in negative controls (without template), probably due to primer dimers. (C) UCSC Genome Browser image, depicting the position of the mutations within each SARS-CoV-2 variant of concern, and the position of the selected primer pair (RdRP) for the following experiments
SYBR green RT-qPCR as a suitable alternative to TaqMan RT-qPCR for SARS-CoV-2 detection
With the goal of providing experimental alternatives to the gold standard TaqMan RT-qPCR, several qPCR mix options were tested. These all relied on either SYBR Green or Eva Green as intercalating dye alternatives for the detection of the genetic material and ranged from one-step reaction mixes to two-step methods using a custom mix (see Materials and Methods). The main objective was to facilitate a range of customizable solutions for specific needs that might arise during the COVID-19 diagnosis pipeline. Additionally, we aimed at sorting them from the most time-saving to the least, irrespectively of their cost and/or availability in the local market. To cope with the main disadvantage of unspecific amplification observed when using intercalating dyes instead of labelled probes, we defined the critical amplification cycle at which unspecific PCR products were detected and set it as the cut-off cycle of our methods’ detection limit. While we are conscious that this strategy impairs the limit of detection (LOD) marginally, it seemed more reasonable to prioritize specificity in this context in order to diminish the occurrence of false positives.
Firstly, we adapted the Charité protocol published by the World Health Organization (WHO) to use SYBR Green instead of TaqMan probes [Citation7]. For this purpose, we evaluated the pair of RdRP primers selected from the screening, added the dye and adjusted the cycling conditions and mix composition (see Methods). Interestingly, there was a substantial increase in sensitivity when using the intercalating dye compared to the TaqMan probes N and ORF1ab (), with an average decrease in Cts of approximately 4 cycles, which allowed for every true positive sample to be detected as positive. When comparing the limit of detection (LOD) of a SARS-CoV-2 standard RNA (see Methods), we found higher sensitivity when using SYBR Green rather than a TaqMan-based approach with an amplicon in the same region of the viral RNA (using RdRP primers and probe P1 [Citation7]) (). We selected a Ct cut-off of 35, since it ensured full specificity ( and Supplementary Data 1). Consequently, the LOD for the SYBR Green-based RT-qPCR with the RdRP primer pair is approximately 20 copies of viral genome (). Since 5 µl of RNA are used per reaction, this means that the intercalating dye method could detect as low as 4 copies (c) of viral RNA per µl or 4000 c/ml.
Figure 2. Using an intercalating dye can yield similar sensitivity and specificity as TaqMan probes. (A) Paired boxplot of the Ct shift for the SYBR Green RT-qPCR (RdRP amplicon) versus two different TaqMan-based reactions (N and ORF1ab amplicons) using the Charité protocol. (B) RT-qPCR amplification curves for serial dilutions of a SARS-CoV-2 standard RNA, from 4 × 10⁵ copies per µL (c/µL) to 4 c/µL, using either the unmodified Charité protocol (TaqMan) or the one adapted for an intercalating dye (SYBR Green). (C) Summary of the performance obtained using the different commercial and customized RT-qPCR protocols evaluated. (D) Ct values for each sample tested with every RT-qPCR protocol developed and optimized in this work. Not all samples were evaluated with all protocols. The cut-off for positivity for each mix is shown with an orange line. Diagnostic was done with a TaqMan commercial kit. Negative samples with undetermined Ct were assigned a pseudo-Ct of 41. (E) A drop in diagnostic sensitivity using two-step RT-qPCR approaches is circumscribed to samples with higher Ct values. Table summarizing the sensitivity observed using either the INBIO master mix or the custom-made mix when separating the positive samples in terciles (T1-T3) according to the previously assessed Ct value using the RT-qPCR DisCoVery kit (ORF1ab and N amplicons). (F) RT-qPCR amplification curves for either serial dilutions of a pool of positive samples (top panel) or random samples (bottom panel), using four different retro-transcriptases for cDNA synthesis
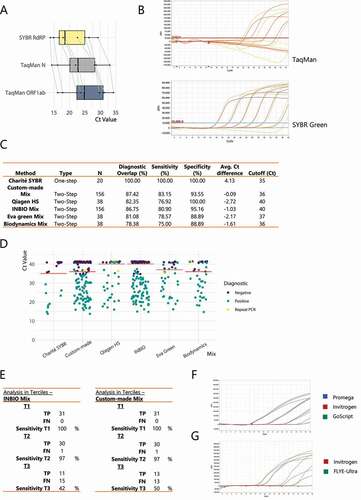
Next, we decided to switch to a classic two-step RT-qPCR protocol to broaden the possibilities of reagents to be used for the procedure. We tested the different qPCR mixes in a panel of samples (38–156 samples) comparing in parallel with a TaqMan diagnosis commercial kit (DisCoVery by AP-Biotech) as our gold-standard. By analysing the overlap with this gold-standard and calculating the corresponding sensitivity and specificity values, we show that every commercial qPCR master mix we tried (INBIO Highway Ref M130, Solis Biodyne 5x HOT FIREPol EvaGreen® qPCR Mix Plus and Biodynamics Real Mix Ref B124-100, see Methods for details) and two custom mixes (INBIO Highway Taq E1202 preparation and Qiagen Hot Start Taq 203203, see Methods for details) proved efficient for diagnosis purposes (, detailed by sample at Supplementary Data 1) with the proposed primers and qPCR program, and adjusting a specific Ct cut-off for each case.
Remarkably, none of the mixes showed an average Ct shift higher than 3 cycles ( and Supplementary Data 1) when comparing with the DisCoVery SARS-CoV-2 kit. As expected, the decrease in sensitivity in the 2-step options is biased towards the samples with low amounts of viral RNA, as measured by the DisCoVery SARS-CoV-2 RT-qPCR kit (). While this would result in an increase of the number of false negatives, it would affect people with lower viral load specifically, which tend to correlate with lower transmission [Citation13,Citation14]. Furthermore, we propose that this is a minor drawback if it is counterbalanced by a large increase in the testing capabilities due to the higher availability and lower costs of reagents and the use of a broader range of qPCR thermocyclers.
Lastly, four different reverse transcriptases were tested, and the RT procedure was simplified and streamlined to be time saving and to reduce manipulation of samples (see Methods). Our results showed that all the tested RT enzymes worked equally well ( and G).
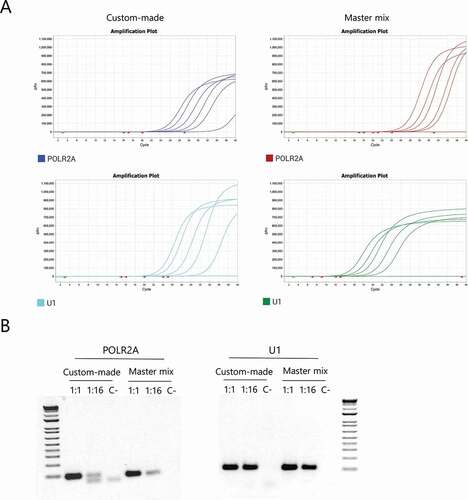
Selection of a human housekeeping gene to be used as an internal control
Two primer pairs, targeted to human POLR2A mRNA and U1 snRNA, were shown to work adequately with the proposed mixes (). Thus, either one can be used as an internal control for diagnosis.
Figure 3. Selection of a human housekeeping gene to be used as internal control. (A) Representative amplification curves for POLR2A and U1 using both the custom-made mix and the INBIO master mix. (B) Agarose gel electrophoresis of the products obtained after qPCR of 1:1, 1:16 dilutions and the negative control respectively, for each primer pair using both mixes
Discussion
The aim of this report is to provide alternative RT-qPCR approaches for diagnosis of COVID-19 caused by the severe acute respiratory syndrome coronavirus 2 (SARS-CoV-2). We present alternative strategies to the current gold standard (TaqMan-based RT-qPCR), mainly based in intercalating dye-based detection. The key advantages of intercalating dyes (particularly SYBR Green) are their wide availability, low cost, simplicity of use, wide range of thermocyclers capable of detecting them and the easy ordering of oligonucleotides without the requirement for labelled probes. While the use of SYBR Green-based alternatives has been previously described [Citation10,Citation15,Citation16], here we show that this strategy could significantly expand the PCR testing capacities by applying it to a range of protocols and reagents that makes this a flexible and cheap alternative to current commercial kits. In addition, the chosen pair of primers used here anneal to sequences of the viral genome that present no mutations in the current variants of concern (), widely known as B.1.1.7 (UK), B.1.135 (South Africa), B.1.429 (California) and P.1 (Brazil). It is important to increase the number of working primer sets to allow for a quicker response to future mutations that continue to arise.
With regard to the diagnosing process specifically, probably the most time-saving option that we favour would be to follow the Charité protocol adapted for SYBR Green. Nevertheless, as mentioned before, we decided to optimize different alternatives in case that One-Step master mixes would appear out of reach either due to their cost or their unavailability in local or regional markets. This might sound far-fetched in economically strong countries but needs to be deeply considered for those peripheral countries struggling with recession, shortages and lack of infrastructure. Consequently, we generated Two-Step protocols that can be followed with commonly used reverse transcriptases (MMLV-RT) from different vendors and a variety of qPCR mixes. For the former we tried four different RT brands, all of which performed equally well, leading to the speculation that RT from additional vendors could probably be used as well, after little experimental validation. Similarly, as long as the proposed qPCR cycling program and pair of primers are used, all the qPCR mixes we tested, including a very accessible custom formulation, proved to be useful for the described procedure.
The main limitation we encountered when switching to intercalating dyes for detection was unspecific amplification. Unlike labelled probes, which have an extra layer of specificity, negative samples analysed with SYBR Green-based qPCRs may sometimes exhibit unspecific sigmoidal fluorescence curves with high Ct values due to, for example, primer dimer amplification. While the wide screening of primer pairs that we performed resulted in an amplicon where this issue was greatly diminished, it came at the cost of analysing and setting a specific threshold in order to consider a sample as positive for each qPCR mix. The thresholds were selected to exclude Cts arising from occasional amplification of negative controls (lacking any template). As described above, this did not have a major effect on the sensitivity of detection. It is worth mentioning that a negative result on this kind of test does not rule out completely the possibility of actual SARS-CoV-2 infection. Other variables, like the progression of the disease at the moment of the swab or the quality of the sample, also influence the final result of the test. A proper diagnosis must take into account all these variables and not only the result of the qPCR.
The work presented here clearly broadens the possibilities regarding the use of reagents and equipment. Furthermore, despite being based on intercalating dyes, this method displays similar diagnostic power to widely used qPCRs methods based on labelled probes. Hence, combining these alternatives for SARS-CoV-2 detection by RT-qPCR with simple and accessible clinical sample and RNA preparation methods, would render a significant improvement on testing capacities, specially of low-to-medium income countries.
Disclosure of potential conflicts of interest
No potential conflict of interest was reported by the author(s).
Supplemental Material
Download Zip (97.6 KB)Acknowledgments
We thank Alejandro Colman Lerner, Andrea Barta, Alwin Köhler (Vienna COVID-19 Detection Initiative) and Rodrigo A. Gutiérrez for helpful feedback and help. We are deeply grateful for the constant support provided by the whole community at IFIBYNE, IQUIBICEN, INBIRS and INEI-ANLIS-Malbrán even under unprecedented circumstances. Without their dedication and commitment, this research would have not been possible. We specially acknowledge the help of Rocío S. Tognacca, Luciano Marasco and Nicolás Gaioli. We also acknowledge the help and support from Fernan Agüero and Emir Salas Sarduy.
Supplementary material
Supplemental data for this article can be accessed here
Additional information
Funding
Related Research Data
References
- Roser M, Ritchie H, E. -O-O, et al. Coronavirus Pandemic (COVID-19). Our World Data. 2020.
- World Health Organization. COVID-19 - virtual press conference 30 March 2020.
- Gandhi M, Yokoe DS, Havlir DV. Asymptomatic transmission, the Achilles’ heel of current strategies to control covid-19. N Engl J Med. 2020;382(22):2158–2160.
- Mizumoto K, Kagaya K, Zarebski A, et al. Estimating the asymptomatic proportion of coronavirus disease 2019 (COVID-19) cases on board the diamond princess cruise ship, Yokohama, Japan, 2020. Eurosurveillance. 2020;25(10). DOI:https://doi.org/10.2807/1560-7917.ES.2020.25.10.2000180
- Tong Z-D, Tang A, Li K-F, et al. Potential presymptomatic transmission of SARS-CoV-2, Zhejiang Province, China, 2020. Emerg Infect Dis. 2020;26(5):1052–1054.
- Bai SL, Wang J Y, Zhou Y Q, et al. Analysis of the first cluster of cases in a family of novel coronavirus pneumonia in Gansu Province. Zhonghua Yu Fang Yi Xue Za Zhi. 2020. DOI:https://doi.org/10.3760/cma.j.0253-9624.2020.0005.
- Corman V, Bleicker T, Bruxnink S, et al. Diagnostic detection of 2019-nCoV by real-time RT-PCR.
- Corman VM, Landt O, Kaiser M, et al. Detection of 2019 novel coronavirus (2019-nCoV) by real-time RT-PCR. Eurosurveillance. 2020;25(3). DOI:https://doi.org/10.2807/1560-7917.ES.2020.25.3.2000045
- Shen M, Zhou Y, Ye J, et al. Recent advances and perspectives of nucleic acid detection for coronavirus. J Pharm Anal. 2020;10(2):97–101.
- Won J, Lee S, Park M, et al. Development of a laboratory-safe and low-cost detection protocol for SARS-CoV-2 of the coronavirus disease 2019 (COVID-19). Exp Neurobiol. 2020;29(2):107–119. .
- Untergasser A, Cutcutache I, Koressaar T, et al. Primer3–new capabilities and interfaces. Nucleic Acids Res. 2012;40(15):e115–e115. .
- Ye J, Coulouris G, Zaretskaya I, et al. Primer-BLAST: a tool to design target-specific primers for polymerase chain reaction. BMC Bioinformatics. 2012;13(1):134. .
- Walsh KA, Jordan K, Clyne B, et al. SARS-CoV-2 detection, viral load and infectivity over the course of an infection. J Infect. 2020;81(3):357–371.
- He X, Lau EHY, Wu P, et al. Temporal dynamics in viral shedding and transmissibility of COVID-19. Nat Med. 2020;26(5):672–675. .
- Pereira-Gómez M, Fajardo Á, Echeverría N, et al. Evaluation of SYBR Green real time PCR for detecting SARS-CoV-2 from clinical samples. J Virol Methods. 2021;289:114035.
- Marinowic DR, Zanirati G, Rodrigues FVF, et al. A new SYBR Green real-time PCR to detect SARS-CoV-2. Sci Rep. 2021;11(1):2224.