
ABSTRACT
RNA variants that emerge from editing and alternative splicing form important regulatory stages in protein signalling. In this report, we apply an integrated DNA and RNA variant detection workbench to define the range of RNA variants that deviate from the reference genome in a human melanoma cell model. The RNA variants can be grouped into (i) classic ADAR-like or APOBEC-like RNA editing events and (ii) multiple-nucleotide variants (MNVs) including three and six base pair in-frame non-canonical unmapped exons. We focus on validating representative genes of these classes. First, clustered non-synonymous RNA edits (A-I) in the CDK13 gene were validated by Sanger sequencing to confirm the integrity of the RNA variant detection workbench. Second, a highly conserved RNA variant in the MAP4K5 gene was detected that results most likely from the splicing of a non-canonical three-base exon. The two RNA variants produced from the MAP4K5 locus deviate from the genomic reference sequence and produce V569E or V569del isoform variants. Low doses of splicing inhibitors demonstrated that the MAP4K5-V569E variant emerges from an SF3B1-dependent splicing event. Mass spectrometry of the recombinant SBP-tagged MAP4K5V569E and MAP4K5V569del proteins pull-downs in transfected cell systems was used to identify the protein-protein interactions of these two MAP4K5 isoforms and propose possible functions. Together these data highlight the utility of this integrated DNA and RNA variant detection platform to detect RNA variants in cancer cells and support future analysis of RNA variant detection in cancer tissue.
Introduction
Proteogenomics platforms aim to define the expressed and mutated genome in a diseased state to better determine the mechanisms whereby signal transduction is re-wired through mutant protein signalling [Citation1]. These approaches have been implemented in many cancer types including ovarian, colorectal, endometrial, lung, prostate and renal tissues [Citation2–6]. Although disease-specific signalling maps can be constructed, whole-genome cancer sequencing has revealed a patient-specific cancer barcode [Citation7,Citation8] that complicates stratification of patients based on gene mutation status. In addition, although the vast majority of anti-cancer medicines target wild-type proteins, there are ever emerging successes in targeting mutated enzymes (kinases) with effective drug leads [Citation9,Citation10]. This provides the proof of concept that drugging mutated signalling networks has therapeutic value and presents an opportunity to develop precision, personalized therapeutics based on expressed, mutant proteins.
Understanding the expression of mutant proteins in a diseased state could form a platform for the development of a range of mutation-dependent therapeutics [Citation11]. For example, mutant neoantigen vaccines could be developed using scaffolds such as synthetic mutant proteins [Citation12], activated dendritic cells [Citation13], nucleic acids including RNA [Citation14] or synthetic viral vectors [Citation15]. Common sets of mutated neoantigens can be identified in patients with microsatellite instability cancers emerging from mutations within microsatellite regions [Citation16]. Nevertheless, the study of mutant proteome landscapes is only in its infancy. This task is complicated because building mutant proteomes involves the integration of methodologies that link the fields of informatics and mass spectrometry with cancer biology. There are major challenges with integrating DNA sequencing, RNA sequencing, and mass spectrometric datasets [Citation17]. Although packages/platforms for identification of mutations/variants in DNA sequences are perhaps more evolved [Citation18], the algorithms for defining mutations with RNA sequencing datasets are very complex because the RNA mutation landscape is more pleiotropic than DNA. RNA mutations can be encoded by exons and by introns from pre-spliced RNA [Citation19,Citation20]. In addition, defining cancer-specific RNA edits [Citation21], tumour-specific spliced mRNAs generating tumour-specific proteins [Citation22–24], or even translation of UTRs provide novel mutant protein signalling landscapes [Citation25]. As the diversity in software and computational tools tend not to be benchmarked against each other, there is as of yet no unified and validated roadmap.
In a previous report, we have benchmarked an integrated DNA and RNA variant identification software platform (CLC) to define expressed, p53-dependent single nucleotide variants (SNVs) in a human melanoma cell model [Citation26]. The expressed SNVs detected in mRNA from the cell lines were validated using mass spectrometry in order to define the integrity of the variant identification software. This approach yielded mutant protein signal transduction maps that are enriched in either the wt-p53 or the p53-null isogenic cell model. In addition to RNA mutations that are genetically encoded, it is of interest to expand on the type of RNA variants, including RNA edits, that deviate from the genomic DNA sequence in tumour cell models. Emerging software tools are improving the detection of A-to-I RNA editing events [Citation27,Citation28] including developing a library of edited targets [Citation29–32].
Here we expand on the use of the CLC integrated DNA and RNA variant detection software to define both the classic RNA edits and also multiple-nucleotide variants (MNVs) that reflect small exons not previously annotated to a reference genome. Prior to our current study, the CLC integrated DNA and RNA variant detection software has been used to identify RNA editing events in 34 protein-coding mitochondrial transcripts of four Populus species, a genus with a relatively small number of RNA editing sites relative to other angiosperms [Citation33]. We were able to define sets of classical RNA edits as well as MNVs in the tumour models. We focus on validating one of these MNVs; the differential splicing of a previously non-annotated three base pair, highly conserved exon in the MAP4K5 gene that results in the insertion of one amino acid in the protein. These data together establish the utility of this integrated DNA and RNA variant identification software to discover novel RNA variant landscapes in cell models and further highlights that understanding proteome regulation requires more accurate tools to define the RNA reference set.
Results
Defining the global RNA variant landscape in A375 melanoma cells
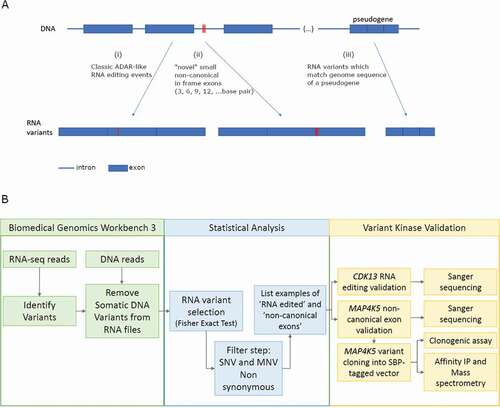
In a prior report [Citation26], the CLC variant detection platform was benchmarked against Varscan2 to identify DNA encoded expressed RNA variants in an isogenic wt-p53 A375 and p53-null A375 melanoma cell model. A total of 1468 mutated mRNA species encoded by 989 mutated genes were defined [Citation26]. These data were then used as a reference database to define the baseline p53-dependent and p53-independent mutant proteome networks using mass spectrometry which includes over 300 mutant proteins [Citation26]. Here we aim to expand on the RNA variant landscape from wt-p53 and p53-null A375 melanoma cells, without and with interferon treatment, that deviate from the reference genomic DNA sequence. The reason for using four biological states from highly similar genomes was to focus on common variant pathways that reflect robustness of the RNA variant type. Such RNA variants might be derived from; (i) classical A-I RNA editing events; (ii) non-canonical splicing events generating novel MNVs (exons) that have not been annotated by the reference transcriptome; or (iii) possible pseudogene expression incorrectly mapped to a reference gene but not reflecting true RNA edits ()). The RNA variants were filtered using the Fisher’s exact test which was used previously to define the likelihood of true variance in RNA edits ()) [Citation34,Citation35].
Figure 1. RNA variant detection processes
Using the Fisher’s exact test, the number of variants detected that are nonsynonymous, synonymous or non-coding are presented in Supplementary Tables 1A-G. In the four biological states used, the range of non-synonymous variants with 2 RNA variant reads or higher ranges from 3392 to 6377 (, i). The range of total non-synonymous variants with 10 RNA variant reads or higher ranges from 102–559 (, iii). The range of non-synonymous SNV variants with 10 RNA variant reads or higher ranges from 29 to 197 (, iii sublevel). Specific RNA variants (i.e. A-G and C-T) detected from 2–10 reads or higher identified in these four biological states are highlighted in (i, ii, iii). For example, with a minimum of 10 variant RNA reads, the number of ADAR-like A-I variants (defined as A/G sequencing reads) that passes the Fisher’s exact test filtering was 154 and the number of APOBEC-like C-U variants (defined as C/T sequencing reads) was 163 (, iii). G to A variants () might arise from APOBEC3A-dependent processes [Citation36], whilst U-C variants () might arise from transamination and transglycosylation [Citation37]. A calculation of the extent of classic non-synonymous RNA editing events (A-I + C-U; 720) over the total non-synonymous RNA variants from Supplementary Table 1A (3,123) is 23.05%.
Table 1. Different types of RNA variants that pass the Fisher’s exact test. (A) Number of variant types in isogenic A375 cell lines (p53 WT and null, treated and not treated with interferon (IFN)). (B) Number of A-G and C-T variants in A375 p53-WT
Examples of specific SNV variants of interest are summarized in . One non-coding RNA variant we include (from Supplementary Table 1 F) is the miRNA, MIR663AHG, which has two A-G variants represented by over 1,000 reads each (; Supplementary Table 1 F). MIR663AHG has not been previously shown to be a target of the RNA editing machinery; however, other miRNAs have been shown to be edited by the ADAR-dependent mechanisms [Citation38,Citation39]. Several protein kinases are highlighted including CDK13, CDK10, CDK11, and CDK12, which exhibit A-G variants in the sequencing reads (). For example, CDK13 exhibits 17 out of 22 variant A-G RNA reads, with a total of 43 wt-DNA reads yielding a Fisher’s exact test p-value of 1.4 e-11. CDK10 exhibits 12 out of 20 variant A-G RNA reads, with a total of 45 wt-DNA reads yielding a Fisher’s exact p-value of 3.1 e-08. These A-G variants are most likely ADAR-dependent A-I RNA editing events. A representative nucleotide insertion event (C) in the RNA encoding SEPT7 produces a theoretical frame shift; SEPT7 exhibits 103 out of 146 variant C insertion RNA reads, with a total of 19 wt-DNA reads yielding a Fisher’s exact p-value of 1.1 e-09. A gene with a representative MNV (YTHDF3) exhibits 13 out of 15 RNA variant reads, with a total of 66 wt-DNA reads yielding a Fisher’s exact p-value of 2.7e-13. This representative MNV is most likely an alternate or non-canonical short exon, similar to MAP4K5 (See below).
Table 2. Examples of specific single nucleotide variants (SNV) of interest. SNVs in miRNA are highlighted in green, while SNVs in kinases are highlighted in yellow
Summarized next are groups of genes with high-confidence, canonical A-I (shown as A-G change in the sequencing results) ADAR-like editing events (). Several genes of interest from the stress-activated signalling and cancer field emerge and we generally focus on protein kinases which form drugabble targets in oncology. We first focus on the previously identified edits in the cell cycle-dependent kinase superfamily member, CDK13 [Citation40]. The latter study linked this editing event to poor prognosis in hepatocellular cancer patients, but biochemical characterization to provide a potential mechanism was not performed. The identification of this CDK13 mRNA editing event in the A375 cell line using the CLC software (predicted amino acid change of Gln103Arg) forms a type of internal validation that suggests this informatics tool has value for identifying RNA variants from a reference set. In addition, to the ADAR-like editing events, we also present a list of the top genes with canonical C-U (presented as C-T changes in sequencing data) APOBEC-like editing events (). For example, HSPD1 mRNA exhibited a variant rate of 70.31% (45 out of 64 RNA sequencing reads are C to T). In general, it is thought that APOBEC RNA editing forms a smaller landscape than ADAR, but in our analysis, C-U variants were as wide-spread as A-I variants (). Future research will determine whether these C-U variants are APOBEC-dependent. We also include non-canonical RNA variants (A-T) of unknown origin that emerge from this software. A-T variants only represent a small proportion of the total, classical RNA editing events if variants are included that are only above 10% of the total RNA reads (). If the total A-T RNA variants are included from this analysis, then there are hundreds that fall below the 10% threshold (Supplementary Table 1 G). These low-frequency A-T RNA variants might be either hotspots of RNA polymerase errors [Citation41] or hotspot sequencing errors arising from the next-generation shotgun sequencing methodology [Citation42]. Although the origin of such A-T variants are not known, in this manuscript we validate one of the high-frequency variants as being attributed to a non-annotated small exon in MAP4K5 ().
Table 3. Summarized groups of genes with high-confidence A-G variants
Table 4. Summarized groups of genes with high-confidence C-T variants
Table 5. A-T variants observed
Using the totality of these RNA variants, we evaluated the dominating gene family groups that exhibit overlapping or diverse RNA variant expression in the four biological states (Supplementary Figure 1A). In general, for transcription gene products (‘Transcription, DNA-templated’ and ‘Regulation of Transcription’; Supplementary Figure 1A), the wt-p53 cells (untreated) exhibited similar extents of RNA variants as p53-null cells (treated with interferon). We focus here on summarized the ‘DNA repair’ gene family of proteins which are highest in the p53-null cells (not treated with interferon) (Supplementary Figure 1A). When these were dissected gene-by-gene, then the gene products that exhibit the elevated variant mRNA production are listed in Supplementary Figure 1B. Together, these data highlight the feasibility of using the CLC software to study changes in the RNA variant landscape. Below, we focus on validating two key RNA variants that represent different types of variants that can be measured; an RNA editing event in CDK13 and a non-canonical splicing event in MAP4K5.
Sanger-sequencing validation of the dominant RNA editing events in the CDK13 mRNA
The genome browser view of the region in CDK13 which is edited at the RNA level is shown in . CDK13 shows A-to-I editing within exon 1 in A375 melanoma cells as well as SiHa cervical carcinoma cells. These data, along with prior reports of CDK13 RNA editing [Citation40,Citation43], suggests that editing at this position is widespread. The dominant edit would change a glutamine to an arginine (Q to R) in codon 103 if the mRNA were translated. This high-level editing in CDK13 transcript suggests a functional role for the predominant edited variant of the gene product [Citation44]. In addition, we also detect the A-G variant nearby codon 103, the K96R variant, although the reads are substantially reduced and they both exist on the same transcript (i.e. these two RNA editing events are not apparently mutually exclusive on the same transcript [Citation40] ()).
Figure 2. RNA variants that represent potential A-to-I editing events
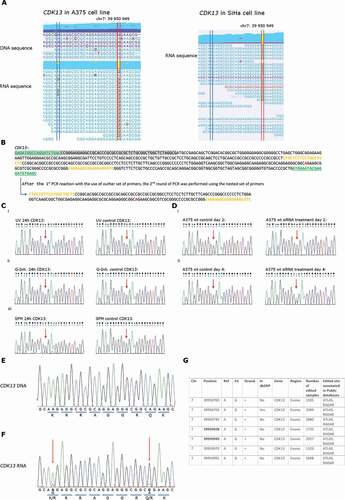
Despite the fact that CDK13 has been previously shown to be edited at codon 103 [Citation40], we validated this target further using Sanger sequencing since it is the most abundant editing event. Due to the GC-rich nature of CDK13, nested PCR primers were first used to amplify the CDK13 fragment from cDNA libraries ()). Using these optimized primers, we could detect edited (I, recognized as G) and non-edited (A) species in a range of conditions as defined by the ratio of G and A sequencing reads (), We were unable to detect changes in the G/A ratio in this cell model in response to UV irradiation ( i), splicing inhibitor treatment ( ii), or the replacement of cells in serum-free media ( iii). However, the long-term incubation of cells with an siRNA control reduced the G-A ratio so that the non-edited sequence predominated after 4 days of incubation (ii vs )i. These latter data suggest that editing of CDK13 can be regulated by signalling changes. Future work will define the function of the edited version of CDK13 gene product and how this editing event can be regulated.
Sanger validation of the minor RNA editing event in relation to the major RNA editing event was also shown in ; the K96R variant exhibits less editing that the Q103R variant based on peak intensities of the G or A sequencing reads ( vs 2(f)), which is consistent with the number of reads in the CLC browser () and Supplementary Table 1A). There are seven other non-synonymous RNA editing events localized in this small exonic region and the editing is variable ()). The translation of these mRNAs with multiple editing events would, in principle, lead to single, double, triple, and quadruple, etc. mutant CDK13 proteins. As such, functional characterization of these multi-mutant proteins was not evaluated in this study because of the potential variable number of mutant protein products. Nevertheless, our data validate the utility of the software to identify RNA editing events. CDK13 forms an interesting target in the future to validate because the kinase can play a role in splicing regulation by controlling the phosphorylation status and the activity of splicing factors [Citation45]. Furthermore, CDK13 is localized in the nucleus, particularly in speckles which are the storage site for splicing factors [Citation46]. More recently, CDK13 depletion was shown to lead to defects in RNA processing [Citation47]. In recent years, CDK13 has been recognized as a novel oncogene with potent oncogenic activity in various cancer types as it affects cell cycle regulation, proliferation, and chromosome stability functions [Citation48]. Furthermore, pancreatic disease link associations could be made for upregulated CDK13 by pathway network linkages to p53 [Citation49].
Validation of the non-canonical RNA variant in MAP4K5 mRNA
The CLC RNA variant detection software identifies RNA species that deviate from the reference sequence. This can include not just single nucleotide variants typical of classic RNA editing (A-I or C-U) (), but also MNVs and indels (); Supplementary Tables 1 C-E). Focusing again on protein kinases, using Ensembl RefSeq v74 as a reference sequence, the A-T RNA variant in MAP4K5 mRNA can be mapped to an exon-intron boundary ()) that is spliced at the downstream intron-exon boundary to create an in frame single amino acid insertion. However an updated version of the RefSeq (Ensembl v91) maps the change to a non-canonical three base exon ()). These data highlight the relative difficulty in mapping very small non-canonical RNA variants to a reference dataset. We think it is more likely that the ‘A-T variant’ is not mapped correctly to the reference genome and it is more likely that these RNA reads derive from a non-canonical three base exon that deviates from the genomically predicted valine codon at 569 position (). In addition, it is unlikely that this three-base non-canonical exon is mapped to the correct intronic position (as reported in )) as we can identify several GAA (CTT) motifs across the 2,001 bp intron 23–24.
Figure 3. RNA variants in the MAP4K5 gene
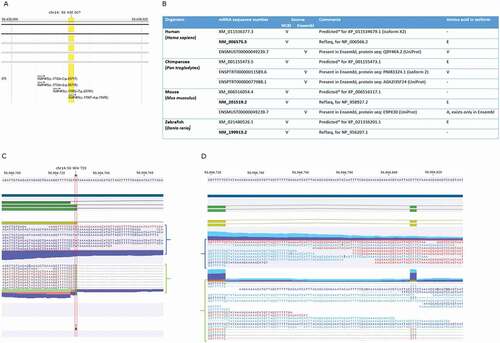
Regardless of the mechanisms generating the RNA variant in MAP4K5 mRNA, the genomic annotation of MAP4K5 at this position is not resolved based on public data in different vertebrate species ()). The human MAP4K5 protein found in Ensembl and in NCBI displays three different transcripts with regard to the codon that has the RNA variant () Human). One variant has a reference sequence that codes for the Valine amino acid (GTA). The second transcript has the variant (GAA) which codes for the amino acid Glutamic acid. The third transcript has this codon deleted. Pan species has the same three transcripts to humans () Chimpanzee). Murine species has the codon GCA, instead of GTA, in one transcript which codes for Alanine () Mouse). The other two transcripts are similar to the second and third transcripts to humans with the variant codon GAA and with the deleted codon, respectively. Danio species have two transcripts only; one with the variant codon GAA, and one with the deleted codon () Zebrafish). Thus, this RNA variant is conserved in many species suggesting selection pressures exist for this specific variant in vertebrates.
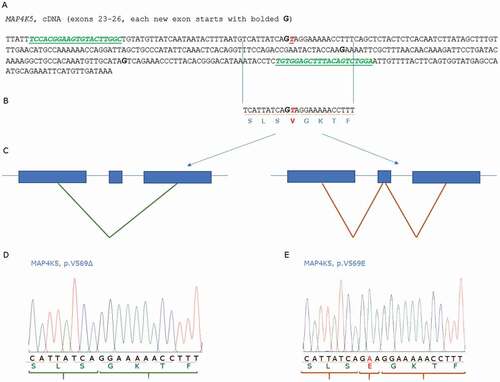
We next validated the RNA variant in MAP4K5 mRNA and whether we could find evidence that it is regulated by splicing mechanisms. First, the reference cDNA sequence predicts a Valine at position 569 based on the Ensembl genomic reference sequence that is encoded by a GTA at the exon23-intron23-24 boundary (). If the V569 or E569 allele is derived from the alternative splicing of an exon encoding a Glutamate (E) or Valine (V), then the splicing pattern would be as predicted in ). We next developed a plasmid expressing MAP4K5 protein including the variant V569E and the 569del allele. Sanger sequencing of the expression plasmid DNAs using primers depicted in ), gave rise to the SLSGKT amino acid stretch that derives the 569del allele ()) or the SLSEGKT that derived the V569E allele ()). Having optimized primers for quantifying the RNA variant region, we purified RNA from a range of cells and tissues to determine whether these variants can be detected and quantified. Supplementary Figure 2A reveals that the V569E allele dominates in RNA derived from muscle, adipose, normal human fibroblasts (NHF), or A549 lung cancer cells. In addition, the treatment of A549 lung cancer cells by starvation or over confluence does not alter the expression of the V569E allele (Supplementary Figure 2B). Thus, we see no evidence of the annotated Valine amino acid, although it remains possible that other conditions or cell models might incorporate a different 3 bp exon encoding Valine in place of Glutamate.
Figure 4. Developing Sanger sequencing of two MAP4K5 isoforms
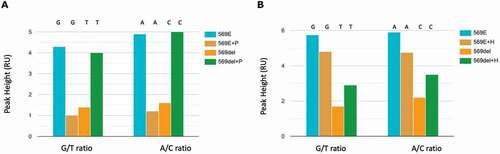
We next wanted to determine whether we could drive production of the 569del mRNA species through inhibition of RNA splicing. We used the SF3B1-specific inhibitor Pladienolide B ( and Supplementary Figure 3) [Citation50]. At the 24-h time point, the lower dose of Pladienolide B marginally increased the amount of the 569del allele (Supplementary Figure 3C vs 3B and 3A). However, by 48 hours there was a substantial increase in the 569del allele and reduction in the V569E allele at the lower dose of inhibitor (10 nM; Supplementary Figure 3F vs 3E and 3D). The higher dose of the Pladienolide B inhibitor (100 nM) did not reduce the splicing as affective as the lower dose. Quantification of the Sanger sequencing demonstrated that the ratio of non-spliced:V569E spliced mRNA was 0.32 in non-treated conditions but 4.06 in the presence of Pladienolide B (10 nM; )). A different splicing inhibitor (Herboxidiene [Citation50]) that also inhibits SF3B1 was titrated to determine effects on the splicing ratio. This inhibitor also increased the level of the 569del allele which removes the 3 bp Glutamate encoding exon (Supplementary Figure 4(C,F) vs 4A and 4D). Quantification of the Sanger sequencing bases demonstrated that the ratio of non-spliced:V569E spliced mRNA was 0.33 in non-treated conditions but 0.67 in the presence of Herboxidiene B (10 nM; )). These data confirm that the RNA variant has emerged due to splicing of the 3 bp exon encoding Glutamate, although further research will be required to map the location of this exon and to determine whether the cell might use the valine encoding 3 bp exon under different physiological conditions.
Figure 5. MAP4K5 Sanger sequencing results quantitation after Pladienolide B and Herboxidiene treatment
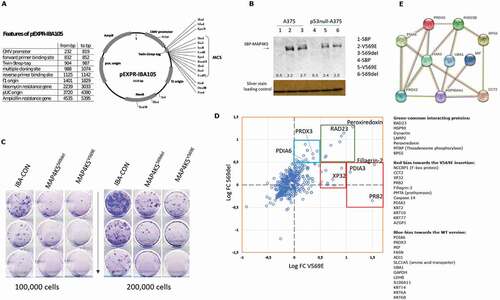
Having establish that the 569del allele and the V569E allele as the two dominating isoforms detected at the RNA level, we asked whether either of these two variants exhibited any differences in clonogenic activity and/or interaction partners. We would expect some equilibrium shift in the interactome of these two proteins considering the small exon variant is highly conserved within vertebrates. First, the 569del allele and the V569E allele were subcloned into pEXPR-IBA105 containing an SBP tag for affinity purification ()). When these two plasmids were transfected into wt-p53 and p53 null melanoma cell lines, the expression of both could be quantified ()), and the levels of both were equivalently expressed in p53-null cells. These data suggest the variations in the proteins do not dramatically alter their steady state levels. Upon transfection and dilution for limited cell number to measure clonogenicity, there were two notable observations. First, both alleles induced a growth suppression, rather than growth stimulation, suggesting that they function more like tumour suppressors than oncogenes. Second the V569E allele was marginally more active as a growth suppressor, with the V569E suppressing growth by 19% and the 569del suppressing growth by 33% relative to the control vector ()). Finally, interactomic immunoprecipitation (IP) identified shared protein–protein interaction sites, but also differences in the quantitative capture of certain protein targets ()). The aggregate of all the significant interacting proteins (above log0.5) that form a network using STRING is shown in ). Based on these data, the core function of both MAP4K5 isoforms could to be interactions with the protein disulphide isomerase family members including peroxiredoxin (), green upper right quadrant). Peroxiredoxin can regulate oxidative stress responses including protein folding [Citation51]. Related to this, the protein RAD23 is also detected in the pull-down experiments and this protein has also been shown to play a role in protein degradation in response to ERAD (endoplasmic reticulum-associated degradation) quality control [Citation52] through interactions with ubiquitin. Based on this core function, and the differential quantitative detection of common interacting proteins, we could speculate that the 569del form of MAP4K5 interacts stronger to the ubiquitin regulator UBA1 and the protein disulphide isomerases – PDIs (PDIA6 and PRDX3) (), blue quadrant). By contrast, the V569E isoform shows stronger interactions with secretory or barrier function proteins, such as Fillagrin, XP32, and PRB2 (), red quadrants). Together, these data suggest that the 3 bp exon inclusion changes the equilibrium of the kinase towards distinct protein networks and its conservation from fish to mammals suggests this small non-canonical exon plays an important role in MAP4K5 protein function.
Figure 6. Biochemical evaluation of MAP4K5 variants
Discussion
Cancer genome sequencing has revolutionized our understanding of the genetic basis of cancer, the classes of mutagenic events that drive cancer development, and the identification of genetic drivers [Citation53,Citation54]. However, we do not yet know how this mutated code is translated into an expressed phenotype. Identifying the expressed cancer genome, using RNAseq and protein quantitation methods such as mass spectrometry, provides a more accurate view of the state of the cancer tissue at the time of presentation in the clinic. Although mass spectrometric software including Proteome Discoverer or Maxquant [Citation55,Citation56] provides a coding-independent user interface that raises the impact of mass spectrometry, the vast majority of next-generation data analysis using DNA variant detectors derived from Varscan or Mutect requires computational coding [Citation57,Citation58]. An integrated DNA and RNA variant detection software tool (CLC) was utilized that is similar in scope to the Proteome Discoverer software tool used by mass spectrometrists that does not require computational coding [Citation59]. This democratizes DNA and RNA variant detection to the life-science community, from the plant sciences community through to the field of human disease [Citation60–65].
In our prior study, we benchmarked both CLC and Varscan2 as two independent variant detection platforms to define the overlap in their mutation detection and define their dual utility in creating a mutant genomic reference database for optimizing mutant peptide detection using mass spectrometry [Citation66]. Mass spectrometry has also been used previously to identify peptides derived from RNA editing events [Citation21]. We have compared Varscan to CLC variant detection and have confirmed their similarity at DNA variant identification in a cancer cell model and also confirmed mRNA SNVs at the proteome level through the use of mass spectrometry to identify mutated peptides [Citation66]. Based on the data obtained from the plant science community on RNA-editing using the CLC tools, we now have applied this RNA variant detection platform to our human melanoma cell model to determine whether the RNA variant landscape can be defined.
The data output can be exported as the number of synonymous or non-synonymous RNA reads that deviate from or match a reference DNA read set (Supplementary Table 1A and ). The RNA sequence deviations from the reference genome can be further annotated into SNVs, MNVs, indels, and replacements (Supplementary Tables 1B-E). In addition, the overall landscape of SNV type can be stratified into A-G/G-A or C-T/T-C mutations (). In general, the data demonstrate that the ratio of A-G or C-T mutations in RNA is within an order of magnitude of each other. As most RNA editing software focus on a type of RNA editing (such as A-I), it is not clear whether the C-U or A-I RNA editing landscape defined by CLC is representative of other platforms or other cell models. For example, even in studies where APOBEC dependent RNA editing is amplified [Citation67,Citation68], such studies do not usually compare the ratio of ADAR to APOBEC events.
In our current study, we first focused on validating one of the A-I RNA-editing events we detected, that has been reported previously. CDK13 mRNA over-editing has been reported in liver cancer [Citation40] using RNAEditor [Citation69]. This latter study identified two RNA editing events that could give rise to Q103R and K96R mutation in CDK13. We also can observe both RNA A-I editing events, with the G sequencing reads detected at codon 103 and 96 positions (in blue and red lines, i)) although the Q103R variant predominates ()). The SiHa cell model only identified RNA editing changes at the 103 codon position ()). It is noteworthy that the other CDK orthologues-CDK10, CDK11, and CDK12 which share similar G-C rich regions as CDK13 also display a degree of A-I editing in their transcripts (, CDK10 (Gln46Arg); CDK11 (Cys23Arg); and CDK12 (Gly1425Arg)). It will be interesting in the future to expand on the editing regulation of these CDK orthologues, determine whether mutant proteins are produced as a result of the edit, and what might be the change in function of the edited genes.
In addition to classic A-I or C-U RNA edits, the CLC software also defines RNA variations in a cDNA sequence that does not match a reference genome. Genes like MAP4K5 or DIAPH2 (Supplementary Table 1C) have in frame small exons (3–6 bp) that represent ‘unmapped’ or non-canonical exons that are difficult to annotate with large intronic regions. We focus here on validating one representative class with a small in-frame exon, MAP4K5. The genomic sequence of MAP4K5 predicts a GTA sequence at exon23-intron23-24 boundary that encodes a Valine at codon 569 ( and 4). However, the RNA sequencing produces data that is defined as a variant by the CLC software () that replaces a GTA with GAA leading to an Glutamate at codon 569. However, the genome sequence cannot accommodate this unless an A-T edit is annotated ()) or a downstream GAA exon (CTT reverse strand) is annotated into the intron ()). The A-T deviation can be altered using splicing inhibitors that reduces the GAA sequence ( and Supplementary Figures 3 and 4) suggesting that the deviation comes from a 3 bp exon in the intron. However, as a 1 bp exon has been reported previously [Citation70], we cannot be confident whether the GAA exon arises from a 3 bp exon within intron 23–24, or a 1 bp exon that fuses to the terminal end of exon 23 and deletion of T nucleotide on the beginning of exon 24. Nevertheless, so-called microexons have been observed previously with as little as 3 bp exons being detected [Citation71]. In conclusion, the integrated DNA and RNA variant detection software described in our study can open the door to more routine analysis of these splicing phenomenon by the life-science community and support future analysis of RNA variant detection in cancer tissue.
Methods
Cells and reagents
All chemicals were obtained from Sigma Aldrich unless otherwise indicated. A375 cells were reported previously [Citation72]. The p53-specific gRNA sequence was 5ʹ-CTGAGCAGCGCTCATGGTGGNGG-3ʹ, and was used to develop the isogenic p53-null cell line as reported previously [Citation73]. A549 cells were described previously [Citation74]. The cell line from ATCC was cultured in DMEM (Gibco) + 10% FBS (Gibco) medium. Cells were split every 2 days, 0.05% Trypsin-EDTA (Gibco) was used to detach cells. The GI50 for cell growth inhibition for the splicing inhibitor Herboxidiene (Focus Biomolecules) [Citation50,Citation75,Citation76]. The anti-SBP tagged antibody was form IBA (Mouse, Monoclonal). The HRP-conjugated Anti-mouse (was PO260 from Dako) and the HRP-conjugated Anti-rabbit (was PO217 from Dako).
DNA and RNA sequencing
Exome Sequencing of DNA derived from A375 cells was performed using Agilent V5+ UTR Exome Capture Kit (75Mb) and 100 bp paired-end reads were acquired using a coverage of 100x (performed by Otogenetics, USA). The paired fastq files from the A375 cell line (available upon request) from exome sequencing were imported into the CLC Biomedical Genomics Workbench. Adaptor sequences and bases with low quality were trimmed, DNA sequencing reads were mapped to the human reference genome hg19. Adaptor sequences and bases with low quality were trimmed and reads were mapped to human genome 19 (hg19). Variants were detected in the exome data with the CLC Probabilistic Variant Caller using the following parameters: Minimum coverage (number of reads) = 5; Minimum frequency = 5%; Minimum number of variants = 2; Variants in normal germline DNA = 0, and the coverage in the germline DNA should be at least 5 reads at the variant site. Sequencing of RNA derived from both wt-p53 and p53-null A375 cell panel, untreated and treated with IFNγ (1 ng/ml for 24 hours), to generate biological replicates based on the common genomic DNA reference file from the parental A375 cell line, was performed using total RNA, depleted of ribosomal RNA, followed by random priming to generate cDNA. From this template paired-end Illumina HiSeq2500 was used to generate approximately 20 million reads. Paired fastq files (available upon request) from RNAseq reads were imported into the CLC Biomedical Genomics Workbench. The RNA sequencing reads were mapped to the human reference genome hg19. Paired de-multiplexed fastq files from RNAseq libraries were trimmed for stretches of adapter sequences, joined into a single read followed by quality trimming using commands from the CLC Assembly Cell. The fastq files were then imported into the CLC Biomedical Genomics Workbench (version 2.5). Sequences were mapped to the A375 cancer genome sequence where at least 2 mutant RNA reads were identified that do not match the reference genomic DNA.
MAP4K5 immunoprecipitation and SWATH-MS
A plasmid containing the MAP4KV569E gene was acquired from Addgene (Addgene plasmid # 23,611) and the gene was cloned in pEXPR-IBA105 vector containing Streptavidin Binding Peptide (SBP). The MAP4KV569E expression plasmid was subsequently mutagenized using the DpnI method [Citation77] to create a deletion of 3 base pairs (at codon 569) to obtain the MAP4K569del form (. The primers included; MAP4K5 cloning (F, with EcoRI restriction site): 5ʹ-GTCCCGAATTCGATGGAGGCCCCGCTG-3ʹ; MAP4K5 cloning (R, with BamHI restriction site): 5ʹ-CCCGGGGATCCCTTAGTAACTATTTTCATGTCCAGCCAAGAT3ʹ; MAP4K5 mutagenesis (F): 5ʹ-ATTATCAGGAAAAACCTTTCAGC-3ʹ; and MAP4K5 mutagenesis (R): 5ʹ-AGCTGAAAGGTTTTTCCTGATAAT-3ʹ. The MAP4K5 isoforms ( were transfected into A375 cells (as in and immunoprecipitation (IP) was carried out with the MAP4K5-expression vectors and the SBP empty vector (pEXPR-IBA105). Cells were transfected at about 70–80% of confluency using Attractene, harvested the next day, and lysed with Triton lysis buffer (100 mM KCl, 20 mM HEPES pH7.5, 1 mM EDTA, 1 mM EGTA, 0.5 mM Na3VO4, 10% glycerol, 0.5X Protease Inhibitor Mix, 10 mM NaF, 0.1% Triton x-100). 30 μl of streptavidin agarose conjugate beads (Millipore) was washed three times with 500 μl of PBS and lysate was added to the beads and incubated on a rotor wheel for 2 hours at room temperature. After the incubation, the sample was washed one time with 500 μl of Triton lysis buffer (without Triton x-100) and two times with 500 μl of PBS. Finally, the sample was eluted in 120 μl of elution buffer (8 M urea, 2 mM DTT and 20 mM HEPES pH 8) incubating at 85◦C for 5 min.
The lysates was processed by the method of FASP [Citation78] to obtain tryptic peptides. FASP-processed tryptic peptides from the streptavidin bead pull-down were separated on an Eksigent Ekspert nanoLC 400 (SCIEX, California, USA) online connected to a TripleTOF 5600+ (SCIEX, Toronto, Canada) mass spectrometer. Data acquisition was performed in technical triplicates. A cartridge trap column (300 μm i.d. × 5 mm) packed with a C18 PepMap100 sorbent with a 5 μm particle size (Thermo Fisher Scientific, Waltham, MA, USA) was used to concentrate and wash peptides. Peptides were washed in 0.05% trifluoroacetic acid in 5% acetonitrile and 95% water for 10 minutes. Following, peptides were separated using a gradient of acetonitrile/water (300nL/minute) on an analytical capillary emitter column PicoFrit® (75 μm × 210 mm (New Objective, Massachusetts, USA)) self-packed with ProntoSIL 120-3-C18 AQ sorbent with 3 µm particles (Bischoff, Leonberg, Germany). Analytical gradient was mixed from Mobile phase A composed from 0.1% (v/v) formic acid in water, and mobile phase B composed of 0.1% (v/v) formic acid in acetonitrile. Gradient elution started at 5% mobile phase B for the first 30 minutes and then the proportion of mobile phase B increased linearly up to 40%B for the following 120 minutes. Output from the separation column was directly coupled to an ion source (nano-electrospray).
The spectral library sample was prepared by pooling equal volume (10 µl) of all samples followed by data-dependent shotgun measurement in positive mode (IDA). Precursor range in MS was set from m/z 400 up to m/z 1250 while MS/MS spectra were acquired from m/z 200 up to m/z 1600. DIA method acquired and fragmented 20 the most intensive precursor ions in each cycle. Cycle time was 2.3 seconds. Once measured precursors were excluded for 12 seconds. Protein identification was performed using Protein Pilot 4.5 (SCIEX, Toronto, Canada) search engine. Acquired MS and MS/MS spectra were searched against Uniprot+Swissprot database (02. 2016, 69,987 entries) restricted to Homo sapiens taxonomy. Alkylation on cysteine using iodoacetamide as a fixed modification and digestion using trypsin was specified in the search engine. A decoy database was generated to perform FDR analysis. A spectral library was generated in Peakview 1.2.0.3 (SCIEX, Toronto, Canada) from DIA search files where only proteins with FDR below 1% were imported into the spectral library. SWATH measurements were operated in positive high sensitivity mode. Precursor ions spanning from m/z 400 up to m/z 1200 were measured in windowed manner. Precursor mass range was divided into 67 precursor windows with 12 Da width and 1 Da overlap. Accumulation time of 50 ms was set per each SWATH precursor window resulting in 3.0 seconds cycle time. Product ions mass range was set from m/z 400 up to m/z 1600. SWATH data extraction was performed in Peakview 1.2.0.3 (SCIEX, Toronto, Canada) with the spectral library. The retention time window for extraction was manually set to 10 minutes. Up to 4 peptides and 6 product ions per each peptide were used to quantitate each protein. Only non-modified high confidence peptides (peptide confidence>99%) were used for quantitation. Protein summed peak areas were determined from the sum of corresponding transition peak areas. Normalization was performed using the total area sums option in MarkerView 1.2.1.1 (SCIEX, Toronto, Canada). Extracted quantitative data from three technical replicates were statistically evaluated in MarkerView 1.2.1.1 (AB-SCIEX, Canada). Pairwise T-test was performed to determine protein fold changes and P values of fold change for all proteins listed in the spectral library.
Pladienolide B and Herboxidiene treatment
A549 cells were treated with Pladienolide B (10 or 100 nM) or Herboxidiene (5 or 10 nM) dissolved in full-medium for 24 and 48 hours (Pladienolide B) or for 48 and 72 hours (Herboxidiene). Control samples contained DMSO alone. After treatment, cells were harvested and total RNA was extracted. RNA was isolated from cells using Universal RNA Purification kit (EURex, cat no. E3598), according to the manufacturer’s protocol. The RNA concentration was measured with the use of NanoReady (Life Real) device. Reverse transcription was performed in 20 µl reaction volume, with the use of High Capacity cDNA Reverse Transcription Kit (REF: 4,368,814, Thermo Fisher Scientific), according to the manufacturer’s protocol. 500ng of RNA was used for this reaction.
PCR amplification and purification
Amplification of MAP4K5 fragment was performed using Phusion High-Fidelity DNA Polymerase kit (Thermo Fisher Scientific) using 100 ng cDNA as a template and subsequent primer sequences: M4K5e23F: TCCACGGAAGTGTACTTGGC; M4K5e26R: TCCAGACTGTAAAGCTCCACA. The thermal cycler program for MAP4K5 gene amplification was as follows: 1. Denaturation: 95°C, 3 min; 2. Denaturation: 98°C, 20 sec; 3. Annealing: 60°C, 15 sec; 4. Elongation: 72°C, 20 sec; Steps 2–4 were repeated 29 times.; 5. Elongation: 72°C, 2 min; and 6. Hold: 4°C, Inf.
Amplification of CDK13 fragment was performed using Phusion MM in HF buffer kit (Thermo Fisher Scientific) using 100 ng cDNA as a template and primer sequences for the 1st PCR reaction: CDK13 F3.3: GAGATGGCCAGGATCTGAC; CDK13 R1: GTGGAATACGAGGATGTGAGC. As a template for the 2nd PCR reaction 100 ng of purified (with the use of QIAquick PCR Purification Kit (QIAGEN)) product from the 1st PCR was used and the primer sequences were as follows: CDK13 F1: CTGCTCTTCCTGGCTGCTC and CDK13 R2: CAGGAGGCGGAGAAGCGTC. The thermal cycler program for both PCR reactions was as follows: for the 1st PCR: 1. Denaturation: 98°C, 2 min; 2. Denaturation: 98°C, 45 sec; 3. Annealing: 63°C, 30 sec; 4. Elongation: 72°C, 30 sec; Steps 2–4 were repeated 10 times.; 5. Elongation: 72°C, 10 min; and 6. Hold: 4°C, Inf.; for 2nd PCR: 1. Denaturation: 98°C, 2 min; 2. Denaturation: 98°C, 45 sec; 3. Annealing: 61°C, 30 sec; 4. Elongation: 72°C, 30 sec; Steps 2–4 were repeated 25 times.; 5. Elongation: 72°C, 10 min; and 6. Hold: 4°C, Inf.
The PCR products were visualized on 1.5% agarose gel with the use of 1kb Gene Ruler (Thermo Fisher Scientific). The purification of PCR products was performed using NucleoSpin Gel and PCR Clean-up kit (Macherey-Nagel) and the concentration of purified PCR products was measured on Nanodrop or NanoReady device. Purified PCR products were sequenced to the Eurofins company. The results (chromatograms) were visualized in Chromas v2.6.6.
Supplemental Material
Download Zip (8.6 MB)Acknowledgments
The work was partially supported by the International Centre for Cancer Vaccine Science project carried out within the International Research Agendas Programme of the Foundation for Polish Science co-financed by the European Union under the European Regional Development Fund [MAB/2017/3], the Wellcome Trust (grant number 094417/Z/10/Z), and the BBSRC RASOR consortium (BB/C511599/1; UK). BV was supported by the European Regional Development Fund - Project ENOCH (No.CZ.02.1.01/0.0/0.0/16_019/0000868) and by the Ministry of Health Development of Research Organization, MH CZ - DRO (MMCI, 00209805).
Disclosure Statement
No potential conflict of interest was reported by the author(s).
Supplementary material
Supplemental data for this article can be accessed here.
Related Research Data
References
- Gillette MA, Satpathy S, Cao S, et al. Clinical proteomic tumor analysis, proteogenomic characterization reveals therapeutic vulnerabilities in lung Adenocarcinoma. Cell. 2020;182:200–225 e235.
- McDermott JE, Arshad OA, Petyuk VA. et al. Clinical tumor analysis, proteogenomic characterization of ovarian HGSC implicates mitotic kinases, replication stress in observed chromosomal instability. 2020;1. Cell Rep Med
- Dou Y, Kawaler EA, Zhou DC, et al. Clinical proteomic tumor analysis, proteogenomic characterization of endometrial carcinoma. Cell. 2020;180(4):729–748 e726. .
- Binetti M, Lauro A, Vaccari S, et al. Proteogenomic biomarkers in colorectal cancers: clinical applications. Expert Rev Proteomics. 2020;17(5):355–363.
- Clark DJ, Dhanasekaran SM, Petralia F, et al. Clinical proteomic tumor analysis, integrated proteogenomic characterization of clear cell renal cell carcinoma. Cell. 2020;180(1):207. .
- Calinawan AP, Song X, Ji J, et al. ProTrack: an interactive Multi-Omics data browser for proteogenomic studies. Proteomics. 2020;20(21–22):e1900359.
- Alexandrov LB, Jones PH, Wedge DC, et al. Clock-like mutational processes in human somatic cells. Nat Genet. 2015;47(12):1402–1407.
- Nik-Zainal S, Kucab JE, Morganella S, et al. The genome as a record of environmental exposure. Mutagenesis. 2015;30(6):763–770.
- An B, Pan T, Hu J, et al. The discovery of a potent and selective third-generation EGFR kinase inhibitor as a therapy for EGFR L858R/T790M double mutant non-small cell lung cancer. Eur J Med Chem. 2019;183:111709.
- Piper-Vallillo AJ, Sequist LV, Piotrowska Z. Emerging treatment paradigms for EGFR-Mutant lung cancers progressing on Osimertinib: a review. J Clin Oncol. 2020;JCO1903123. doi: https://doi.org/10.1200/JCO.19.03123. Online ahead of print.
- Yadav M, Jhunjhunwala S, Phung QT, et al. Predicting immunogenic tumour mutations by combining mass spectrometry and exome sequencing. Nature. 2014;515(7528):572–576.
- Schumacher T, Bunse L, Pusch S, et al. A vaccine targeting mutant IDH1 induces antitumour immunity. Nature. 2014;512(7514):324–327.
- Carreno BM, Magrini V, Becker-Hapak M, et al. Cancer immunotherapy. A dendritic cell vaccine increases the breadth and diversity of melanoma neoantigen-specific T cells. Science. 2015;348(6236):803–808.
- Schlake T, Thess A, Fotin-Mleczek M, et al. Developing mRNA-vaccine technologies. RNA Biol. 2012;9(11):1319–1330.
- Colloca S, Barnes E, Folgori A, et al. Vaccine vectors derived from a large collection of simian adenoviruses induce potent cellular immunity across multiple species. Sci Transl Med. 2012;4(115):115ra112. .
- Leoni G, D’Alise AM, Cotugno G, et al. A genetic vaccine encoding shared cancer neoantigens to treat tumors with microsatellite instability. Cancer Res. 2020;80(18):3972–3982. .
- Zhang B, Wang J, Wang X, et al. Proteogenomic characterization of human colon and rectal cancer. Nature. 2014;513(7518):382–387. .
- Noorani A, Li X, Goddard M, et al. Genomic evidence supports a clonal diaspora model for metastases of esophageal adenocarcinoma. Nat Genet. 2020;52(1):74–83. .
- Ruggles KV, Krug K, Wang X, et al. Methods, tools and current perspectives in proteogenomics. Mol Cell Proteomics. 2017;16(6):959–981.
- Apcher S, Daskalogianni C, Fahraeus R. Pioneer translation products as an alternative source for MHC-I antigenic peptides. Mol Immunol. 2015;68(2):68–71.
- Zhang M, Fritsche J, Roszik J, et al. RNA editing derived epitopes function as cancer antigens to elicit immune responses. Nat Commun. 2018;9(1):3919. .
- Chen X, Nagai Y, Zhu Z, et al. A spliced form of CD44 expresses the unique glycan that is recognized by the prostate cancer specific antibody F77. Oncotarget. 2018;9(3):3631–3640.
- Krasnov GS, Dmitriev AA, Kudryavtseva AV, et al. PPLine: an automated pipeline for SNP, SAP, and splice variant detection in the context of proteogenomics. J Proteome Res. 2015;14(9):3729–3737.
- Jagtap P, Goslinga J, Kooren JA, et al. A two-step database search method improves sensitivity in peptide sequence matches for metaproteomics and proteogenomics studies. Proteomics. 2013;13(8):1352–1357.
- Choi S, Ju S, Lee J, et al. Proteogenomic Approach to UTR Peptide Identification. J Proteome Res. 2020;19(1):212–220.
- Faktor J, Grasso G, Vojtesek V, et al. The effects of p53 gene deletion on mutant proteome expression. BBA General Subjects. 2020;1864(12):129722. doi: https://doi.org/10.1016/j.bbagen.2020.129722. Online ahead of print.
- Knutson SD, Heemstra JM. EndoVIPER-seq for improved detection of A-to-I Editing sites in cellular RNA. Curr Protoc Chem Biol. 2020;12(2):e82.
- Picardi E, D’Erchia AM, Lo Giudice C, et al. REDIportal: a comprehensive database of A-to-I RNA editing events in humans. Nucleic Acids Res. 2017;45(D1):D750–D757.
- Schaffer AA, Kopel E, Hendel A, et al. The cell line A-to-I RNA editing catalogue. Nucleic Acids Res. 2020;48(11):5849–5858.
- Lo Giudice C, Tangaro MA, Pesole G, et al. Investigating RNA editing in deep transcriptome datasets with REDItools and REDIportal. Nat Protoc. 2020;15(3):1098–1131.
- Lo Giudice C, Pesole G, Picardi E. REDIdb 3.0: a comprehensive collection of RNA editing events in plant organellar genomes. Front Plant Sci. 2018;9:482.
- Ramaswami G, Li JB. RADAR: a rigorously annotated database of A-to-I RNA editing. Nucleic Acids Res. 2014;42(D1):D109–113.
- Brenner WG, Mader M, Muller NA, et al. High level of conservation of mitochondrial RNA editing sites among four populus species. G3 (Bethesda). 2019;9(3):709–717.
- Zhou ZY, Hu Y, Li A, et al. Genome wide analyses uncover allele-specific RNA editing in human and mouse. Nucleic Acids Res. 2018;46(17):8888–8897.
- Forbes C. Microcomputer programs for mutation studies using the Fisher exact test or the binomial approximation. Mutat Res. 1984;141(3–4):205–210.
- Niavarani A, Currie E, Reyal Y, et al. APOBEC3A is implicated in a novel class of G-to-A mRNA editing in WT1 transcripts. PLoS One. 2015;10(3):e0120089.
- Castandet B, Araya A. RNA editing in plant organelles. Why make it easy? Biochemistry (Mosc). 2011;76(8):924–931.
- Tassinari V, Cesarini V, Silvestris DA, et al. MicroRNA editing detection and function: a combined in silico and experimental approach for the identification and validation of putative oncogenic targets. Methods Mol Biol. 2021;2181:253–267.
- Yuting K, Ding D, Iizasa H. Adenosine-to-Inosine RNA Editing Enzyme ADAR and microRNAs. Methods Mol Biol. 2021;2181:83–95.
- Dong X, Chen G, Cai Z, et al. CDK13 RNA Over-Editing mediated by ADAR1 associates with poor prognosis of hepatocellular carcinoma patients. Cell Physiol Biochem. 2018;47(6):2602–2612.
- Li W, Lynch M. Universally high transcript error rates in bacteria. Elife. 2020;9:e54898.
- Ma X, Shao Y, Tian L, et al. Analysis of error profiles in deep next-generation sequencing data. Genome Biol. 2019;20(1):50.
- Chepelev I. Detection of RNA editing events in human cells using high-throughput sequencing. Methods Mol Biol. 2012;815:91–102.
- Maas S, Godfried Sie CP, Stoev I, et al. Genome-wide evaluation and discovery of vertebrate A-to-I RNA editing sites. Biochem Biophys Res Commun. 2011;412(3):407–412.
- Even Y, Escande ML, Fayet C, et al. CDK13, a Kinase involved in Pre-mRNA splicing, is a component of the perinucleolar compartment. PLoS One. 2016;11(2):e0149184.
- Even Y, Durieux S, Escande ML, et al. CDC2L5, a Cdk-like kinase with RS domain, interacts with the ASF/SF2-associated protein p32 and affects splicing in vivo. J Cell Biochem. 2006;99(3):890–904.
- Liang K, Gao X, Gilmore JM, et al. Characterization of human cyclin-dependent kinase 12 (CDK12) and CDK13 complexes in C-terminal domain phosphorylation, gene transcription, and RNA processing. Mol Cell Biol. 2015;35(6):928–938.
- Kim HE, Kim DG, Lee KJ, et al. Frequent amplification of CENPF, GMNN and CDK13 genes in hepatocellular carcinomas. PLoS One. 2012;7(8):e43223.
- Ansari D, Andersson R, Bauden MP, et al. Protein deep sequencing applied to biobank samples from patients with pancreatic cancer. J Cancer Res Clin Oncol. 2015;141(2):369–380.
- Cretu C, Agrawal AA, Cook A, et al. Structural basis of splicing modulation by antitumor macrolide compounds. Mol Cell. 2018;70(2):265–273 e268.
- Sharapov MG, Gudkov SV. Peroxiredoxin 1 - Multifunctional antioxidant enzyme, protects from oxidative damages and increases the survival rate of mice exposed to total body irradiation. Arch Biochem Biophys. 2021;697:108671.
- Hanzelmann P, Stingele J, Hofmann K, et al. The yeast E4 ubiquitin ligase Ufd2 interacts with the ubiquitin-like domains of Rad23 and Dsk2 via a novel and distinct ubiquitin-like binding domain. J Biol Chem. 2010;285(26):20390–20398.
- Hanahan D, Weinberg RA. Hallmarks of cancer: the next generation. Cell. 2011;144(5):646–674.
- Alexandrov LB, Kim J, Haradhvala NJ, et al., . Consortium, The repertoire of mutational signatures in human cancer. Nature. 2020;578(7793):94–101.
- Tyanova S, Temu T, Cox J. The MaxQuant computational platform for mass spectrometry-based shotgun proteomics. Nat Protoc. 2016;11(12):2301–2319.
- Gorshkov V, Verano-Braga T, Kjeldsen F. SuperQuant: a data processing approach to increase quantitative proteome coverage. Anal Chem. 2015;87(12):6319–6327.
- Do Valle IF, Giampieri E, Simonetti G, et al. Optimized pipeline of MuTect and GATK tools to improve the detection of somatic single nucleotide polymorphisms in whole-exome sequencing data. BMC Bioinformatics. 2016;17(S12):341.
- Cai L, Yuan W, Zhang Z, et al. In-depth comparison of somatic point mutation callers based on different tumor next-generation sequencing depth data. Sci Rep. 2016;6(1):36540.
- Hedegaard J, Thorsen K, Lund MK, et al. Next-generation sequencing of RNA and DNA isolated from paired fresh-frozen and formalin-fixed paraffin-embedded samples of human cancer and normal tissue. PLoS One. 2014;9(5):e98187.
- Wang W, Ma L, Becher H, et al. Astonishing 35S rDNA diversity in the gymnosperm species Cycas revoluta Thunb. Chromosoma. 2016;125(4):683–699.
- Sujeeth N, Mehterov N, Gupta S, et al. A novel seed plants gene regulates oxidative stress tolerance in Arabidopsis thaliana. Cell Mol Life Sci. 2020;77(4):705–718.
- Roberts SA, Sterling J, Thompson C, et al. Clustered mutations in yeast and in human cancers can arise from damaged long single-strand DNA regions. Mol Cell. 2012;46(4):424–435.
- Yeh YS, Chang YT, Ma CJ, et al. First-decade patient with colorectal cancer carrying both germline and somatic mutations in APC gene. BMC Cancer. 2017;17(1):849.
- Chen TC, Liu YC, Wang X, et al. Whole plastid transcriptomes reveal abundant RNA editing sites and differential editing status in Phalaenopsis aphrodite subsp. formosana. Bot Stud. 2017;58(1):38.
- Villarreal AJ, Turmel M, Bourgouin-Couture M, et al. Genome-wide organellar analyses from the hornwort Leiosporoceros dussii show low frequency of RNA editing. PLoS One. 2018;13(8):e0200491.
- Faktor J, Grasso G, Zavadil Kokas F, et al. The effects of p53 gene inactivation on mutant proteome expression in a human melanoma cell model. Biochim Biophys Acta Gen Subj. 2020;1864(12):129722.
- Valdmanis PN, Roy-Chaudhuri B, Kim HK, et al. Upregulation of the microRNA cluster at the Dlk1-Dio3 locus in lung adenocarcinoma. Oncogene. 2015;34(1):94–103.
- Yamanaka S, Balestra ME, Ferrell LD, et al. Apolipoprotein B mRNA-editing protein induces hepatocellular carcinoma and dysplasia in transgenic animals. Proc Natl Acad Sci U S A. 1995;92(18):8483–8487.
- John D, Weirick T, Dimmeler S, et al. RNAEditor: easy detection of RNA editing events and the introduction of editing islands. Brief Bioinform. 2017;18(6):993–1001.
- Guo L, Liu CM. A single-nucleotide exon found in Arabidopsis. Sci Rep. 2015;5(1):18087.
- Irimia M, Weatheritt RJ, Ellis JD, et al. A highly conserved program of neuronal microexons is misregulated in autistic brains. Cell. 2014;159(7):1511–1523.
- Blaydes JP, Luciani MG, Pospisilova S, et al. Stoichiometric phosphorylation of human p53 at Ser315 stimulates p53-dependent transcription. J Biol Chem. 2001;276(7):4699–4708.
- Li R, Zatloukalova P, Muller P, et al. The MDM2 ligand Nutlin-3 differentially alters expression of the immune blockade receptors PD-L1 and CD276. Cell Mol Biol Lett. 2020;25(1):41.
- Gray TA, Alsamman K, Murray E, et al. Engineering a synthetic cell panel to identify signalling components reprogrammed by the cell growth regulator anterior gradient-2. Mol Biosyst. 2014;10(6):1409–1425.
- Teng T, Tsai JH, Puyang X, et al. Splicing modulators act at the branch point adenosine binding pocket defined by the PHF5A-SF3b complex. Nat Commun. 2017;8(1):15522.
- Siebring-van Olst E, Blijlevens M, De Menezes RX, et al. A genome-wide siRNA screen for regulators of tumor suppressor p53 activity in human non-small cell lung cancer cells identifies components of the RNA splicing machinery as targets for anticancer treatment. Mol Oncol. 2017;11(5):534–551.
- Forloni M, Liu AY, Wajapeyee N. Multisite-Directed Mutagenesis. Cold Spring Harb Protoc. 2019;2019(12). DOI:https://doi.org/10.1101/pdb.prot097816
- Wisniewski JR, Zougman A, Mann M. Combination of FASP and StageTip-based fractionation allows in-depth analysis of the hippocampal membrane proteome. J Proteome Res. 2009;8(12):5674–5678.
- Zhu Y, Luo H, Zhang X, et al. Abundant and selective RNA-Editing events in the medicinal mushroom Ganoderma lucidum. Genetics. 2014;196(4):1047–1057.