
ABSTRACT
Similar to other RNA viruses, the emergence of Betacoronavirus relies on cross-species viral transmission, which requires careful health surveillance monitoring of protein-coding information as well as genome-wide analysis. Although the evolutionary jump from natural reservoirs to humans may be mainly traced-back by studying the effect that hotspot mutations have on viral proteins, it is largely unexplored if other impacts might emerge on the structured RNA genome of Betacoronavirus. In this survey, the protein-coding and viral genome architecture were simultaneously studied to uncover novel insights into cross-species horizontal transmission events. We analysed 1,252,952 viral genomes of SARS-CoV, MERS-CoV, and SARS-CoV-2 distributed across the world in bats, intermediate animals, and humans to build a new landscape of changes in the RNA viral genome. Phylogenetic analyses suggest that bat viruses are the most closely related to the time of most recent common ancestor of Betacoronavirus, and missense mutations in viral proteins, mainly in the S protein S1 subunit: SARS-CoV (G > T; A577S); MERS-CoV (C > T; S746R and C > T; N762A); and SARS-CoV-2 (A > G; D614G) appear to have driven viral diversification. We also found that codon sites under positive selection on S protein overlap with non-compensatory mutations that disrupt secondary RNA structures in the RNA genome complement. These findings provide pivotal factors that might be underlying the eventual jumping the species barrier from bats to intermediate hosts. Lastly, we discovered that nearly half of the Betacoronavirus genomes carry highly conserved RNA structures, and more than 90% of these RNA structures show negative selection signals, suggesting essential functions in the biology of Betacoronavirus that have not been investigated to date. Further research is needed on negatively selected RNA structures to scan for emerging functions like the potential of coding virus-derived small RNAs and to develop new candidate antiviral therapeutic strategies.
Introduction
Concerning a wide range of potential pathogens that are involved in cross-species transmissions, RNA viruses are a serious concern [Citation1]. The sudden disease outbreak in 2019 (COVID-19), caused by the novel Severe Acute Respiratory Syndrome Coronavirus 2 (SARS-CoV-2), has recently emerged as a public health priority [Citation2,Citation3]. SARS-CoV-2, Severe Acute Respiratory Syndrome Coronavirus (SARS-CoV), and Middle East Respiratory Syndrome Coronavirus (MERS-CoV), are members of the Betacoronavirus (Beta-CoVs) genus [Citation4]. They carry a large (~30 kb) positive-sense, single-stranded RNA (+ ssRNA) genome capped at the 5′ end and poly-A tail. ORF1a and ORF1b are translated from genomic RNA, and the translation of ORF1b depends on ribosomal frameshifting element (FSE) at the end of ORF1a. In contrast, the remaining genome serves as a template to produce subgenomic RNAs (sgRNAs) from the 3′ end, which are subsequently capped and translated into structural and accessory proteins [Citation5,Citation6]. It has been proven that Beta-CoVs are prone to accumulate mutations, owing to poor fidelity of RNA polymerases, making these viral populations typically contain genetic variants that form a heterogeneous virus pool, named quasispecies [Citation7,Citation8]. This phenomenon is considered to drive cross-species transmission and contributes to a rapid adaptation over a wide range of diverse hosts.
Beta-CoVs are zoonotic pathogens originating from animals and may be transmitted to humans by direct contact. A growing body of phylogenetic analysis has identified bats as the evolutionary sources of SARS-CoV, MERS-CoV, and the recent SARS-CoV-2 [Citation9–11]. In addition, the majority of these viruses depend on an intermediate animal host to invade human cells [Citation12–14]. Although the molecular mechanisms enabling cross-species transmission are not well elucidated, it has been proven that essential proteins under selection tend to increase viral fitness, and repeated transmissions may hasten novel strain emergence [Citation15,Citation16]. A hallmark is traced back to the receptor-binding domain (RBD) of the spike (S) protein, where amino acid changes for SARS-CoV and SARS-CoV-2 mediate invasion of host cells by binding to angiotensin-converting enzyme 2 (ACE2) [Citation17], whereas MERS-CoV exploits dipeptidyl peptidase-4 (DPP4) [Citation18]. Therefore, it is suggested that this protein has been under intense evolutionary pressures, which might be implied on propagation of Beta-CoVs. However, there are many studies on this topic motivated by developing vaccines and therapeutic strategies to prevent further spillover, relying on molecular processes reflected on protein sequence [Citation9,Citation19,Citation20]. Since Beta-CoVs have RNA genomes, it is interesting to explore how its genome is folded and to what extent a mutation might disturb its stability. Such insights would provide novel ideas for studying the evolution, adaptation, and cross-species barriers of Beta-CoVs.
RNA structures are broadly accepted as critical modulators in regulating transcription, translation, and replication in Beta-CoVs as well as other RNA viruses [Citation21–24]. Despite their importance, only a handful of functionally conserved structural RNA elements have been identified across Beta-CoVs, mainly located in the 5′ and 3′ untranslated regions (UTR) and in the FSE [Citation25,Citation26]. Still, the majority of regions in the whole genome of Beta-CoVs have been largely unexplored [Citation27,Citation28]. Even though predicting conserved and non-conserved RNA structures in viral genomes is challenging, upon estimation of structures, the apparent natural simplicity of an RNA secondary structure promises to be useful in describing selection pressures acting on the interactions of paired and unpaired bases [Citation29]. A conserved structure implies compensatory substitutions (e.g. GC → CG or AU → UA), maintaining the patterns of paired bases, which indicate negative selection. Conversely, substitution events that disrupt paired bases (e.g. GC → AU or CG → UA) lead to relaxed structure constraints, which represent a positive selection [Citation29–31]. This selection concept is not different from synonymous and non-synonymous substitutions that occur on protein-coding sequence subsets (CDS). However, codons occur locally on sequence and the selection effect is observed downstream at protein stability level, while selection on RNA secondary structure is directly seen on the RNA viral genome itself [Citation31]. This means that by exploiting positive and negative evolutionary information predicted on an RNA structure, we may be a step closer towards characterizing how structurally conserved RNAs have evolved in different hosts of Beta-CoVs.
Considering the extraordinary plasticity of Beta-CoVs that allows its adaptation to diverse host species prior to cross-barrier transmission to humans [Citation32], recent efforts in genomic surveillance and therapeutical design are centred on a systematic approach to detect novel variants in human hosts. However, these approaches exclude domestic animals found closely in contact with wild reservoirs and humans. In this work, a detailed evolutionary framework to estimate selection pressures on the genomic architecture of SARS-CoV, MERS-CoV and SARS-CoV-2 was used to develop a landscape of events tracing back to cross-species horizontal transmission spillovers from an exhaustive genome-wide analysis of Beta-CoVs circulating in different bat species, intermediate animals, and human hosts across the globe until May 2021. These analyses provide novel insights into molecular signatures applied to surveillance systems for detecting an eventual jump of these emerging viruses in advance.
Material and methods
Data collection
An exhaustive meta-search of Beta-CoVs genome sequences was performed using the following inclusion criteria: i) complete genomes; ii) high coverage level; and iii) unique sequences in the National Center for Biotechnology Information Virus (NCBI Virus) [Citation33], Virus Pathogen Database and Analysis Resource (ViPR) [Citation34] and ViruSurf [Citation35]. As a supplement, the Global Initiative on Sharing All Influenza Data (GISAID) [Citation36] to retrieve further information of SARS-CoV-2 was exploited (May 2021). Datasets were constructed from a variety of hosts for each Beta-CoV, labelling sequences into three groups as follows: i) Bat (natural host), all sequences reported in Chiroptera order; ii) Intermediate (intermediate host), all sequences defined in Mammalia class; and iii) Human (amplifier host), which included Homo sapiens species.
Information preparation and curation
We conducted a meticulous preparation and curation of the data. This process involves several stages, namely: i) all viral sequences labelled as bat, intermediate and human host species were filtered out to detect any possible ambiguous characters (W, S, K, M, Y, R, V, H, D, B, N, -, =); ii) simultaneously to the previous process, it was compared sequence by sequence for each host across different sets of data retrieved from the databases, removing those with 100% similarity and keeping the longest representative sequence; iii) then the resulting sequences were sorted and fitted to reference lengths of SARS-CoV (NC_004718), MERS-CoV (NC_019843), and SARS-CoV-2 (NC_045512), containing 29,751 bp, 30,119 bp, and 29,903 bp in length, respectively; and iv) finally, to confirm a non-redundant data set, the Cluster Database at High Identity with Tolerance (CD-HIT; v4.8.1) software was used [Citation37]. Given the large number of SARS-CoV-2 sequences circulating in humans, a threshold >0.99 was used with CD-HIT. It is worth mentioning that this careful curation method is paramount to avoid any possible ambiguous character affecting the RNA structure analysis and prediction.
Alignments and retrieve metadata
The host’s full-length viral sequences were aligned with the default parameters using Clustal-Omega (v1.2.4) [Citation38]. Multiple sequence alignments (MSA) were manually visualized, analysed, annotated, and edited with Aliview (v1.27) [Citation39]. Once the datasets were curated, we retrieved for each sequence of SARS-CoV and MERS-CoV: i) associated host scientific name, ii) GenBank accession number, iii) collection date, iv) region, v) country, vi) length, and vii) collection source. Further data for SARS-CoV-2 were retrieved as follows: viii) GISAID accession number, ix) PANGO lineage and x) corresponding clade. Information not reported in databases was sought it through literature review.
Prediction of viral open reading frames
The characterization of putative Open Reading Frames (ORFs) was performed through a modification of Gene prediction by Open reading Frame Identification using X motifs (GOFIX) program [Citation40] using the MSA for each host. Then, ORFs were validated using BLASTN (v2.11.0) [Citation41] from the referenced genomes of SARS-CoV, MERS-CoV, and SARS-CoV-2.
Single nucleotide variant identification
For all downstream analysis, each host group’s data was concatenated and re-aligned with Clustal-Omega (v1.2.4) [Citation38], resulting into a unique dataset for SARS-CoV, MERS-CoV, and SARS-CoV-2. This analysis aimed to highlight naturally possible occurring variants in Beta-CoVs populations. To identify variations in viral sequences, we used the Microbial Genomics Mutation Tracker software package (MicroGMT; v1.4) [Citation42]. This package mainly uses Minimap2 (v2.21) [Citation43] and Bcftools (v1.13) [Citation44] to map individual sequences against the reference of SARS-CoV (NC_004718), MERS-CoV (NC_019843), and SARS-CoV-2 (NC_045512) and provides the results in a Variant Call Format (VCF) table. In addition, the program uses the SnpEff (v5.0e) tool (http://pcingola.github.io/SnpEff/) [Citation45] to characterize all mutations detected at both nucleotide and amino acid levels in the whole viral genome. The annotated data were imported, manipulated, and plotted using R (v4.1.0) [Citation46]. Tidyverse package (v1.3.1) [Citation47] was used to filter, summarize and annotate data, while ggplot2 package (v3.3.5) [Citation48] was used to align the identified variants and visualize the types of mutations.
Time-scaled phylogenetic analysis
Full-length nucleotide sequences from each Beta-CoV dataset were aligned based on codons and then translated into nucleotide alignments using a combination of Clustal-Omega (v1.2.4) [Citation38] and TranslatorX [Citation49]. Time-scaled phylogenies for whole viral genomes were analysed through Bayesian Inference (BI) with Markov chain Monte Carlo (MCMC) methods using Bayesian Evolutionary Analysis Sampling Trees (BEAST) (v1.10.4) [Citation50] on the CIPRES Science Gateway (v3.3) server (https://www.phylo.org/) [Citation51]. BEAGLE (v4.0) library to enhance the speed of probability computations was used [Citation52]. The statistical selection for the best-fit model of nucleotide substitution was performed with jModelTest (v2.1.10) [Citation53] and Analysis of Phylogenetics and Evolution (APE) (v5.5) [Citation54] implemented in R, considering the Bayesian information criterion (BIC). For each Beta-CoV dataset, we employed the tip-dating method under a General Time-Reverse model along with gamma distributed rates across invariable sites (GTR+Г + I). We ran Bayesian phylogenetic analyses using various clock model combinations (a strict clock and an uncorrelated relaxed clock with log-normal distribution (UCLN) [Citation55]) and coalescent tree priors (constant size). The length of MCMC chain was run for 300 million steps, and the log parameter values were sampled at every 30,000 steps. Convergence of parameters was evaluated with Tracer (v1.7.132) [Citation56], by inspecting the Effective Sample Sizes (ESS > 200), and the degree of uncertainty in each parameter estimate was provided by the 95% of Height Posterior Density (HPD) values. Trees were summarized as maximum-clade credibility (MCC) trees using Tree annotator (v1.10.0) after discarding 10% as burn-in and then visualized in FigTree (v1.4.4).
Inference of selective pressures on protein-coding
Selective pressure analysis was performed on the CDSs for SARS-CoV, MERS-CoV, and SARS-CoV-2 through Datamonkey Adaptive Evolution Server 2.0 (https://www.datamonkey.org/) [Citation57]. For sites statistically significant showing a positive value of non-synonymous to synonymous substitutions dN/dS >1, diversifying (positive) selection is inferred, whereas purifying (negative) selection is inferred when dN/dS <1 and neutrality as dN/dS = 1 [Citation58]. These codon sites were analysed with a combination of four methods: i) Single-Likelihood Ancestor Counting (SLAC) [Citation59]; ii) Fixed Effects Likelihood (FEL) [Citation59]; iii) Fast, Unconstrained Bayesian AppRoximation (FUBAR) [Citation60]; and iv) Mixed Effects Model of Evolution (MEME) [Citation61]. SLAC, FEL, and FUBAR were used to identify sites that experienced both positive and negative selection, while MEME was used to detect sites that experienced positive selection [Citation62]. We detect codon sites with positive selection signals if a specific site is overlapped by the four methods, while those with negative selection were selected from SLAC, FEL and FUBAR. Sites with a p-value <0.05 (SLAC, FEL and MEME) and a Bayesian posterior probability >0.95 (FUBAR) were considered statistically significant.
Prediction of conserved RNA structures
To analyse the genomic architecture of Beta-CoVs, we employed the MSA from each host, which was screened in windows with a length of 120 nucleotides sliding by 40 nucleotides using RNAz v2.1 [Citation63]. The RNAz method uses the RNAfold algorithm via RNA Vienna package to calculate secondary structures and Minimum Free Energy (MFE) for individual sequences. In addition, RNAz estimates three measures of structure conservation: i) the MFE z-score for each sequence, ii) the average MFE z-score across all sequences, and iii) the structure conservation index (SCI) of the entire alignment. Based on these criteria, RNAz determines a classification value designated as P class (P), indicating the probability for a particular region carrying a structure. We considered RNA structures with the following parameters: i) – no-reference; ii) – both-strands (±); iii) P > 0.9; and iv) – no-shuffle. As a result, RNAz hits at loci corresponding to regions with RNA structures. Therefore, the most representative structures for each host were filtered using P > 0.98 and z < −3. Lastly, these structured regions of Beta-CoV genomes were exploited to assess relevant RNA structures which were common, shared, or unique across the three hosts throughout its evolutionary trajectory.
Inference of selective pressures on RNA structure
Selective pressures on RNA structures were statistically evaluated using the SSS-test (v1.0) [Citation31] with default parameters. Scores were retrieved, imported and manipulated with tidyverse package (v1.3.1), implemented in R (v4.1.0). The constraints on RNA structures were selected following the thresholds adopted by [Citation31]: i) s ≤ 2.99: negative selection; ii) s ≤ 4.99: weak selection; iii) s ≤ 9.99: moderate selection; and iv) s ≥ 10.0: positive selection.
Statistics
To test whether synonymous and missense mutations detected in viruses collected from bats overperform to other host species, we carried out a two-way Analysis of Variance (ANOVA) followed by a Tukey–Kramer test using the R environment (v4.1.0) [Citation46]. A p-value lower than 0.05 (p < 0.05) was considered as statistically significant.
Results
SARS-CoV-2 sequences from humans appear to have highly ambiguous bases
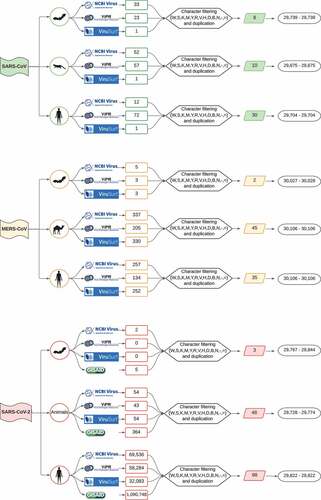
A total of 1,252,952 raw genomic sequences were retrieved. Among them, 253 were from SARS-CoV, followed by 1,526 MERS-CoV and 1,251,173 SARS-CoV-2, which constituted 0.02%, 0.12% and 99.8% of all data, respectively (Supplementary Table S1). provides a flowchart illustrating the workflow followed to retrieve, filter, and construct datasets for downstream analyses. Clearly, we obtained a larger number of SARS-CoV-2 sequences owing to the impact of the extensive surveillance genomic monitoring volume. Nevertheless, upon the curation of these sequences and, particularly, those isolated from humans, we detected a vast number of sequences with highly ambiguous bases, which needed to be removed given requirements for RNA structure analysis.
Figure 1. Flowchart showing approach to data collection, curation process and range of sequence lengths for the three Beta-CoVs analysed. First, raw viral sequences are retrieved from NCBI Virus, ViPR, ViruSurf (SARS-CoV and MERS-CoV), and further GISAID (SARS-CoV-2). Afterwards, data are labelled by host and, upon careful filtering and curation methods, the most representative viral sequences comprising each non-redundant host dataset.
ORF8 is a rapidly evolving region in SARS-CoV
Next, we predicted the ORFs for each viral genome, highlighting that non-structural (ORF1a, ORF1b) and structural proteins (S, E, M, N) are highly conserved in Beta-CoVs (Supplementary Fig. S1). SARS-CoV showed 15 potential ORFs bounded by start and stop codons. Interestingly, SARS-CoV sequences isolated from humans contained a 29 nucleotide deletion in the middle of ORF8, resulting in the splitting of ORF8 into two smaller ORFs, namely ORF8a and ORF8b (Supplementary Fig. S1A). Annotation of the MERS-CoV genomes identified 11 ORFs (Supplementary Fig. S1B), whereas SARS-CoV-2, 14 ORFs in the three hosts to be conserved (Supplementary Fig. S1C). Further information on each predicted ORF with the GOFIX method is provided in Supplementary Table S2.
Synonymous and missense mutations are predominant in bat viral genomes
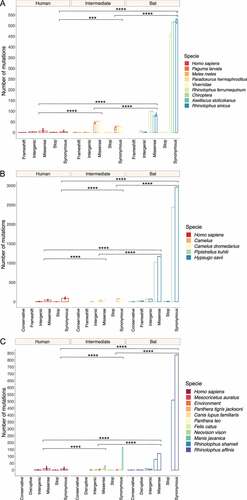
A total of 28,670 mutations were detected in the full-length viral sequences of SARS-CoV (n = 48), MERS-CoV (n = 82) and SARS-CoV-2 (n = 149). From these mutations, 5,874 (20%) were found in SARS-CoV (frameshift = 6; intergenic = 44; missense = 1,405; stop = 7; and synonymous = 4,412). For MERS-CoV 17,883 (62%) (conservative = 6; frameshift = 44; intergenic = 591; missense = 5,365; stop = 23; and synonymous = 11,854), and for SARS-CoV-2 4,913 (17%) (conservative = 1; disruptive = 5; intergenic = 250; missense = 1,691; stop = 12; and synonymous = 2,954) (). In terms of host, an ANOVA was conducted and determined that synonymous and missense mutations of bat viruses were statistically different compared to representative viruses infecting intermediate and human species for each Beta-CoV (). Tukey’s test showed that SARS-CoV sampled from bats had a significantly higher number of synonymous and missense mutations in comparison of those circulating in intermediate animals and humans, showing both mutations a p < 0.00001 (). For MERS-CoV and SARS-CoV-2, statistical analysis also showed that viruses hosting in bats have significantly greater synonymous and missense mutations than those infecting animals and humans (p < 0.00001) ().
Figure 2. Prevalence and distribution of types of mutations found in Beta-CoVs circulating in diverse host species across the world. Synonymous and missense mutations occurred predominantly in bat-associated viruses. (a) A total of 5,874 mutations are detected in SARS-CoV, most of them affecting viruses found in bats, with a mean of 509 synonymous and 88.75 nonsense mutations; (b) Regarding MERS-CoV, 17,883 mutations are identified, where a mean of 2,702 are synonymous and 1,096 are missense mutations impacting the viruses collected from bats; (c) Lastly, SARS-CoV-2 registers the lowest number of mutations with 4,913, showing for viruses circulating in bats a mean of 618.6 and 92.3 are synonymous and missense mutations, respectively. Error dots denote standard errors of the mean (SEM). Statistical results represent the two-way ANOVA followed by Tukey-Kramer test. A single asterisk indicates p < 0.01 (*), a double asterisk p < 0.001 (**), a triple asterisk p < 0.0001 (***), and a fourth asterisk represents p < 0.00001 (****).
Hotspot mutations within the S protein S1 subunit are pivotal to cross-species transmission
To better understand the spread dynamics and the jumping of species barrier, a comparative analysis of hotspot mutations across the three hosts was performed for each viral genome. Even though different tracings were observed during the evolutionary trajectory of SARS-CoV, only two missense mutations appear to be shared between viruses found in intermediate animals and humans. These hotspot mutations were detected at positions 23,220 (G > T; A577S) and 25,298 (A > G; R11G), corresponding to S protein S1 subunit and ORF3a, respectively (). Regarding MERS-CoV, two missense mutations were also detected at positions 23,756 (C > T; S746R) and 23,804 (C > T; N762A) within S protein S1 subunit in viruses sampled from animals and humans (). Interestingly, SARS-CoV-2 showed important hotspot mutations that were reported by different hosts, namely: i) among the three host, a synonymous mutation was detected at position 3,037 (C > T; F924F) of ORF1a and ii) for viral genomes associated with intermediate and human hosts, we observed an intergenic mutation located mainly at position 241 (C > T) within 5’-UTR, and two missense mutations at positions 14,408 (C > T; P4715L) and 23,403 (A > G; D614G) within ORF1b and S protein S1 subunit, respectively ().
Figure 3. Graphical representation of hotspot mutations found in SARS-CoV genomes. The main changes are shown as a triangle at the top and concern two missense mutations in viruses circulating in intermediate animals and humans at positions: 23,220 (G > T; A577S) and 25,298 (A > G; R11G) located in S protein S1 subunit and ORF3a, respectively. Each substitution is coloured depending on mutation type (frameshift, intergenic, missense, stop, and synonymous). Viral sequences are clustered by host (human, intermediate, and bat), and genome structure is shown at the bottom.
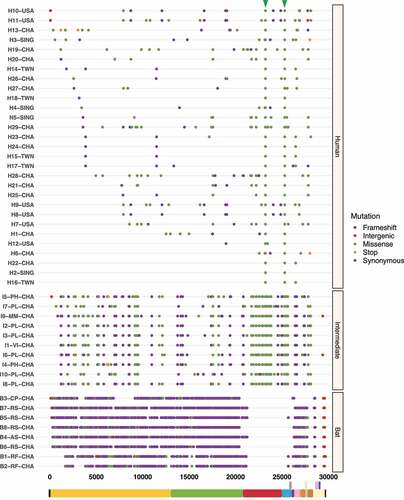
Figure 4. Graphical representation of hotspot mutations found in MERS-CoV genomes. While mutations show a smooth distribution, two missense mutations are highlighted with a triangle at the top corresponding to viruses found in intermediate animals and humans at positions: 23,756 (C > T; S746R) and 23,804 (C > T; N762A) within S protein S1 subunit. Each substitution is coloured depending on mutation type (conservative, frameshift, intergenic, missense, stop and, synonymous). Viral sequences are clustered by host (human, intermediate, and bat), and genome structure is shown at the bottom.
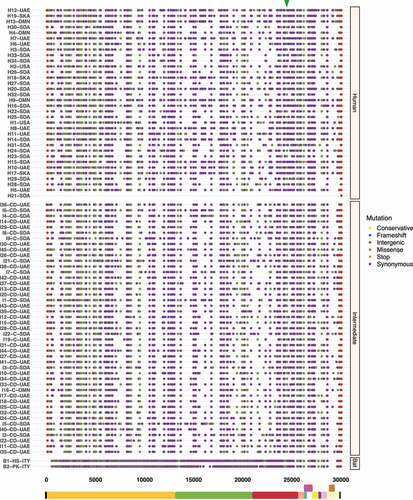
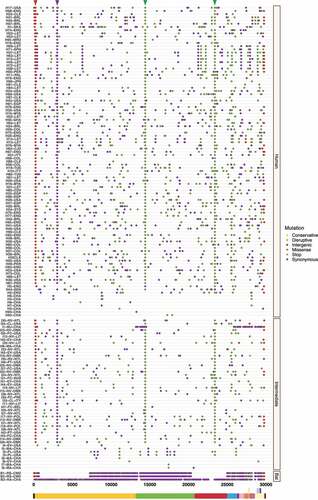
Figure 5. Graphical representation of hotspot mutations found in SARS-CoV-2 genomes. Unlike the other viruses, there are mutations of great interest in SARS-CoV-2 that are shared in various hosts: i) among viruses belonging to all hosts, a synonymous mutation at position 3,037 (C > T; F924F) within ORF1a is striking; while ii) those found in intermediate animals and humans, an intergenic mutation 241 (C > T) in 5’-UTR region is detected as well two missense mutations 14,408 (C > T; P4715L) and 23,403 (A > G; D614G) located in ORF1b and S protein S1 subunit, respectively. Changes are highlighted as a triangle at the top. Each substitution is coloured depending on mutation type (conservative, disruptive, intergenic, missense, stop, and synonymous). Viral sequences are clustered by host (human, intermediate, and bat), and genome structure is shown at the bottom.
Bats as the most plausible evolutionary sources of Beta-CoVs
Next, we sought to trace-back the phylogenetic and epidemiological characteristics of the SARS-CoV, MERS-CoV, and SARS-CoV-2 outbreaks with time-scaled phylogenetic analysis. The best trees were inferred using the tip-dating method with UCLN. reveals the possible evolutionary history of SARS-CoV with an estimated TMRCA at 1950–02-23 (95% HPD interval = [1898–01-14, 2002–06-21]), supported by a posterior probability (PP) value greater than 0.9 (PP > 0.9). At first glance, topology revealed that viruses circulating in bats were the earliest clade in the tree, and those infecting animals emerged as an early sister-clade of the human group with an estimated TMRCA at 1991–06-14 (95% HPD interval = [1967–04-12, 2015–19-03]).
Figure 6. Time-scaled phylogenetic tree and spatial-dynamics of SARS-CoV. (a) Bayesian analyses was inferred from 48 SARS-CoV sequences using the tip-dating method with UCLN through BEAST. The estimated TMRCA date for SARS-CoV was at 1950-02-23 (95% HPD interval = [1898-01-14, 2002-06-21]), revealing that the most divergent are bat-associated viruses, followed by those within intermediate and human species. Each node is coded to indicate the posterior probability (PP) value. Branch lengths show divergence, and colour codes indicate host; (b) Map shows the spatial-dynamics of SARS-CoV and provides insight into the possible geographic origin for each host with sampling dates between 2003–01-01 and 2017–05-30, indicating a complex and interconnected network of viral genomes. Map was created using the data integration and visualization provided by Nexstrain using metadata related to SARS-CoV (Supplementary Table S3).
![Figure 6. Time-scaled phylogenetic tree and spatial-dynamics of SARS-CoV. (a) Bayesian analyses was inferred from 48 SARS-CoV sequences using the tip-dating method with UCLN through BEAST. The estimated TMRCA date for SARS-CoV was at 1950-02-23 (95% HPD interval = [1898-01-14, 2002-06-21]), revealing that the most divergent are bat-associated viruses, followed by those within intermediate and human species. Each node is coded to indicate the posterior probability (PP) value. Branch lengths show divergence, and colour codes indicate host; (b) Map shows the spatial-dynamics of SARS-CoV and provides insight into the possible geographic origin for each host with sampling dates between 2003–01-01 and 2017–05-30, indicating a complex and interconnected network of viral genomes. Map was created using the data integration and visualization provided by Nexstrain using metadata related to SARS-CoV (Supplementary Table S3).](/cms/asset/4a7c29ae-1b0a-4489-a6a9-c83e5ec68727/krnb_a_2115750_f0006_oc.jpg)
Interestingly, MERS-CoV and SARS-CoV-2 showed a topology with slightly divergent traces compared to SARS-CoV, supported by (PP > 0.9) and (PP > 1), respectively. Although bat-associated MERS-CoV was the most closely related to TMRCA, estimated at 1962–05-17 (95% HPD interval = [1913–08-22, 2011–09-27]) (), it was found that SARS-CoV-2 with a TMRCA at 1983–01-28 (95% HPD interval = [1961–07-Citation13, 2005-Citation12-09]) was a virus isolated from Manis javanica as the most basal in the tree (). Additionally, it is worth mentioning that the phylogenetic relationships found among viruses circulating in intermediate and human hosts of MERS-CoV and SARS-CoV-2 were pretty closely related, showing an estimated TMRCA at 2008-10-27 (95% HPD interval = [1995-12-28, 2018–07-19]) and 2019-10-04 (95% HPD interval = [2018-11-10, 2021-03-17]), respectively.
Figure 7. Time-scaled phylogenetic tree and spatial-dynamics of MERS-CoV. (a) Bayesian analyses was inferred from 82 MERS-CoV sequences using the tip-dating method with UCLN through BEAST. The estimated TMRCA date for MERS-CoV was at 1962–05-17 (95% HPD interval = [1913-08-22, 2011-09-27]), being the most closely related to bat viruses. Tree topology suggests that viruses isolated from intermediate and human hosts appear to be closely related. Each node is coded to indicate the posterior probability (PP) value. Branch lengths show divergence, and colour codes indicate host; (b) Map shows the spatial-dynamics of MERS-CoV and provides insight into the possible geographic origin for each host with sampling dates between 2012–06-13 and 2019–03-27, indicating a complex and interconnected network of viral genomes. Map was created using the data integration and visualization provided by Nexstrain using metadata related to MERS-CoV (Supplementary Table S3).
![Figure 7. Time-scaled phylogenetic tree and spatial-dynamics of MERS-CoV. (a) Bayesian analyses was inferred from 82 MERS-CoV sequences using the tip-dating method with UCLN through BEAST. The estimated TMRCA date for MERS-CoV was at 1962–05-17 (95% HPD interval = [1913-08-22, 2011-09-27]), being the most closely related to bat viruses. Tree topology suggests that viruses isolated from intermediate and human hosts appear to be closely related. Each node is coded to indicate the posterior probability (PP) value. Branch lengths show divergence, and colour codes indicate host; (b) Map shows the spatial-dynamics of MERS-CoV and provides insight into the possible geographic origin for each host with sampling dates between 2012–06-13 and 2019–03-27, indicating a complex and interconnected network of viral genomes. Map was created using the data integration and visualization provided by Nexstrain using metadata related to MERS-CoV (Supplementary Table S3).](/cms/asset/ea6b53ae-eb00-4bf9-a63c-5108f524f462/krnb_a_2115750_f0007_oc.jpg)
Figure 8. Time-scaled phylogenetic tree and spatial-dynamics of SARS-CoV-2. (a) Bayesian analyses was inferred from 149 SARS-CoV-2 sequences using the tip-dating method with UCLN through BEAST. The estimated TMRCA date for SARS-CoV-2 was at 1983–01-28 (95% HPD interval = [1961–07-13, 2005-12-09]). Tree topology reveals that virus isolated from Manis javanica is the most closely related to TMRCA and represents part of the basal tree with bat-associated viruses. Similar to MERS-CoV, viruses found in intermediate animals and human are highly related. Each node is coded to indicate the posterior probability (PP) value. Branch lengths show divergence, and colour codes indicate host; (b) Map analysis represents the propagation and evolution of SARS-CoV-2 genomes and provides insight into the possible geographic origin for each host with sampling dates between 2010–12-06 and 2021–04-02, indicating a complex and interconnected network of viral genomes. Map was created using the data integration and visualization provided by Nexstrain using metadata related to SARS-CoV-2 (Supplementary Table S3).
![Figure 8. Time-scaled phylogenetic tree and spatial-dynamics of SARS-CoV-2. (a) Bayesian analyses was inferred from 149 SARS-CoV-2 sequences using the tip-dating method with UCLN through BEAST. The estimated TMRCA date for SARS-CoV-2 was at 1983–01-28 (95% HPD interval = [1961–07-13, 2005-12-09]). Tree topology reveals that virus isolated from Manis javanica is the most closely related to TMRCA and represents part of the basal tree with bat-associated viruses. Similar to MERS-CoV, viruses found in intermediate animals and human are highly related. Each node is coded to indicate the posterior probability (PP) value. Branch lengths show divergence, and colour codes indicate host; (b) Map analysis represents the propagation and evolution of SARS-CoV-2 genomes and provides insight into the possible geographic origin for each host with sampling dates between 2010–12-06 and 2021–04-02, indicating a complex and interconnected network of viral genomes. Map was created using the data integration and visualization provided by Nexstrain using metadata related to SARS-CoV-2 (Supplementary Table S3).](/cms/asset/dbb245e9-59a3-4533-b01f-d8ed2c807ab1/krnb_a_2115750_f0008_oc.jpg)
With regard to geographic distributions, the MERS-CoV map showed that viruses sampled from bats were located in Italy (), whereas those belonging to SARS-CoV and SARS-CoV-2 were isolated from China (). Furthermore, the majority of MERS-CoV intermediate and human hosts were from the United Arab Emirates and Saudi, rather than those associated with SARS-CoV and SARS-CoV-2 that had a more diverse geographic distribution across the globe. The tip-dating and full metadata for estimation of time-scaled phylogenies of SARS-CoV, MERS-CoV and SARS-CoV-2 are provided in Supplementary Table S3.
Codon sites in the S protein S1 subunit are positively selected in the MERS-CoV and SARS-CoV-2 genomes
A combination of diverse algorithms based on a phylogenetic codon framework was used to detect specific sites evolving under natural selection on Beta-CoVs CDSs. We found evidence of progressive synonymous mutation fixation (dN/dS < 1) (i.e. negative selection) in 30 codons located within five CDSs (S:24 > ORF1a:2 > ORF1b:1 = ORF3a:1 = M:1 = N:1) of SARS-CoV. MERS-CoV registered 138 codons in seven CDSs (ORF1a:65 > S:31 > ORF1b:29 > N:7 > ORF4b:2 = ORF5:2 = M:2); and SARS-CoV-2 obtained 86 codons in the same CDSs as SARS-CoV (ORF1a:35 > S:20 > ORF1b:15 > N:10 > M:4 > ORF3a:2) (Supplementary Table S4).
On the other hand, we detected sites that have a higher number of synonymous mutations accumulated (dN/dS > 1) (i.e. positive selection) in MER-CoV and SARS-CoV-2 genomes. In the case of MERS-CoV, 4 codons were detected in four CDSs (ORF1a:1 = ORF1b:1 = S:1 = N:1) ( and ) and for SARS-CoV-2, 4 of the 5 codons were also found in the same CDSs as MERS-CoV, along with the newly discovered CDS corresponding to ORF10 (ORF1a:1 = ORF1b:1 = S:1 = N:1 = ORF10:1) ( and ). Regarding neutrality (dN/dS = 1), SARS-CoV registered the highest number of CDS under this selection (Supplementary Fig. S2), otherwise it was considerably variable among CDS for the three Beta-CoVs.
Table 1. Codons evolving at positive diversifying selection in MERS-CoV using four evolutionary tests: SLAC, FEL, MEME (p-value <0.05) and FUBAR (posterior probability >0.95).
Table 2. Codons evolving at positive diversifying selection in SARS-CoV-2 using four evolutionary tests: SLAC, FEL, MEME (p-value <0.05) and FUBAR (posterior probability >0.95).
Figure 9. Estimation of positive and negative selection on MERS-CoV. General overview obtained by SLAC analysis, showing the evolutionary rate (dN-dS or dN/dS) at individual genes of MERS-CoV. Statistically significant codons with positive signals were inferred by overlapping of four evolutionary tests (SLAC, FEL, MEME, and FUBAR), whereas significant negative codons by (SLAC, FEL, and FUBAR). Red triangles represent codons with significant evidence for positive selection shown in .
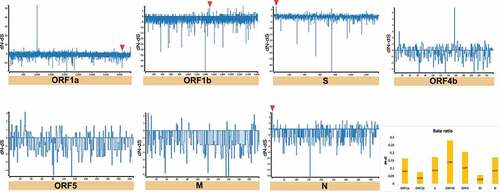
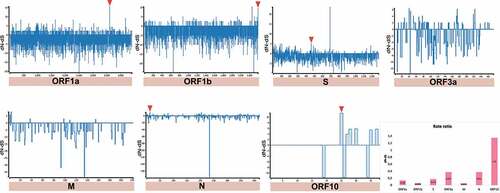
Figure 10. Estimation of positive and negative selection on SARS-CoV-2. General overview obtained by SLAC analysis, showing the evolutionary rate (dN-dS or dN/dS) at individual genes of SARS-CoV-2. Statistically significant codons with positive signals were inferred by overlapping of four evolutionary tests (SLAC, FEL, MEME, and FUBAR), whereas significant negative codons by (SLAC, FEL, and FUBAR). Red triangles represent codons with significant evidence for positive selection shown in .
Nearly half of the Beta-CoVs genomes carry highly conserved RNA structures
The principal evidence for conserved RNA structures in Beta-CoVs genomes was derived from the detection of multiple loci with P > 0.98 and z < −3 in the whole genome. A total of 848 conserved loci scattered across genomes for the three Beta-CoVs were predicted by the RNAz approach. Among these conserved RNA structures, SARS-CoV carried 353 (42%), followed by MERS-CoV 287 (34%), and SARS-CoV-2 208 (24%) (). Additionally, we estimated the percentage of conserved RNA structures throughout the viral genome coverage by analysing the number of structured loci for each host. Following viral genome coverage, viruses belonging to intermediate and human groups were found to carry slightly more conserved loci compared to those from bats.
Table 3. Number of conserved loci predicted by RNAz for each host and proportion of virus genome coverage.
Conserved RNA structures of Beta-CoVs are unique for each host
To unravel to what extent RNA structure is conserved in the same region during the passage from bats to humans, we aligned the conserved loci across the three hosts based on their genome positions. At first glance, most conserved RNA structures in Beta-CoVs were unique for each host (). Indeed, the only virus that shared a higher number of conserved RNA structures was MERS-CoV isolated from intermediate and human hosts, which showed 68 regions. However, we focused on structured regions that were common across the three hosts. For instance, we detected four conserved RNA structures in SARS-CoV that have been common during the evolutionary trajectory: ORF1a (6,121–6,240 bp); ORF3a (25,961–26,080 bp); E (26,041–26,160 bp); and M (26,361–26,480) (). Similarity, for MERS-CoV, four conserved RNA structures were also found: ORF1a (3,361–3,480; 5,801–5,920); FSE (13,401–13,520 bp); and ORF5 (27,361–27,480) (), whereas SARS-CoV-2, a common structure was found in ORF1b (19,401–19,520 bp) (). Regions in the genome of SARS-CoV, MERS-CoV and SARS-CoV-2 with conserved RNA structures which were common, shared or unique across all three hosts are available in Supplementary Table S5.
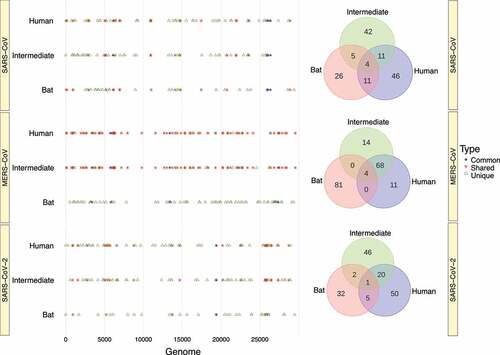
Figure 11. Graphical representation of regions carrying conserved RNA structures in the Beta-CoVs genomes. (a) The vast number of conserved RNA structures in SARS-CoV are unique across all hosts. Still, four conserved RNA structures have been common during time: ORF1a (6,121–6,240 bp); ORF3a (25,961–26,080 bp); E (26,041–26,160 bp); and M (26,361–26,480); (b) Whilst MERS-CoV circulating in bats have no shared RNA structures with those infecting intermediate animals and humans, four conserved RNA structures are found in common comprising: ORF1a (3,361–3,480; 5,801–5,920); FSE (13,401–13,520 bp); and ORF5 (27,361–27,480); and (c) SARS-CoV-2 presents a similar pattern to SARS-CoV, but exhibiting a common structure in ORF1b (19,401–19,520 bp). Venn diagrams show conserved RNA structures that are common, shared, and unique across the three hosts for each virus.
RNA structures in the S protein S1 subunit are positively selected in the MERS-CoV and SARS-CoV-2 genomes
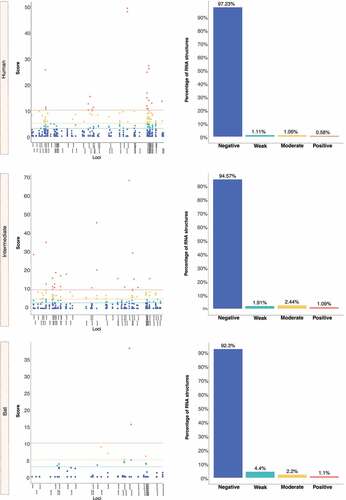
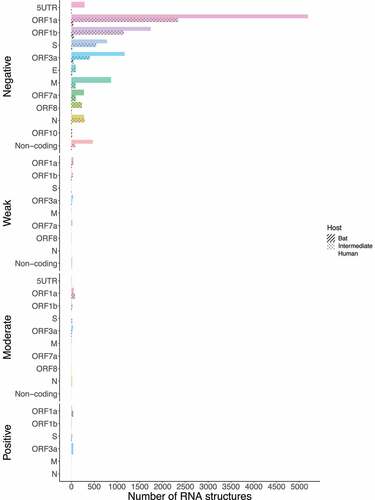
We retrieved the conserved loci for each Beta-CoV and assessed them for estimating natural selection with the SSS test. Surprisingly, a total of 31,076 of conserved RNA structures showed negative selection signals (s ≤ 2.99) throughout the three Beta-CoVs, which are crucial for the functionality of RNA molecules [Citation29] (). Among conserved RNA structures under negative selection, 4,884 (96%) SARS-CoV were detected (), while MERS-CoV and SARS-CoV-2 carried a higher number, showing 9,563 (90%) () and 16,629 (96%) (), respectively. In contrast, conserved RNA structures showing positive selection signals (s ≥ 10.0) were relatively low, with a total of 719, of which 88 (1.7%) were evidenced for SARS-CoV (), 501 (4.7%) for MERS-CoV () and 130 (0.8%) for SARS-CoV-2 ().
Figure 12. Estimation of natural selection acting on SARS-CoV RNA structures. A total of 5,102 RNA structures under selection in SARS-CoV are detected, of which 4,884 (96%) show negative selection signals. (a) In terms of each host, human-associated viruses register 3,516 (98%) RNA structures with negative selection, (b-c) while for those circulating in intermediate animals and bats, 973 (95%), and 395 (77%), respectively. The dot graph shows score obtained for RNA structure at a given loci in the genome and the bar chart represents the number of RNA structures depending on the selective restriction for each host. Global frequency of negative selection of RNA structures was calculated by multiplying the total number of RNA structures with negative selection signals across all hosts by 100, and then dividing the total number of RNA structures corresponding to all types of restrictive selection.
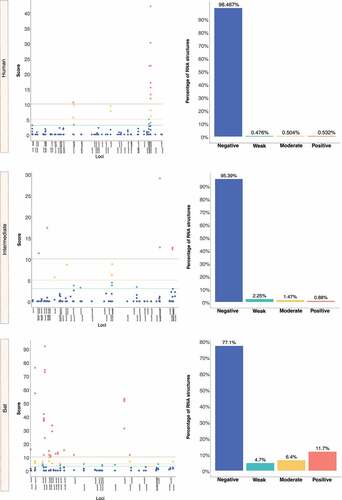
Figure 13. Estimation of natural selection acting on MERS-CoV RNA structures. For MERS-CoV, a total of 10,593 RNA structures under selection are identified, where 9,563 (90%) of them correspond to RNA structures with negative selection. (a) On other hand, viruses found in humans show 3,863 (88%) RNA structures with negative signals and (b-c) regarding intermediate animals and bats are 5,384 (92%), and 316 (95%), respectively. The dot graph shows score obtained for RNA structure at a given loci in the genome and the bar chart represents the number of RNA structures depending on the selective restriction for each host. Global frequency of negative selection of RNA structures was calculated by multiplying the total number of RNA structures with negative selection signals across all hosts by 100, and then dividing the total number of RNA structures corresponding to all types of restrictive selection.
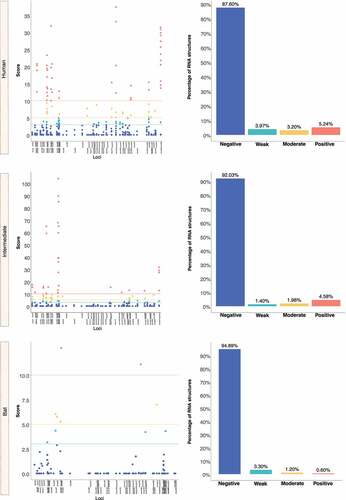
Figure 14. Estimation of natural selection acting on SARS-CoV-2 RNA structures. SARS-CoV-2 carries the highest number of RNA structures with natural selection 17,265. Among them, 16,629 (96%) are RNA structures showing negative signals. (a) More concretely, for viruses belonging to humans, 11,149 (97%) RNA structures are identified under negative selection, (b-c) in contrast, those infecting intermediate animals and bats show 5,311 (94%), and 169 (92%), respectively. The dot graph shows score obtained for RNA structure at a given loci in the genome and the bar chart represents the number of RNA structures depending on the selective restriction for each host. Global frequency of negative selection of RNA structures was calculated by multiplying the total number of RNA structures with negative selection signals across all hosts by 100, and then dividing the total number of RNA structures corresponding to all types of restrictive selection.
Next, we asked how many of these conserved RNA structures have driven the evolution of positively selected RNA structures in the S region during jumping the species barrier. Whilst SARS-CoV revealed RNA structures with positive selection on ORF1a for all hosts (bat = 49, intermediate = 3, and human = 1) (), MERS-CoV (bat = 1, intermediate = 2, and human = 26), and SARS-CoV-2 (bat = 1, intermediate = 16, and human = 2) were shown in the S region ( and ), consistent with codon sites under positive selection in the S protein ().
Figure 15. Bar chart showing frequencies of selected RNA structures across the three hosts of SARS-CoV acting on each ORF. ORF1a carries RNA structures with positive selection signals that are being disrupted from viruses circulating in bats to humans. (ORF1a: bat = 49, intermediate = 3, and human = 1). Specific number of RNA structures is available in Supplementary Table S6.
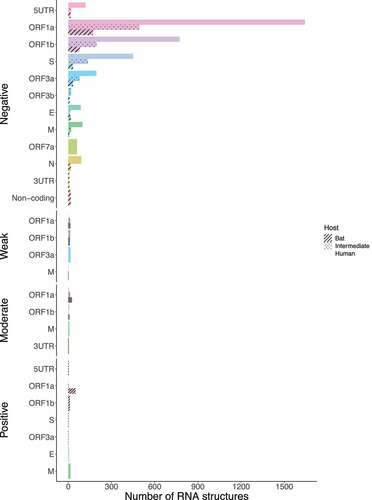
Figure 16. Bar chart showing frequencies of selected RNA structures across the three hosts of MERS-CoV acting on each ORF. RNA structures found in ORF1a, and S are experiencing positive selection in viruses infecting all host species (ORF1a: bat = 1, intermediate = 205, and human = 126; S: bat = 1, intermediate = 2, and human = 26). Specific number of RNA structures is available in Supplementary Table S6.
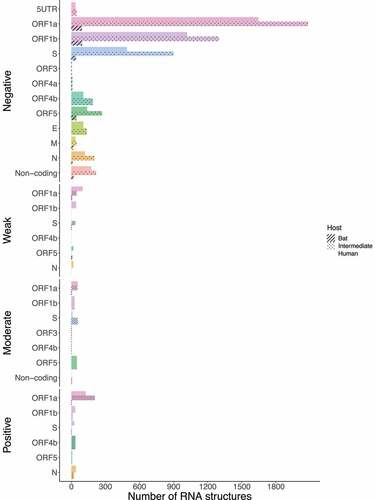
Figure 17. Bar chart showing frequencies of selected RNA structures across the three hosts of SARS-CoV-2 acting on each ORF. While ORF1a, ORF1b, and M contain positive RNA structures in viruses isolated from intermediate animals and humans, S shows RNA structures under positive selection for bat-to-human viral transmission (S: bat = 1, intermediate = 16, and human = 2). Specific number of RNA structures is available in Supplementary Table S6.
Discussion
Novel variants of Beta-CoVs are rapidly emerging, and current surveillance systems are overwhelmed, reducing the effectiveness of existing vaccines and test kits. Therefore, it is essential to scan these variations to identify where they will evolve, and which regions of the genome are most prone to mutation, useful for monitoring changes in transmissibility, virulence, and disease pathology. To cope with this, we retrieved 1,252,952 viral genomes of SARS-CoV, MERS-CoV and SARS-CoV-2 from bats and a large diversity of intermediate animals as well as from human hosts, publicly available in the most prominent virus databases, NCBI Virus [Citation33], ViPR [Citation34], ViruSurf [Citation35] and GISAID [Citation36] across the globe (May 2021). We used this information to unravel novel insights into tracing cross-species horizontal transmission in Beta-CoVs. First, to identify emerging variations on viral protein-coding, and second to detect if these hotspot mutations might impact the functionality of conserved structural RNA during the evolutionary process of jumping from bats to humans.
The ongoing COVID-19 pandemic was initially reported in Wuhan (China), in 2019 [Citation64,Citation65], though its pathogenic origin, SARS-CoV-2, remains unclear. The time-resolved tree based on UCLN points out an estimated TMRCA at 1983–01-28 (95% HPD interval = [1961–07-13, 2005-12-09]), revealing that a virus isolated from M. javanica is the most closely related to TMRCA, rather than those circulating in bats as has been suggested in previous reports [Citation66–68]. Pangolins have been listed in the Convention on International Trade in Endangered Species (CITES) of Wild Fauna and Flora since its inception in 1975 through diverse Chinese wet markets [Citation69,Citation70], a date very close to estimated SARS-CoV-2 TMRCA, in which people already consumed Asian pangolins, and probably became infected with an ancestral pangolin virus that evidently has not been traced since 2019, when viral sequencing was undertaken in an attempt to determine the SARS-CoV-2 origin. Despite this, tree topology showed that the majority of bat-associated SARS-CoV-2 are part of the basal tree (), as has been suggested for SARS-CoV and MERS-CoV, where are closely related to their TMRCA, being at 1950–02-23 (95% HPD interval = [1898–01-14, 2002–06-21]), and 1962–05-17 (95% HPD interval = [1913–08-22, 2011–09-27]), respectively () [Citation71–73].
RaTG13 was initially considered as the closest ‘relative’ of SARS-CoV-2 [Citation74]; a bat coronavirus detected in Rhinolophus affinis from Yunnan province (China) (), which exhibits 96.2% genome sequence similarity to SARS-CoV-2 [Citation74]. The fact that viruses from M. javanica and some bat species are highly related may suggest that SARS-CoV-2 is the result of recombination of the two viruses [Citation16,Citation68]. This assumption is recently gaining credibility, given a possible intermediate animal has not been identified for SARS-CoV-2 to date, as has been demonstrated for SARS-CoV and MERS-CoV, where viruses circulating in Paguma larvata and Camelus dromedarius might interact with humans, respectively [Citation71,Citation75]. Our SARS-CoV-2 phylogeny also fails to point out viruses infecting M. javanica as the primary animal acting an intermediate host for several reasons: i) phylogenetic relationships fail to cluster M. javanica with other animal species; ii) viruses isolated in M. javanica are different from SARS-CoV-2 and are, even more diverse than those found in bats, showing a closer relationship to TMRCA; iii) M. javanica and SARS-CoV-2 only share more than 99% sequence similarity with the RBD region [Citation71,Citation76]; iv) all viruses that are members of the intermediate group, including M. javanica possess the missense mutation (A > G; D614G), also located in the S protein S1 subunit; and v) recent evidence supports recognition of ACE2 receptors expressed in fish, amphibians, reptiles, birds and mammals [Citation77]. More interestingly, our time-resolved trees coupled with single nucleotide variant analysis suggest that Beta-CoVs have been incubated for years inside bats, accumulating statistically a higher number of synonymous and missense mutations compared to representative viruses infecting intermediate and human species (p < 0.00001) (), leading to heterogeneous pooled viruses termed quasispecies with fitness for jumping the species barrier [Citation62,Citation78]. Hence, genomic variability confers an advantage to the viral population, providing a rapid adaptation to a changing environment.
Recent studies have already showed that MERS-CoV and SARS-CoV-2 are possibly under strong positive selection [Citation79,Citation80]. Notably, it has been suggested that amino acid changes in the S protein may considerably alter viral function and provide a route for host switching from bats to intermediate animals and humans [Citation14]. From this concept, missense mutations detected in the S protein S1 subunit were mainly highlighted: SARS-CoV (G > T; A577S) (); MERS-CoV (C > T; S746R and C > T; N762A) (); and SARS-CoV-2 (A > G; D614G) (). To the best of our knowledge, this study reports that these hotspot mutations have only been appreciated in viruses circulating in intermediate animals and humans for the three Beta-CoVs, making them a potential evolutionary pattern to trace cross-species horizontal transmission events. Additionally, for MERS-CoV and SARS-CoV-2, recurrent positive selection was detected at codon sites on the S protein () [Citation16,Citation62,Citation81,Citation82], and more suppressively, acting on the S RNA structures (). Our hypothesis suggests that since the S protein shows evidence of increased fixation of non-synonymous mutations (dN/dS >1), these changes may possibly disrupt base pairs in its RNA structures, hinting at a relaxation of constraints, which means positive selection [Citation29,Citation31]. To date, most studies have only provided a static snapshot of RNA structures in Beta-CoVs genomes [Citation21,Citation24,Citation27,Citation83], failing to understand how natural selection might affect the functionally of conserved RNA structures across different host in highly interesting regions as S. Therefore, this plausible scenario includes that the S protein S1 subunit of MERS-CoV and SARS-CoV-2 is both on protein-coding and structural under positive selection, providing novel insights into how some pathogenic SARS-CoV-2 variants, such as (A > G; D614G), might enable a viral fitness advantage at the RNA structure level for increased viral load, and thus have the capability to evade immune system and jump to intermediate hosts [Citation20,Citation84]. Considering previous evolutionary events [Citation85], certainly, the S protein is a probable candidate driver for viral genome evolution, and possibly contributes to jump from bat viruses to intermediate animals and humans, resulting in a high zoonotic potential.
Many viruses belonging to intermediate animals with the capability to infect humans are waiting for the chance to jump the species barrier. Based on our phylogenetic analyses and previous evidence, the earliest TMRCA between intermediate animal and human viruses in Beta-CoVs was SARS-CoV at 1991–06-14 (95% HPD interval = [1967-04-12, 2015-19-03]), reporting an outbreak period between 2002 and 2005 [Citation86–88] (). After 17 years, the emerging TMRCA for MERS-CoV was at 2008-10-27 (95% HPD interval = [1995-12-28, 2018–07-19]) with an outbreak period ranging from 2010 to 2013 [Citation89–92] (), and the most recent SARS-CoV-2 in 2019–10-04 (95% HPD interval = [2018-, 2021–03-17]), ongoing outbreak from 2020, consistent with a bulk of time-resolved phylogenetic studies [Citation15,Citation93–96] (). It is suggested that SARS-CoV passage from intermediate animals to humans involved a 29-nucleotide deletion in the middle of ORF8, leading to cleavage of ORF8 into two smaller ORFs found only in human viruses, namely ORF8a and ORF8b [Citation88,Citation97,Citation98] (Fig. Supplementary S1A). Conversely, MERS-CoV and SARS-CoV-2 still remain unknown, but it has been supposed that hotspot mutations in the S protein lead to an increased affinity for DPP4 [Citation99,Citation100], and ACE2 [Citation101–103] receptors, respectively. Considering the rapid evolution of Beta-CoVs, leading to changes in the sequence and structure of viral proteins, the existence of conserved RNA structures provides an opportunity to shed light on crossing from intermediate viruses to humans.
Interestingly, shows that Beta-CoV genomes isolated from intermediate animals and humans share the most conserved RNA structures in relation to those found in bats, preserving 11, 68 and 20 regions for SARS-CoV, MERS-CoV and SARS-CoV-2, respectively. This remarkable biological peculiarity might suggest that jumping from virus circulating in an intermediate animal to human cells is probably related to how its single-stranded RNA genome folds back on itself to form intricate secondaries that have been proven essential for viral replication [Citation23,Citation104] and enhanced by the functionality of the S protein and its interaction with the ACE2 (SARS-CoV and SARS-CoV-2) and DPP4 (MERS-CoV) receptors. In addition, it is clearly important to account that a high-degree of evolutionary conservation of the RNA structure may represent a pivotal strategy to improve viral genome stability, given the important role of conserved RNA structures in virus life cycle, such as cis-acting RNA elements with structures in 5’ and 3’ UTRs and FSE [Citation24,Citation105,Citation106]. Although these conserved RNA structures have been validated in vivo through click selective 2-hydroxyl acylation and profiling experiment (icSHAPE), nuclear magnetic resonance (NMR) and cryo–electron microscopy (cryo-EM) [Citation26,Citation107–110], none of the RNA structures we found in common across the viruses sampled from bats, intermediate animals and humans have been tested experimentally, except for the MERS-CoV FSE, which was the only common RNA structure predicted and validated for all three hosts (). On the other hand, we discovered that nearly half of the Beta-CoV genomes carry highly conserved RNA structures (), and greater than 90% of these RNA structures show negative selection signals (), making them potential candidates as a model for the prediction of virus-derived small RNAs hidden in viral genomes that might contribute to modulate the transcriptional reprogramming of host upon infection.
Conclusions
In summary, we report a significant landscape of potential signatures associated with jumping the species barrier of relevance for a molecular surveillance system using not only protein-coding information but also enriched by conserved RNA structures of Beta-CoVs circulating in bats, intermediate animals, and humans across the globe through a horizontal transmission approach. Our time-resolved phylogenies suggest that bat viruses are the most closely related to Beta-CoVs TMRCA, which have incubated for years inside bats with a high mutation rate compared to those circulating in intermediate and human hosts. This event might trigger the emergence of quasispecies groups, driving the onset of pivotal missense mutations in the S protein S1 subunit of SARS-CoV (G > T; A577S), MERS-CoV (C > T; S746R and C > T; N762A), and SARS-CoV-2 (A > G; D614G). In addition, the S protein S1 subunit is both on protein-coding and structural under positive selection, suggesting that it might mediate the entry of bat viruses into intermediate animals. Although transmission of virus from wild animals to human cells remains unclear, the existence of conserved RNA structures in viral genomes is a step towards unravelling this puzzle. We found that viruses isolated from intermediate animals and humans share more conserved RNA structures than those from bats, and greater than 90% of these RNA structures show negative selection signals, which remain largely unexplored. We encourage future studies to scan for emerging functions of viral conserved structures as potential coding of small RNAs and as targets of antiviral therapeutic strategies.
Author contributions
Conceptualization and supervision, C.I.B.-S.; methodology, A.F.R.-C. and C.I.B.-S.; formal analysis, A.F.R.-C., and C.I.B.-S.; investigation, A.F.R.-C., and C.I.B.-S.; data curation and validation, A.F.R.-C.; writing original draft preparation, A.F.R.-C.; writing review and editing, C.I.B-S. and J.C.G.-G.; visualization, A.F.R.-C.; funding acquisition and resources, C.I.B.-S. All authors have read and agreed to the published version of the manuscript.
Supplemental Material
Download Zip (1.5 MB)Acknowledgments
We thank Mr Ernesto Parra Rincón for the timely services and support with the server of the Computational Biology Laboratory partially supported by the Center of Excellence in Scientific Computing, National University of Colombia.
Disclosure statement
No potential conflict of interest was reported by the author(s).
Data availability statement
The data that support the findings of this study are openly available in Figshare at: http://doi.org/10.6084/m9.figshare.20439810, reference number 20439810.
Supplementary material
Supplemental data for this article can be accessed online at https://doi.org/10.1080/15476286.2022.2115750
Correction Statement
This article has been corrected with minor changes. These changes do not impact the academic content of the article.
Additional information
Funding
References
- Carrasco-Hernandez R, Jácome R, López Vidal Y. Are RNA viruses candidate agents for the next global pandemic? A review. ILAR J. 2017;58:343–358.
- Wang C, Horby PW, Hayden FG. A novel coronavirus outbreak of global health concern. Lancet. 2020;395:470–473.
- Wu F, Zhao S, Yu B. A new coronavirus associated with human respiratory disease in China. Nature. 2020;579:265–269.
- Frutos R, Serra-Cobo J, Pinault L. Emergence of bat-related Betacoronaviruses: hazard and risks. Front Microbiol. 2021;12: 591535.
- Fehr AR, Perlman S. Coronaviruses: an overview of their replication and pathogenesis. In Coronaviruses: methods and Protocols. In: Maier HJ, Bickerton E, Britton P, editors. Methods in Molecular Biology. New York NY: Springer; 2015. p. 1–23.
- Hussain S, Pan J, Chen Y. Identification of novel subgenomic RNAs and noncanonical transcription initiation signals of severe acute respiratory syndrome coronavirus. J Virol. 2005;79:5288–5295.
- Abdullahi IN, Emeribe AU, Mustapha JO. Exploring the genetics, ecology of SARS-COV-2 and climatic factors as possible control strategies against COVID-19. Infez Med. 2020;28:166–173.
- Domingo E, Martín V, Perales C. Viruses as Quasispecies: biological Implications. Quasispecies Concept Implic Virol. 2006;299:51–82.
- Lu G, Wang Q, Gao GF. Bat-to-human: spike features determining “host jump” of coronaviruses SARS-CoV, MERS-CoV, and beyond. Trends Microbiol. 2015;23:468–478.
- Wu A, Niu P, Wang L. Mutations, recombination and insertion in the evolution of 2019-NCoV. bioRxiv 2020:doi: 10.1101/2020.02.29.971101.
- Abdullahi IN, Emeribe AU, Ajayi OA. Implications of SARS-CoV-2 genetic diversity and mutations on pathogenicity of the COVID-19 and biomedical interventions. J Taibah Univ Med Sci. 2020;15:258–264.
- Roes FL. On the evolution of virulent zoonotic viruses in bats. Biol Theory 2020 . 15:223–225
- Ye Z-W, Yuan S, Yuen K-S. Zoonotic origins of human coronaviruses. Int J Biol Sci. 2020;16:1686–1697.
- da Silva PG, Mesquita JR, de São José Nascimento M. Host and environmental factors that favor anthropozoonotic spillover of coronaviruses: an opinionated review, focusing on SARS-CoV, MERS-CoV and SARS-CoV-2. Sci Total Environ. 2021;750:141483.
- Boni MF, Lemey P, Jiang X. Evolutionary origins of the SARS-CoV-2 Sarbecovirus lineage responsible for the COVID-19 pandemic. Nat Microbiol. 2020;5:1408–1417.
- Li X, Giorgi EE, Marichannegowda MH. Emergence of SARS-CoV-2 through recombination and strong purifying selection. Sci Adv 2020 . 6:eabb9153
- Farrag MA, Amer HM, Bhat R. SARS-CoV-2: an overview of virus genetics, transmission, and immunopathogenesis. Int J Environ Res Public Health. 2021;18:6312.
- Wang N, Shi X, Jiang L. Structure of MERS-CoV spike receptor-binding domain complexed with human receptor DPP4. Cell Res. 2013;23:986–993.
- Du L, He Y, Zhou Y. The spike protein of SARS-CoV – a target for vaccine and therapeutic development. Nat Rev Microbiol. 2009;7:226–236.
- Plante JA, Liu Y, Liu J. Spike mutation D614G alters SARS-CoV-2 fitness. Nature. 2021;592:116–121.
- Cao C, Cai Z, Xiao X. The architecture of the SARS-CoV-2 RNA genome inside virion. Nat Commun. 2021;12:3917.
- Kim D, Lee J-Y, Yang J-S. The architecture of SARS-CoV-2 transcriptome. Cell. 2020;181:914–921.e10.
- Nicolas Calderon K, Fabian Galindo J, Bermudez-Santana CI. Evaluation of Conserved RNA Secondary Structures within and between Geographic Lineages of Zika Virus. Life. 2021;11(344):344.
- Rangan R, Zheludev IN, Das R. RNA genome conservation and secondary structure in SARS-CoV-2 and SARS-related viruses: a first look. RNA journal 2020 . 26 937–959 . . .
- Schlick T, Zhu Q, Dey A. To knot or not to knot: multiple conformations of the SARS-CoV-2 frameshifting RNA element. J Am Chem Soc 2021 . 143:11404–11422
- Bhatt PR, Scaiola A, Loughran G. Structural basis of ribosomal frameshifting during translation of the SARS-CoV-2 RNA genome. Science. 2021;372:1306–1313.
- Andrews RJ, O’Leary CA, Tompkins VS. A map of the SARS-CoV-2 RNA Structurome. NAR Genomics Bioinforma. 2021;3:lqab043.
- Madhugiri R, Karl N, Petersen D. Structural and functional conservation of Cis-acting RNA elements in coronavirus 5’-terminal genome regions. Virology. 2018;517:44–55.
- Nowick K, Walter Costa MB, Höner Zu Siederdissen C. Selection pressures on RNA sequences and structures. Evol Bioinforma Online. 2019;15. .
- Piskol R, Stephan W. Analyzing the evolution of RNA secondary structures in vertebrate introns using Kimura’s model of compensatory fitness interactions. Mol Biol Evol. 2008;25:2483–2492.
- Walter Costa MB, Höner Zu Siederdissen C, Dunjić M. SSS-test: a novel test for detecting positive selection on RNA secondary structure. BMC Bioinformatics. 2019;20:151.
- Qu -X-X, Hao P, Song X-J. Identification of two critical amino acid residues of the severe acute respiratory syndrome coronavirus spike protein for its variation in zoonotic tropism transition via a double substitution strategy. J Biol Chem. 2005;280:29588–29595.
- Brister JR, Ako-adjei D, Bao Y. NCBI viral genomes resource. Nucleic Acids Res. 2015;43:D571–D577.
- Pickett BE, Greer DS, Zhang Y. Virus pathogen database and analysis resource (ViPR): a comprehensive bioinformatics database and analysis resource for the coronavirus research community. Viruses. 2012;4:3209–3226.
- Canakoglu A, Pinoli P, Bernasconi A. ViruSurf: an integrated database to investigate viral sequences. Nucleic Acids Res. 2021;49:D817–D824.
- Shu Y, McCauley J. GISAID: global initiative on sharing all influenza data – from vision to reality. Eurosurveillance 2017 . 22:30494
- Fu L, Niu B, Zhu Z. CD-HIT: accelerated for clustering the next-generation sequencing data. Bioinformatics. 2012;28:3150–3152.
- Sievers F, Wilm A, Dineen D. Fast, scalable generation of high-quality protein multiple sequence alignments using clustal omega. Mol Syst Biol. 2011;7:539.
- Larsson AA. A fast and lightweight alignment viewer and editor for large datasets. Bioinformatics. 2014;30:3276–3278.
- Michel CJ, Mayer C, Poch O. Characterization of accessory genes in coronavirus genomes. Virol J. 2020;17:131.
- Chen Y, Ye W, Zhang Y. High speed BLASTN: an accelerated megablast search tool. Nucleic Acids Res. 2015;43:7762–7768.
- Xing Y, Li X, Gao X. MicroGMT: a mutation tracker for SARS-CoV-2 and other microbial genome sequences. Front Microbiol. 2020 11 1502 .
- Li H, Birol I. Minimap2: pairwise alignment for nucleotide sequences. Bioinforma Oxf Engl. 2018;34:3094–3100.
- Danecek P, McCarthy SA, Birol I. BCFtools/Csq: haplotype-aware variant consequences. Bioinforma Oxf Engl. 2017;33:2037–2039.
- Cingolani P, Platts A, Wang LL. A program for annotating and predicting the effects of single nucleotide polymorphisms, SnpEff. Fly (Austin). 2012;6:80–92.
- R Core Team R: the R Project for Statistical Computing Available online: https://www.r-project.org/ (accessed on 2021 Jul 19).
- Wickham H, Averick M, Bryan J. on Welcome to the Tidyverse. J Open Source Softw. 2019;4:1686.
- Ito K, Murphy D. Application of Ggplot2 to pharmacometric graphics. CPT Pharmacomet Syst Pharmacol. 2013;2:e79.
- Abascal F, Zardoya R, Telford MJ. TranslatorX: multiple alignment of nucleotide sequences guided by amino acid translations. Nucleic Acids Res. 2010;38:W7–13.
- Suchard MA, Lemey P, Baele G. Bayesian phylogenetic and phylodynamic data integration using BEAST 1.10. Virus Evol. 2018;4(16): vey.
- Miller MA, Pfeiffer W, Schwartz T. Creating the CIPRES science gateway for inference of large phylogenetic trees. In Proceedings of the 2010 Gateway Computing Environments Workshop (GCE) New Orleans, LA, USA; November 2010; pp. 1–8.
- Ayres DL, Darling A, Zwickl DJ. BEAGLE: an application programming interface and high-performance computing library for statistical phylogenetics. Syst Biol. 2012;61:170–173.
- Darriba D, Taboada GL, Doallo R. JModelTest 2: more models, new heuristics and high-performance computing. Nat Methods. 2012;9:772.
- Paradis E, Claude J, Strimmer K. APE: analyses of phylogenetics and evolution in R Language. Bioinforma Oxf Engl. 2004;20:289–290.
- Drummond AJ, Ho SYW, Phillips MJ. Relaxed phylogenetics and dating with confidence. PLoS Biol. 2006;4:e88.
- Rambaut A, Drummond AJ, Xie D. Posterior summarization in Bayesian phylogenetics using tracer 1.7. Syst. Biol. 2018, 67 , 901–904,
- Weaver S, Shank SD, Spielman SJ. Datamonkey 2.0: a modern web application for characterizing selective and other evolutionary processes. Mol Biol Evol. 2018;35:773–777.
- Zhang J, Nielsen R, Yang Z. Evaluation of an improved branch-site likelihood method for detecting positive selection at the molecular level. Mol Biol Evol. 2005;22:2472–2479.
- Kosakovsky Pond SL, Frost SDW. Not so different after all: a comparison of methods for detecting amino acid sites under selection. Mol Biol Evol. 2005;22:1208–1222.
- Murrell B;, Moola S;, Mabona A;. FUBAR: a fast, unconstrained bayesian approximation for inferring selection. Mol Biol Evol. 2013;30:1196–1205.
- Murrell B, Wertheim JO, Moola S. detecting individual sites subject to episodic diversifying selection. PLoS Genet. 2012;8:e1002764.
- Pond SLK, Murrell B, Poon AFY. Evolution of viral genomes: interplay between selection, recombination, and other forces. Methods Mol Biol Clifton NJ. 2012;856:239–272.
- Gruber AR, Findeiß S, Washietl S. RNAz 2.0: improved noncoding RNA detection. Pac Symp Biocomput Pac Symp Biocomput. 2010;69–79.
- Chan JF-W, Kok K-H, Zhu Z. Genomic characterization of the 2019 novel human-pathogenic coronavirus isolated from a patient with atypical pneumonia after visiting Wuhan. Emerg Microbes Infect. 2020;9:221–236.
- Chen N, Zhou M, Dong X. Epidemiological and clinical characteristics of 99 cases of 2019 novel coronavirus pneumonia in Wuhan, China: a descriptive study. The Lancet. 2020;395(10223):507–513.
- Voskarides K. SARS-CoV-2: tracing the origin, tracking the evolution. BMC Med Genomics. 2022;15:62.
- Li L, Wang J, Ma X. A novel SARS-CoV-2 related coronavirus with complex recombination isolated from bats in Yunnan province, China. Emerg Microbes Infect. 2021;10:1683–1690.
- Lytras S, Hughes J, Martin D. Exploring the natural origins of SARS-CoV-2 in the light of recombination. Genome Biol Evol. 2022;14:evac018.
- Challender DWS, Heinrich S, Shepherd CR. Chapter 16 – International trade and trafficking in Pangolins, 1900–2019. In Pangolins. In: Challender DWS, Nash HC, Waterman C, editors. Biodiversity of world: conservation from genes to landscapes. Academic Press; 2020. p. 259–276.
- Xiao X, Newman C, Buesching CD. Animal sales from Wuhan wet markets immediately prior to the COVID-19 pandemic. Sci Rep. 2021;11:11898.
- Cui J, Li F, Shi Z-L. Origin and evolution of pathogenic coronaviruses. Nat Rev Microbiol. 2019;17:181–192.
- Cyranoski, D. Did pangolins spread the china coronavirus to people? Available online: https://www.nature.com/articles/d41586-020-00364-2 (accessed on 2020 Aug 28).
- El-Sayed A, Kamel M. Coronaviruses in humans and animals: the role of bats in viral evolution. Environ Sci Pollut Res. 2021;28:19589–19600.
- Zhou P, Yang X-L, Wang X-G. A pneumonia outbreak associated with a new coronavirus of probable bat origin. Nature. 2020;579:270–273.
- Lau SKP, Wong EYM, Tsang -C-C. Discovery and sequence analysis of four deltacoronaviruses from birds in the middle east reveal interspecies jumping with recombination as a potential mechanism for avian-to-avian and avian-to-mammalian transmission. J Virol. 2018;92.
- Andersen KG, Rambaut A, Lipkin WI. The proximal origin of SARS-CoV-2. Nat Med. 2020;26:450–452.
- Shi J, Wen Z, Zhong G. Susceptibility of ferrets, cats, dogs, and other domesticated animals to SARS-Coronavirus 2. Science. 2020;368:1016–1020.
- Menachery VD, Graham RL, Baric RS. Jumping species—a mechanism for coronavirus persistence and survival. Curr Opin Virol. 2017;23:1–7.
- Forni D, Cagliani R, Sironi M. Recombination and Positive selection differentially shaped the diversity of betacoronavirus subgenera. Viruses. 2020;12:1313.
- Rochman ND, Wolf YI, Faure G. Ongoing global and regional adaptive evolution of SARS-CoV-2. Proc Natl Acad Sci. 2021;118:e2104241118.
- Berrio A, Gartner V, Wray GA. Positive selection within the genomes of SARS-CoV-2 and other coronaviruses independent of impact on protein function. PeerJ. 2020;8:e10234.
- Velazquez-Salinas L, Zarate S, Eberl S. Positive selection of ORF1ab, ORF3a, and orf8 genes drives the early evolutionary trends of SARS-CoV-2 during the 2020 COVID-19 pandemic. Front Microbiol. 2020 11 ;550674.
- Huston NC, Wan H, Strine MS. Comprehensive in vivo secondary structure of the SARS-CoV-2 genome reveals novel regulatory motifs and mechanisms. Mol Cell. 2021;81:584–598.e5.
- Yurkovetskiy L, Wang X, Pascal KE. Structural and functional analysis of the D614G SARS-CoV-2 spike protein variant. Cell. 2020;183:739–751.e8.
- Chakraborty S. Evolutionary and structural analysis elucidates mutations on SARS-CoV2 spike protein with altered Human ACE2 binding affinity. Biochem Biophys Res Commun. 2021;534:374–380.
- Cheng VCC, Lau SKP, Woo PCY. Severe acute respiratory syndrome coronavirus as an agent of emerging and reemerging infection. Clin Microbiol Rev. 2007;20:660–694.
- Shi Z, Wang L-F. Evolution of SARS Coronavirus and the relevance of modern molecular epidemiology. Genet Evol Infect Dis. 2017:601–619
- Song H-D, Tu -C-C, Zhang G-W. Cross-host evolution of severe acute respiratory syndrome coronavirus in palm civet and human. Proc Natl Acad Sci U S A. 2005;102:2430–2435.
- Min J, Cella E, Ciccozzi M. The global spread of middle east respiratory syndrome: an analysis fusing traditional epidemiological tracing and molecular phylodynamics. Glob Health Res Policy. 2016;1:14.
- Cotten M, Watson SJ, Zumla AI. Spread, circulation, and evolution of the Middle East respiratory syndrome coronavirus. mBio. 2014;5:e01062–13.
- Cotten M, Watson SJ, Kellam P. Transmission and evolution of the Middle East respiratory syndrome coronavirus in Saudi Arabia: a descriptive genomic study. Lancet Lond Engl. 2013;382:1993–2002.
- Assiri A, McGeer A, Perl TM. Hospital outbreak of Middle East respiratory syndrome coronavirus. N Engl J Med. 2013;369:407–416.
- Xia X. Dating the common ancestor from an NCBI tree of 83688 high-quality and full-length SARS-CoV-2 genomes. Viruses. 2021;13:1790.
- Nie Q, Li X, Chen W. Phylogenetic and phylodynamic analyses of SARS-CoV-2. Virus Res. 2020;287:198098.
- Chaw S-M, Tai J-H, Chen S-L. The origin and underlying driving forces of the SARS-CoV-2 outbreak. J Biomed Sci. 2020;27:73.
- Pekar J, Worobey M, Moshiri N. Timing the SARS-CoV-2 index case in Hubei Province. Science. 2021;372:412–417.
- Keng C-T, Choi Y-W, Welkers MRA. The human severe acute respiratory syndrome coronavirus (SARS-CoV) 8b protein is distinct from its counterpart in animal SARS-CoV and down-regulates the expression of the envelope protein in infected cells. Virology. 2006;354:132–142.
- Oostra M, de Haan CAM, Rottier PJM. The 29-nucleotide deletion present in human but not in animal severe acute respiratory syndrome coronaviruses disrupts the functional expression of open reading frame 8. J Virol. 2007;81:13876–13888.
- Omrani AS, Al-Tawfiq JA, Memish ZA. Middle East respiratory syndrome coronavirus (MERS-CoV): animal to human interaction. Pathog Glob Health. 2015;109:354–362.
- Raj VS, Mou H, Smits SL. Dipeptidyl peptidase 4 is a functional receptor for the emerging human coronavirus-EMC. Nature. 2013;495:251–254.
- Hoffmann M, Kleine-Weber H, Schroeder S. SARS-CoV-2 cell entry depends on ACE2 and TMPRSS2 and is blocked by a clinically proven protease inhibitor. Cell 2020; 181:271–280.
- Kim C-H. SARS-CoV-2 evolutionary adaptation toward host entry and recognition of receptor O-acetyl sialylation in virus–host interaction. Int J Mol Sci. 2020;21.
- Walls AC, Park Y-J, Tortorici MA. Function, and antigenicity of the SARS-CoV-2 spike glycoprotein. Cell. 2020;181:281–292.e6.
- Bermudez-Santana CI, Gallego-Gómez JC. Toward a taxonomy of virus-NcRNAs Interactions in an RNA world for disentangling some tiny secrets of dengue virus Preprints. 2021. doi: 10.20944/preprints202111.0385.v1.
- Simmonds P. Pervasive RNA secondary structure in the genomes of SARS-CoV-2 and other coronaviruses. mBio 2020. 11.
- Yang D, Leibowitz JL. The structure and functions of coronavirus genomic 3′ and 5′ ends. Virus Res. 2015;206:120–133.
- Manfredonia I, Incarnato D. Structure and regulation of coronavirus genomes: state-of-the-art and novel Insights from SARS-CoV-2 studies. Biochem Soc Trans. 2021;49:341–352.
- Sun L, Li P, Ju X. In vivo structural characterization of the SARS-CoV-2 RNA genome identifies host proteins vulnerable to repurposed drugs. Cell. 2021;184:1865–1883.e20.
- Lan TCT, Allan MF, Malsick LE. Secondary structural ensembles of the SARS-CoV-2 RNA genome in infected cells. Nat Commun. 2022;13:1128.
- Zhang K, Zheludev IN, Hagey RJ. Cryo-EM and antisense targeting of the 28-KDa frameshift stimulation element from the SARS-CoV-2 RNA genome. Nat Struct Mol Biol. 2021;28:747–754.