
ABSTRACT
Given the challenges for the experimental determination of RNA tertiary structures, probing solvent accessibility has become increasingly important to gain functional insights. Among various chemical probes developed, backbone-cleaving hydroxyl radical is the only one that can provide unbiased detection of all accessible nucleotides. However, the readouts have been based on reverse transcription (RT) stop at the cleaving sites, which are prone to false positives due to PCR amplification bias, early drop-off of reverse transcriptase, and the use of random primers in RT reaction. Here, we introduced a fixed-primer method called RL-Seq by performing RtcB Ligation (RL) between a fixed 5′-OH-end linker and unique 3′-P-end fragments from hydroxyl radical cleavage prior to high-throughput sequencing. The application of this method to E. coli ribosomes confirmed its ability to accurately probe solvent accessibility with high sensitivity (low required sequencing depth) and accuracy (strong correlation to structure-derived values) at the single-nucleotide resolution. Moreover, a near-perfect correlation was found between the experiments with and without using unique molecular identifiers, indicating negligible PCR biases in RL-Seq. Further improvement of RL-Seq and its potential transcriptome-wide applications are discussed.
Introduction
RNA molecules play crucial cellular roles such as regulations of gene expression, translation, and splicing via interacting with other biological macromolecules. RNAs, similar to proteins, perform a wide variety of functions by folding into various secondary (base-pairing) or tertiary (three-dimensional) structures through stacking and hydrogen bonding across the strands [Citation1,Citation2]. However, determining RNA tertiary structures by biophysical techniques is more challenging than determining protein structures because of their flexible and dynamic natures. As a result, RNA structures make up less than 3% of all structures in the Protein Data Bank (PDB) [Citation3]. Addressing this challenge has led to the development of an array of enzymatic and chemical structural probes [Citation4,Citation5].
One of the most important and simplified measures of RNA structures is solvent accessible surface area (SASA) [Citation6]. This one-dimensional representation of RNA tertiary structures can identify bases exposed to or buried from the solvent and has been employed for detecting hotspots at protein–RNA interfaces [Citation7]. In addition, it is used for examining the conformational changes resulted from binding with other molecules [Citation8], analysing structural differences among denatured, in vitro, and in vivo states [Citation2,Citation9] and determining disease-causing genetic variants [Citation10].
Cell-permeable dimethyl sulphide (DMS) was employed as a probe in DMS-Seq for monitoring in vitro and in vivo solvent accessible, unpaired bases at the transcriptome scale [Citation9]. The method was further improved by using thermostable group II intron reverse transcriptase during the sequencing library preparation (DMS-MaPseq) [Citation11]. Nicotinoyl-azide (NaZ) is another probe for RNA solvent accessibility introduced by Feng et al. [Citation12] with subsequent development as LASER-Seq, LASER-Map [Citation13], and icLASER [Citation14]. However, commonly used reactivity readouts (reverse transcription (RT) stop or mutational profiling (MaP)) are not enriched based on their abundance during sample preparation. The cDNA library is often prepared using random primers for reverse transcription (for recent reviews, please see [Citation4,Citation5,Citation15]), which leads to non-uniform coverage and overrepresentation of copy numbers in the subsequent rounds of amplification for sequencing library preparation [Citation16]. Reverse transcriptase also suffers from drop-off without completing the reaction [Citation17] and the lack of exonuclease or ‘proofreading’ activity, which may induce mutational errors in the nascent cDNA [Citation18,Citation19] independent of probe-induced modifications. These limitations necessitate the use of an untreated control library to isolate chemical probing signal from the background noise. Furthermore, DMS (reactive to unpaired N1-A and N3-C only) and NaZ (reactive to C8-G and C8-A only) probes do not cover all nucleotides [Citation20].
Hydroxyl radical is perhaps the only known probe that provides a unbiased detection of all accessible nucleotides [Citation21,Citation22] because it reacts with the ribose backbone, rather than specific nucleobases. It has been found that hydroxyl radicals can make cleavage with the same efficiency regardless of whether bases are paired or not [Citation22] and the level of its cleavage reflects the actual degree of exposure to the solvent of a nucleotide [Citation23]. However, like other chemical probing techniques, hydroxyl radical footprinting (HRF-Seq) does not enrich for modified transcripts and suffers from highly variable sequencing coverage due to the use of random hexamer primers when constructing the cDNA library. As a result, hydroxyl-radical-based probing of SASA (HRF-Seq [Citation24]) requires high sequencing depth even for a single RNA chain. We found that the correlation with 16S rRNA significantly degrades if the average sequencing depth is <104.
In this study, we propose a technique (RL-Seq or RtcB Ligation-Seq) for probing RNA solvent accessibility by taking advantage of the unique 3′-P ends generated by hydroxyl radicals and the ability of RtcB ligase to ligate a 3′-P-end fragment with a pre-defined 5′-OH-end linker. Using a pre-defined linker allows the use of a fixed primer for reverse transcription and detection of the probed sites with improved efficiency by selectively capturing cleaved fragments based on their relative abundance in the library. We demonstrated this technique by probing the SASA of E. coli ribosomal complexes at the single-nucleotide resolution and confirmed its advantages associated with the use of a fixed primer.
Method and materials
Materials
We employed E. coli DH5α for all routine cloning, E. coli BL21 (DE3) for protein expressions, nutrient-rich LB-agar plate for bacterial growth, and LB-Miller media for bacterial cell culture. All primers and DNA oligonucleotides were purchased from Sigma-Aldrich and RNA oligonucleotides were synthesized by Integrated DNA Technologies (IDT, Singapore 117,610). Primers, RNA oligonucleotides, and template switching oligonucleotide (TSO) sequences are shown in Supplementary Table S1. The E. coli (strain B) ribosome was bought from the New England BioLabs (NEB).
Expression and purification of RtcB ligase
RtcB ligase is an RNA ligase that makes a GTP-dependent ligation of 5′ – hydroxyl ends with 3′ – or 2′, 3′-cyclic phosphates [Citation25]. In this work, RtcB ligase was expressed and purified in-house. Firstly, the coding sequence of RtcB ligase was amplified by PCR from the genomic DNA of E. coli K-12 MG1655. After being cloned into the expression vector pET15-MHL by Gibson Assembly, the RtcB coding sequence was fused with N-terminal 6-histidine tag. The expression plasmid was sequencing confirmed, and then transferred into E. coli BL21 (DE3) for expression.
To express the RtcB protein, a single colony from the agar plate was cultured overnight in 100 mL of LB media containing 100 ug/mL Amp. In the following day, the culture was re-inoculated into 4 L of LB media (10 mL overnight culture/1 L fresh media) containing 100 ug/mL Amp and kept shaking at 180 rpm for 4 h at 37°C until the OD600 reaches 0.6–0.8. The culture flask is then chilled with ice for 30 m. Expression was induced with 0.1 mM isopropylthiogalactoside (IPTG), and cultures were grown for 16 h at 17°C. The resulting cells were harvested by centrifugation at 10,000 × g and the pellet was re-suspended in His-buffer A (50 mM Tris-HCl pH 7.4, 150 mM NaCl, 20 mM Imidazole, and 0.5 mM DTT) and lysed by sonication (5 s on, 25s off, 15 cycles; 30 amplitude). Finally, the cell lysate was centrifuged at 20,000 × g and the supernatant was taken for affinity-based Ni-NTA (HisTrap FF crude 1 ml column) purification. Then, the size-exclusion GEL filtration (HiPrep 26/60 Sephacryl S-500 HR column) was used for further purification. All apparatus and buffers used in the purification steps were kept RNase-free.
RtcB ligation assay
The activity of the purified recombinant RtcB ligase was tested to confirm its function. A 3′-P end-containing rM13R (18nt long) was incubated with FAM-fluorophore tagged 5′-OH end-containing R10-FAM (10 nt long) at an equimolar concentration (20 pmol). The reaction was performed for 1 h at 37°C in the presence of 1× RtcB reaction buffer (50 mM Tris-HCl, 75 mM KCl, 3 mM MgCl2, and 10 mM DTT at pH 8.3) supplemented with 1 mM GTP and 10 mM MnCl2 in a RNase free condition. The ligation was terminated by using 2× RNA loading dye (95% formamide, 0.025% SDS, 0.025% bromophenol blue, 0.025% xylene cyanol FF, 0.025% ethidium bromide, and 0.5 mM EDTA), denatured at 80°C for 2 m. Then, the samples were loaded on 10% polyacrylamide gels containing 7 M urea in 1× TBE buffer (1 M Tris base, 1 M Boric acid, and 0.02 M EDTA). The urea-PAGE gel was pre-run for 30 m at 150 V before loading the samples and SYBR-Gold (Invitrogen) staining was used to visualize the bands. FAM containing oligonucleotides were visible without staining on the blue light trans-illuminator.
E. coli ribosome preparation
The ribosome was supplied in the storage buffer consisting of 20 mM HEPES-KOH (pH 7.6), 10 mM Mg(OAc)2, 30 mM KCl, and 7 mM beta-mercaptoethanol. An intact E. coli ribosome (70S) consists of two subunits: a large (50S) subunit and a small (30S) subunit along with about 55 ribosomal proteins. The large subunit is composed of a 23S RNA subunit (2900 nucleotides), a 5S RNA subunit (120 nucleotides), and ~36 proteins. The small subunit contains 16S RNA (1540 nucleotides) and ~22 proteins [Citation26]. Before the ribosome was employed in probing reactions, the storage buffer was exchanged with 1× HRP (hydroxyl radical probing) buffer (50mM Sodium cacodylate, 50 mM Magnesium acetate, 150 mM KCl, pH: 7.4) by DyEx 2.0 spin kit (QIAGEN).
Hydroxyl radical probing
The peroxidative Fenton chemistry protocol was utilized for the probing reaction as previously described [Citation22]. Briefly, freshly prepared three droplets, 1 μL each, of 10 mM ferrous ammonium sulphate, 20 mM EDTA, 10 mM sodium ascorbate, and 0.6% H2O2 were placed on the inside wall of a tube containing 7 μL prepared substrates (intact ribosomes, optimized concentration of 3.5 μg in total). The tubes were vigorously vortexed to mix with the reagents and after 60s; the reaction was stopped by adding 1 μL of 100 mM thiourea. Afterwards, the solution was immediately placed on ice and proceeded to purification. The ribosomal proteins and other probing reaction materials were removed by using the Zymo spin IC column (ZYMO RESEARCH). A control reaction was performed in parallel, but with the addition of 3 μL of H2O instead of the three aforementioned droplets. The pattern of partial cleavage of the ribosomes was visualized by 5% urea-PAGE denaturing gel electrophoresis.
Capturing hydroxyl radical probed sites
A 5′-OH end and 3′-desthiobiotin-TEG modified ribonucleotide linker (rM13, 18 nt long) was designed and synthesized from IDT. The 5′-OH end of the linker acts as an RNA acceptor molecule (accepts 3′-P end of probed fragments) in the RtcB ligation reaction. The reaction condition was following that described by Peach et. al. [Citation27]. Briefly, 2 μl of 20 μM linker and 140 ng of purified probed RNA were added to the 20 μl reaction system, which contained 1 μl RtcB ligase (15 μM), 2 μl RtcB buffer (50 mM Tris-HCl, 75 mM KCl, 3 mM MgCl2, 10 mM DTT, pH 8.3), 2 μl MnCl2 (10 mM), 2 μl GTP (1 mM), and 0.5 ul Murine RNase inhibitor (NEB). The solution was incubated at 37°C for 1 h. The ligated product was then purified by Zymo-spin IC column (ZYMO RESEARCH) following the manufacturer’s instruction for downstream reactions.
Sequencing library preparation
Two sequencing libraries, with or without a unique molecule identifier (UMI), were prepared following the modified Illumina library preparation protocol. Briefly, a total of 200 ng purified ligated RNA was subjected to a 20 μl volume fragmentation reaction system. The reaction was performed in a 10× RNA fragmentation buffer of NEBNext Magnesium RNA Fragmentation Module (NEB) and incubated at 94°C for 5 m which produced 150–200 nucleotide fragments. The reaction was stopped immediately by transferring the reaction tube onto ice.
We used ProtoScript II RT (NEB) to convert RNA to cDNA. ProtoScript II is a recombinant Moloney murine leukaemia virus (MMLV) reverse transcriptase with reduced RNase H activity and increased thermostability. This enzyme produces full-length cDNA along with the template-switching activity in a single-step reaction [Citation28]. To synthesize the first-strand cDNA, we employed a primer (RT1_m13f_adp1 without UMI or RT1_m13f_18N_adp1 with UMI) which was partly complementary to previously used rM13 linker and an oligonucleotide sequence (ADP2-rTS) for template switching. The reaction condition was followed according to the available NEB protocol. Briefly, 2 μl of purified probed RNA was mixed with 2 μl of primer, 2 μl of template switching oligonucleotide, and 4 μl nuclease-free H2O in a reaction system and incubated at 72°C for 2 m and, then, chilled with the ice-water bath immediately for 2 m. Afterwards, 4 μl of 5× ProtoScript II buffer, 2 μl DTT (0.1 M), 1 μl ProtoScript II RT (200 U/μl), 0.2 μl RNase inhibitor (40 U/μl) and 1 μl dNTPs (10 mM) were added in the previous reaction mixture and incubated at 42°C for 1 h. Finally, the synthesized single-stranded cDNA was purified by using DNA purification silica column (QIAGEN).
Next, the double-stranded DNA containing Illumina sequencing platform-specific adaptors were synthesized by using forward (P5R1_adp1) and reverse (P7R2_adp2) primers via PCR reaction. In the PCR reaction, 15 μl of template was added in the master mixture containing 5 ul of 10X Taq standard buffer, 1 μl of 10 mM dNTPs, primers (1 μl each), and 0.25 μl of Taq DNA polymerase and amplified for 18 cycles. The PCR reaction was incubated by the following temperature profile: (2 m, 95°C) ×1; (15 s, 95°C; 15s, 55°C; 30s, 72°C) ×18; and (2 m, 72°C) ×1. The sequencing library was assessed by qPCR and bioanalyzer for quality control and purified on Ampure XP beads before being sequenced on the Illumina HiSeqX platform with the 2 × 150 paired-end protocol.
RL-Seq sequencing data analysis
Two datasets (with or without UMI) were obtained by Illumina HiSeqX. We selected reads that contained the RT primer at the 3′-end for downstream analysis. The BBDuk utility of BBTools v37.02 (https://jgi.doe.gov/data-and-tools/bbtools/) was utilized for removing the contaminating adapter sequences and to filter out low-quality ends. The pre-processed sequence pairs were then used as input for Trinity [Citation29] to assemble the strain-specific 23S, 16S, and 5S rRNA sequences (Table S2). The mapping of short pre-processed reads was performed via Bowtie-2 [Citation30] and the mapped reads were used to estimate the cleavage events. The cleavage events at each nucleotide were retrieved from the SAM file (generated in Bowtie-2) using an in-house python script. Sequencing depth was computed from all mapped reads using the bedtools genomecov utility [Citation31]. The SASA estimated from RL-Seq was obtained by taking the log2 value of observed cleavage events normalized by the sequencing library depth. The probing signal was averaged within a 3-nucleotide window and residues at terminal extremes were masked to mitigate edge effects.
To identify potential sources of library preparation bias, we extracted relevant sequence motifs from terminal regions of reads from the probed library and the surrounding genomic context after mapping to the reference. Sequence logos were generated using the python Logomaker library. Loci containing an enriched sequence motif were masked as a post-processing step during analysis to mitigate the effect of a small number of outliers.
Solvent accessibility calculation
The SASA of the published X-ray crystal structure of E. coli ribosome (PDB ID: 4V7T) was calculated using BioPython with a probe radius of 3.0 Å as in HRF-Seq [Citation24]. All-atom, nucleotide-level solvent accessibility was averaged in a 3-nt window for comparison with probing signal. We also examined the dependence of method performance on probe radii and window sizes.
HRF-Seq analysis
To compare with the previous method based on hydroxyl radical probing, we downloaded the control and treated libraries available from https://people.binf.ku.dk/jvinther/data/HRF-Seq/ and prepared the data for analysis as described in the corresponding publication [Citation24]. Briefly, read through Illumina adapters were trimmed with Cutadapt [Citation32] with a minimum size of 40 nucleotides. The seven nucleotide UMIs were extracted using the pre-processing utility available from https://github.com/lkie/RNAprobBash/. Reads were mapped to the reference sequence by bowtie2 with – × 700, – N 1, and – L 15 – norc flags. The summarize_unique_barcodes utility was used to trim non-templated additions and deduplicate the UMIs. Finally, ΔTCR (Termination Cleavage Ratio of a given position) was computed with a window size of 3 and 1-nucleotide offset after excluding fragments shorter than 100 nucleotides using the RNAProbR R package.
Results
RtcB ligase purification and activity verification
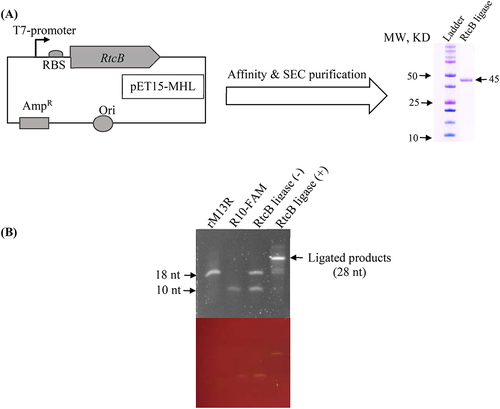
As shown in , RtcB ligase used in this study was expressed in E. coli with N-terminal 6× His tag and purified by Ni-NTA affinity chromatography and size-exclusion GEL filtration. The purity of RtcB ligase was confirmed by the sodium dodecyl sulphate-polyacrylamide gel electrophoresis (SDS-PAGE) and stored in a Rnase-free storage buffer (50 mM Tris-HCl, 150 mM NaCl, 10% glycerol, 2 mM EDTA, and 10 mM DTT, pH 7.4). The concentration of the protein was measured by the BCA method and fixed to 15 μM before it was aliquoted into microcentrifuge tubes to store at −80°C for later usage. As shown in , we confirmed RtcB ligation activity by using Urea-PAGE gel electrophoresis after mixing with synthetic oligonucleotides (3′-P end rM13R and 5′-OH end R10-FAM).
Figure 1. RtcB ligase purification and its activity verification. (A) Recombinant plasmid DNA was constructed so that the RtcB ligase gene sequence is under the T7 promoter in pET15-MHL vector. The construct was transferred into E. coli BL21 (DE3) competent cells for RtcB overexpression. After affinity and size exclusion column (SEC) purification, the purity was inspected by SDS-PAGE gel electrophoresis. (B) The purified RtcB ligase ligated the synthetic 3′-P-end-containing rM13R (18 nt) with the 5′-OH-end-containing R10-FAM oligoes (10 nt). The ligation reaction produced a 38 nt long ligated product, which was visualized by Urea-PAGE gel electrophoresis (upper gel is SYBR-Gold stained and lower gel is without staining).
RL-Seq protocol
illustrates the key steps used in RL-Seq. It starts with hydroxyl radicals produced by the Fenton reaction to cleave the solvent-exposed sites of the studied RNA complex (Supplementary Figure S1). The intensity of the cleavage was optimized by visualizing the gel electrophoresis (). The cleaved sites were then ligated to the rM13 linker by RtcB ligase. This is followed by cDNA synthesis employing the template-switching activity of the MMLV reverse transcriptase and a fixed RT primer annealed with the ligated rM13 linker (Supplementary Table S1). For the UMI-containing library, 18 random nucleotides were added to the fixed RT primer. The cDNA libraries were subjected to PCR amplification with the Illumina-platform compatible adaptors prior to the paired-end high-throughput sequencing.
Figure 2. The main experimental steps of RL-Seq method. (1) Hydroxyl radicals (•OH) were generated from the Fenton reaction for probing RNA or RNA-protein complex in vitro. (2) Solvent exposed areas (blue arrow) are cleaved by reacting with •OH to create 3′-phosphate (3′-P) ends, whereas buried regions are not accessible to •OH (black dot). (3) The 3′-P ends of cleaved fragments were ligated with the 5′-OH ends of the rM13 linker by RtcB ligase. (4) The purified ligated products are fragmented chemically and selected for those between 150 and 200 nt long. (5) A linker-specific primer was used to synthesized cDNA by reverse transcriptase enzyme. (6) Sequencing platform-specific adapters are added at 5′ and 3′ ends by PCR reaction for high-throughput sequencing. (7) Sequencing data analysis.
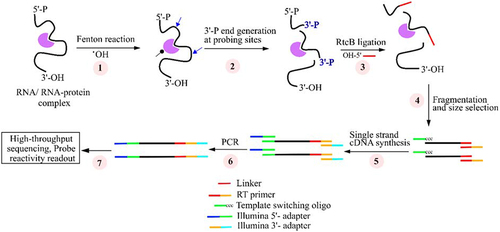
Figure 3. Optimizing the intensity of hydroxyl radical cleavage of ribosomal RNA. Excessive cleavage was resulted from a low concentration of RNA, high concentration of H2O2 or longer incubation time (not shown here). (A) According to the previous studies, we have fixed the concentration of H2O2 at 0.6% and incubation time at 1 m, then increased the concentration of RNA (0.5–4 ug in total). The Urea-PAGE gel image showed that higher the concentration of RNA, the lower the cleavage ratio. (B) Finally, we have determined 3.5 ug rRNA in total as an optimum concentration for hydroxyl radical probing. Here, M: 1kb – plus DNA ladder, Untreated: Without •OH probing, and Treated: probing with •OH.
RL-Seq performance on 16S, 23S, and 5S rRNA
The reference SASA values of 16S, 23S, and 5S subunits were calculated from their high-resolution complex structures from X-ray crystallography (4V7T) [Citation33]. These SASA values are compared to log2 values of observed cleavage events from RL-Seq normalized by the sequencing library depth. We obtained both RL-Seq results with and without UMI.
compares the results for 16S rRNA. The first observation is that there is agreement between the probing results with (grey) and without UMI (black) de-duplication with Pearson Correlation Coefficient (PCC) of 0.814 between them. The same is true for 23S (Supplementary Figure S2) with PCC = 0.788 and 5S with PCC = 0.847 (Supplementary Figure S3).
Figure 4. RL-Seq analysis of 16S ribosomal subunits. (A) & (C) Plot of chemical probing signal averaged in a 3-nt window with (grey) and without UMI deduplication (black), from 1–769 and 770–1538, respectively. Probing signal is normalized to account for the difference in sequencing depth between the libraries. (B) & (D) Plot of SASA averaged in a 3-nt window of 16S rRNA extracted from 4V7T assembly 1 from 1–769 and 770–1538, respectively. Masked terminal ends and ACUG sites were shown in blue and grey, respectively. (E) Correlation (SCC = Spearman’s correlation coefficient) between SASA and chemical probing signal without UMI deduplication. (F) Correlation between SASA and chemical probing signal with UMI deduplication.
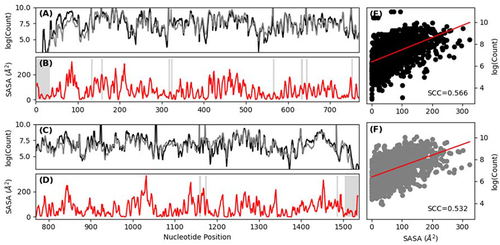
More importantly, the probing signal is also correlated with solvent accessibility. This is demonstrated for the 16S subunit without () and with UMI (). Similar observations were made for 23S (Supplementary Figure S2) and 5S (Supplementary Figure S3) rRNA. The Spearman’s correlation coefficient (SCC) values between SASA and RL-Seq signals are 0.566 (no UMI) and 0.532 (with UMI deduplication) for 16S, 0.472 (no UMI) and 0.500 (with UMI deduplication) for 23S and 0.392 (no UMI) and 0.518 (with UMI) for 5S, respectively. It is noted that these correlations are obtained by comparing RL-Seq signals to rRNA SASA extracted from protein-RNA complex structures. When we compared the probing signal to SASA extracted from each chain in isolation, the correlation was reduced due to underestimation of the exposure of regions that were protected by binding partners in the ribosomal complex (Supplementary Figure S4).
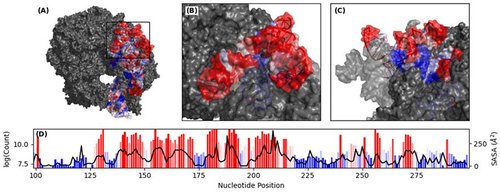
The agreement is more apparent in the Cartesian space. An exposed, contiguous 200-nucleotide ribosome fragment (highlighted in red, ) displays high sequencing counts consistent with the extreme exposure to the solvent independent of their relative sequence positions (). That is, highly exposed surface residues that are neighbouring in the tertiary conformation can be found at sites that are remote in the primary sequence. Similarly, the buried helix (in blue) is also recapitulated by the RL-Seq signal. Moreover, the PCC of probing signals between base-paired nucleotides at single-nucleotide resolution has a moderate correlation coefficient of 0.384 (not shown), which is consistent with the idea that physically contacting bases are likely to have correlated SASA.
Figure 5. Surface representation of 16S rRNA. (A) Ribosome assembly extracted from PDB: 4V7T with 16S rRNA coloured based on RL-Seq signal. (B) Close up image of 16S rRNA between residues 99–299. (C) Rotated image of 16S rRNA residues 99–299. (D) Bar plot of chemical probing signal at single nucleotide resolution between residues 99–299 with SASA extracted from PDB: 4V7T overlayed as a line plot.
Comparison with HRF-Seq
We compared the performance of RL-Seq to the existing hydroxyl radical probing method: HRF-Seq [Citation24]. HRF-Seq utilizes random hexamer primers for RT-PCR and identifies cleavage sites by the frequency of RT-stops relative to RT-stop frequency in the untreated control. HRF-Seq was also applied to E. coli ribosomes, however, at the sequencing depth of 105, only the result for 16S rRNA was reported due to sample preparation issues. In addition, the size-selection step during HRF-Seq sample preparation meant that 3′ fragments that were cleaved in the final ~150 positions could not be captured. By comparison, RL-Seq can obtain statistically meaningful results for 16S, 23S, and 5S at the sequencing depth of 4 × 10² (see below) and missed only ~35 terminal bases due to the shorter fragment size employed in RL-Seq. To facilitate a comparison between the two approaches, we have masked 35 nucleotides from the 5′-end and 150 nucleotides at the 3′ end to mitigate edge effects. Moreover, we down-sampled the sequencing libraries to simulate the probing performance at low sequencing depth. We also report correlations between solvent accessibility at the nucleotide level, ribose level and considering C4′ and C5′ atoms only (). We report results using the processed data provided by the authors (HRF*) alongside the data reproduced by us (HRF).
Figure 6. Comparison between RL-Seq and HRF-Seq of 16S rRNA. First row: Nucleotide-level SASA (A) Evaluation of SCC between SASA and OH probing based on simulated sequencing depth. (B) Effect of probe size on SCC. (C) Effect of window size on SCC. Second row: Ribose-level SASA (D) Evaluation of SCC between SASA and OH probing based on simulated sequencing depth. (E) Effect of probe size on SCC. (F) Effect of window size on SCC. Third row: Atom-level SASA (G) Evaluation of SCC between SASA and OH probing based on simulated sequencing depth. (H) Effect of probe size on SCC. (I) Effect of window size on SCC.
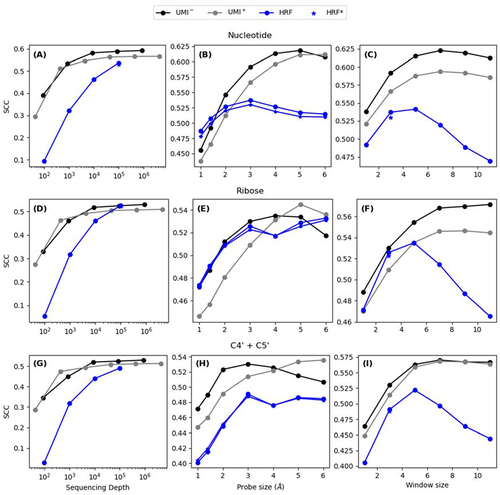
shows that RL-Seq consistently outperforms HRF-Seq at all sequence depths for the SCC values for 16S rRNA. More importantly, RL-Seq is more robust against a reduction in sequencing depth. SCC reduced from 0.565 at 4 × 10⁵ to 0.546 at 4 × 10³ sequence depth by RL-Seq, compared to from 0.537 at 105 to 0.321 at 103 by HRF-Seq. Another interesting observation is that SCC values improve when a probing radius larger than water molecule (1.4 Å) was used. SCC values peaked at 3 Å for HRF-Seq but at 5 Å for our method, RL-Seq (). If we employed 5 Å as a probe size for RL-Seq, we would have an even bigger improvement over HRF-Seq with a SCC of 0.618 for UMI – and 0.611 for UMI+. We also see that a larger window (>3) would further improve our correlations whereas HRF-Seq reaches a peak at 3 (). Interestingly, the HRF-seq signal is only moderately correlated with the RL-Seq score with SCC = 0.443.
Template switching bias by RL-Seq
From the sequence logo (Supplementary Figure S5), we identified a clear preference for ACUG immediately downstream of the apparent cleavage sites. This sequence motif corresponds to the 5′ terminus of the rM13 adapter that was ligated with terminal 3′-P residues to indicate fragment cleavage sites. Although this type of artefact is often attributed to RT internal mispriming [Citation34,Citation35], we prepared an additional control library without ligation of rM13 by RtcB and did not observe the spurious PCR amplification that would be expected by this mechanism (Supplementary Figure S6). The off-target amplification re-appeared when adding rM13 without the RtcB enzyme (Supplementary Figure S6). This indicates that the observed bias towards ACUG fragments is most likely an artefact caused by template switching from the excess un-ligated rM13 adapters to free rRNA fragments with a 3′-ACUG motif [Citation36]. After filtering sites that terminate immediately prior to an ACUG motif, the sequence logo was indistinguishable from the background.
Consistent with prior studies [Citation37], we also identified a Guanosine (G) bias at the Illumina adapter template-switching site (Supplementary Figure S7) (Note that the GGG from the TSO was trimmed from the reads prior to downstream analysis). Overall, >90% of reads in the UMI+ library appear to template switch with the TSO at a G site (>75% in the UMI – library). It is likely that this is driven by the relative kinetics of the non-templated addition leading to an enrichment of fragments with G at the template-switching sites [Citation38]. A demonstrated preference for G-sites in the template-switching reaction may bias observed cleavage events based on typical fragment size and frequency of G-rich motifs 5′ to the RNA cleavage site which will contribute noise to the readout at all loci.
Similarly, the insert size distribution skews significantly shorter than the expected fragment size of 150–200 nucleotides (Supplementary Figure S7). This is likely a consequence of premature RT-stops induced by stable RNA secondary structures. Unlike HRF-Seq, whereby premature RT-stops manifest as false-positive cleavage sites, in RL-Seq the RT reaction must go to completion to incorporate Illumina sequencing adapters for downstream processing. In this case, fragments containing premature RT-stops are lost and the resulting library is enriched with short fragments that are less likely to contain sites susceptible to RT-stop conditions (such as stable secondary structure elements).
DISCUSSION
Here we developed the RL-Seq method for detecting probe reactive sites in RNA structure. This method takes advantage of the unique 3′-P end generated by •OH cleavage of the solvent-exposed residues of RNA and the ability of RtcB ligase to only ligate 3′-P/2′, 3′ – cyclic phosphate end with 5′-OH-end containing fragments. In other words, RtcB can add a unique 5′-OH-end linker to the cleavage site, which permits more selective enrichment, for downstream amplification, reverse transcription, and sequencing analysis. We demonstrated that RL-Seq can yield improved correlation coefficients with lower sequence depth for rRNA than HRF-Seq, which is based on random primers and RT stops.
We combat potential PCR bias by introducing terminal UMIs. UMIs can mitigate PCR amplification bias by collapsing the reads originating from the same RNA molecule into a single observation [Citation39]. However, in this pilot study, we found that UMI incorporation was unnecessary since we observed a strong agreement (PCC = 0.814 for 16S rRNA) between the RL-Seq signals with and without UMI for each of the three subunits (16S, 23S, and 5S rRNA).
Using rM13-specific primer during RT reaction allows more sensitive detection of cleavage sites by specifically enriching cleaved reads. By contrast, random hexamer primers are prone to non-uniform cDNA coverage induced by thermodynamic preferences towards GC-rich sequences [Citation40]. This was illustrated by demonstrating that reducing sequencing depths lead to a much slower decay of the correlation between structure-derived and RL-Seq measured SASA values compared with the correlation yielded from HRF-Seq (). For 16S rRNA, at a sequencing depth of 4x10², RL-Seq continues to produce a correlation of 0.512, compared to nearly zero by HRF-Seq at a depth of 1 × 10². This low sequence-depth requirement makes the transcriptome-wide application of RL-Seq much more feasible than HRF-Seq.
One interesting observation is that a larger probe radius (larger than 1.4 Å water molecule) appears to improve the correlation for both HRF-Seq and RL-Seq. For HRF-Seq, the peak performance is 3 Å. For RL-Seq, although we reported the result at 3 Å for comparison with HRF-Seq, the peak performance is 5 Å, which is roughly the size of a hydroxyl radical plus a water molecule, consistent with the existence of hemibond between a hydroxyl radical and a water molecule [Citation41]. However, it may be also due to the smoothing effect of a large probe. Similarly, while the overall trend is robust to the precise definition of solvent accessibility, we note that the strongest correlation appears to be between RL-Seq and solvent accessibility of the entire nucleotide, despite the reaction targeting the C4′/C5′ bond. We speculate that this may be due to the flexibility of the RNA backbone. Solvent accessibility is computed based on a rigid snapshot, but the chemical probing signal will reflect the average accessibility in a dynamic conformation ensemble. It is possible that the accessibility at the nucleotide level is a reasonable proxy for backbone flexibility which could explain the minor improvement in correlation found using this definition. However, more studies are required to properly address this question.
In general, 3′-end capture methods are susceptible to library preparation biases at the 5′ terminus due to the relatively short fragment size. In our analysis pipeline, we apply a conservative minimum fragment size of 15 nucleotides to ensure unambiguous mapping to the reference. However, we noticed that cleavage abundance was also significantly reduced for all loci within the first 35 positions. Given the apparent 5′ template switching bias (Supplementary Figure S7), we expect that this depletion may be related to the limited availability of favourable template switching sites upstream of extreme 5′ cleavages. We also note a depletion at the 5′ end of 16S rRNA. We believe that this is a consequence of endogenous RNA modifications inducing premature RT-stops as highlighted previously [Citation13].
One limitation of the current study is that we still observed the detachment of reverse transcriptase during RT reaction leading to an insert size distribution that was significantly shorter than expected based on the designed fragmentation conditions. A related effect is the apparent preference for template switching with G-nucleotides at the 5′-end of template RNA, which biases the library towards those reads that more efficiently made template switches with the TSO. Both of these biases may be eliminated experimentally by removing the template-switching step and introducing a 5′ adapter using an overhang in the RT-primer. The resulting cDNA libraries can be circularized followed by restriction enzyme cleavage to recover linear cDNA with the appropriate terminal adapters. This approach has been successfully utilized in iCLIP library preparation [Citation42].
When analysing the sequence logos of mapped fragments, we also noticed that apparent cleavage sites were enriched immediately upstream of ACUG motifs – comprising 78.7% of mapped reads in the UMI – library and 60.5% of reads in the UMI+ library. The above problem is likely caused by the presence of un-ligated rM13 due to excess or incomplete ligation reactions, which can form trivial duplexes with the RT primer. Residual RNaseH activity of the RT enzyme likely degrades the 5′ end of the rM13 linker when hybridized with the RT-primer. This duplex is then able to form a ternary complex between rM13, RT-primer and genome fragments that can anneal with the exposed region of the RT primer (typically containing a terminal ACUG motif). To examine this possibility, we performed RT in the presence of un-ligated rM13 (no RtcB enzyme) and in the complete absence of rM13 linkers in the reaction system. We clearly observed the amplification in the presence of free rM13 linker and a lack of amplification in the absence of rM13 (Supplementary Figure S6). It suggests that the RT primers annealed with the un-ligated rM13 and facilitated undesired template switching between the rM13 adapter and off-target RNA fragments.
Broadly speaking, the chance of an ACUG motif in random RNA sequences is 1/256. In practice, this corresponds to 18, 11 and 1 sites in E. coli 23S, 16S and 5S rRNA respectively. However, some sites with imperfect complementarity also appear to be affected by the enrichment of spurious duplexes in the sample (e.g. 1055 and 924 in 16S rRNA in Supplementary Figure S5). Notably, these imperfect matches are not enriched in the UMI+ library. In this case, the longer length of the UMI-containing RT primer likely disrupts the thermostability of the ternary complex and reduces the tolerance to mismatches at the annealing site. Although this study removed such spurious reads containing an exact match for the ACUG motif during data analysis, future experiments should remove all un-ligated linkers from the reaction system by size or length-dependent RNA purification [Citation43]. This additional purification step should further improve the sequencing efficiency of RL-Seq, by significantly reducing the number of wasted reads.
The NAz probe has also been used to inform on solvent accessibility in LASER-Seq/LASER-Map [Citation13]. The NAz reagent interacts, specifically, with exposed C8 atoms of purine bases. Due to the nature of RNA folding driven by base-pairing interactions and the relatively large size of the NAz probe, the number of exposed C8s is extremely limited (<20, <4.1%, for 16S rRNA at a cut-off of 5Å2). Thus, the use of NAz reagent makes the LASER-Seq/LASER-Map a method of low coverage for RNA structural probing. By comparison, the RNA backbone is more readily exposed to the solvent-size OH radical. This allows RL-Seq to achieve a near-complete coverage of the RNA sequence. We can conceive a complementary role for these protocols in downstream structural studies.
We expect that RL-Seq can be employed for transcriptome-wide mapping of RNA solvent accessibility. The ligated products by RtcB can be enriched by tagging the rM13 linker with biotin and purified by biotin-streptavidin affinity purification, similar to the icLASER [Citation14]. Unlike icLASER, RL-Seq will not be limited to solvent-accessible purine residues. RL-Seq can also be modified for in vivo studies by generating hydroxyl radicals through X-ray synchrotron [Citation44]. This would make it possible to study protein ‘footprinting’ and RNA kinetic studies inside the intact live cells.
Data availability
Illumina sequencing data for the E. Coli Ribosome were submitted to the NCBI Sequence Read Archive (SRA) under SRA accession number PRJNA803956 (https://www.ncbi.nlm.nih.gov/bioproject/?term=PRJNA803956).
Code availability
The scripts used to reproduce the analysis can be found at https://github.com/sparks-lab-org/RL-Seq.
Supplemental Material
Download Zip (1.9 MB)Acknowledgments
The authors gratefully acknowledge the use of the High-Performance Computing Cluster Gowonda at Griffith to complete this research, and the aid of the research cloud resources provided by the Queensland Cyber Infrastructure Foundation (QCIF). They also gratefully acknowledge the support of NVIDIA Corporation with the donation of the Titan V GPU used for this research. The support of Shenzhen Bay supercomputing facility is also acknowledged.
Disclosure statement
No potential conflict of interest was reported by the author(s).
Supplementary material
Supplemental data for this article can be accessed online at https://doi.org/10.1080/15476286.2022.2145098
Additional information
Funding
References
- Wan Y, Kertesz M, Spitale RC, et al. Understanding the transcriptome through RNA structure. Nat Rev Genet. 2011;12(9):641–655.
- Mortimer SA, Kidwell MA, Doudna JA. Insights into RNA structure and function from genome-wide studies. Nat Rev Genet. 2014;15(7):469–479.
- Sussman JL, Lin D, Jiang J, et al. Protein data bank (PDB): database of three-dimensional structural information of biological macromolecules. Acta Crystallographica Section D. Biol Crystallogr. 1998;54(6):1078–1084.
- Mailler E, Paillart JC, Marquet R, et al. The evolution of RNA structural probing methods: from gels to next‐generation sequencing. Wiley Interdiscip Rev RNA. 2019;10(2):e1518.
- England WE, Garfio CM, Spitale RC. Chemical approaches to analyzing RNA structure transcriptome‐wide. ChemBioChem. 2021;22(7):1114–1121.
- Solayman M, Litfin T, Singh J, et al. Probing RNA structures and functions by solvent accessibility: an overview from experimental and computational perspectives. Brief Bioinform. 2022;23(3):bbac112.
- Barik A, Nithin C, Karampudi N, et al. Probing binding hot spots at protein–RNA recognition sites. Nucleic Acids Res. 2016;44(2):e9–e9.
- Mukherjee S, Bahadur RP. An account of solvent accessibility in protein-RNA recognition. Sci Rep. 2018;8(1):1–13.
- Rouskin S, Zubradt M, Washietl S, et al. Genome-wide probing of RNA structure reveals active unfolding of mRNA structures in vivo. Nature. 2014;505(7485):701–705.
- Yang Y, Li X, Zhao H, et al. Genome-scale characterization of RNA tertiary structures and their functional impact by RNA solvent accessibility prediction. RNA. 2017;23(1):14–22.
- Zubradt M, Gupta P, Persad S, et al. DMS-MaPseq for genome-wide or targeted RNA structure probing in vivo. Nat Methods. 2017;14(1):75–82.
- Feng C, Chan D, Joseph J, et al. Light-activated chemical probing of nucleobase solvent accessibility inside cells. Nat Chem Biol. 2018;14(3):276.
- Zinshteyn B, Chan D, England W, et al. Assaying RNA structure with LASER-Seq. Nucleic Acids Res. 2019;47(1):43–55.
- Chan D, Feng C, England WE, et al. Diverse functional elements in RNA predicted transcriptome-wide by orthogonal RNA structure probing. Nucleic Acids Res. 2021;49(20):11868–11882.
- Wang X-W, Liu C-X, Chen -L-L, et al. RNA structure probing uncovers RNA structure-dependent biological functions. Nat Chem Biol. 2021;17(7):755–766.
- Nagalakshmi U, Wang Z, Waern K, et al. The transcriptional landscape of the yeast genome defined by RNA sequencing. Science. 2008;320(5881):1344–1349.
- Novoa EM, Beaudoin JD, Giraldez AJ, et al. Best practices for genome-wide RNA structure analysis: combination of mutational profiles and drop-off information. biorxiv. 2020;176883. https://www.biorxiv.org/content/10.1101/176883v2.
- Ellefson JW, Gollihar J, Shroff R, et al. Synthetic evolutionary origin of a proofreading reverse transcriptase. Science. 2016;352(6293):1590–1593.
- Menéndez-Arias L. Mutation rates and intrinsic fidelity of retroviral reverse transcriptases. Viruses. 2009;1(3):1137–1165.
- Celander D, Cech T. Visualizing the higher order folding of a catalytic RNA molecule. Science. 1991;251(4992):401–407.
- Adilakshmi T, Lease RA, Woodson SA. Hydroxyl radical footprinting in vivo: mapping macromolecular structures with synchrotron radiation. Nucleic Acids Res. 2006;34(8):e64–e64.
- Celander DW. Probing RNA structures with hydroxyl radicals. Curr Protoc Nucleic Acid Chem. 2001;6:Unit 6.5.
- Latham JA, Cech TR. Defining the inside and outside of a catalytic RNA molecule. Science. 1989;245(4915):276–282.
- Kielpinski LJ, Vinther J. Massive parallel-sequencing-based hydroxyl radical probing of RNA accessibility. Nucleic Acids Res. 2014;42(8):e70–e70.
- Chakravarty AK, Subbotin R, Chait BT, et al. RNA ligase RtcB splices 3′-phosphate and 5′-OH ends via covalent RtcB-(histidinyl)-GMP and polynucleotide-(3′) pp (5′) G intermediates. Proc Nat Acad Sci. 2012;109(16):6072–6077.
- Ban N, Beckmann R, Cate JH, et al. A new system for naming ribosomal proteins. Curr Opin Struct Biol. 2014;24:165–169.
- Peach SE, York K, Hesselberth JR. Global analysis of RNA cleavage by 5′-hydroxyl RNA sequencing. Nucleic Acids Res. 2015;43(17):e108–e108.
- Zhu Y, Machleder EM, Chenchik A, et al. Reverse transcriptase template switching: a SMART™ approach for full-length cDNA library construction. Biotechniques. 2001;30(4):892–897.
- Grabherr MG, Haas BJ, Yassour M, et al. Full-length transcriptome assembly from RNA-Seq data without a reference genome. Nat Biotechnol. 2011;29(7):644–652.
- Langmead B, Salzberg SL. Fast gapped-read alignment with Bowtie 2. Nat Methods. 2012;9(4):357–359.
- Quinlan AR, Hall IM. BEDTools: a flexible suite of utilities for comparing genomic features. Bioinformatics. 2010;26(6):841–842.
- Martin M. Cutadapt removes adapter sequences from high-throughput sequencing reads. EMBnet J. 2011;17(1):10–12.
- Dunkle JA, Xiong L, Mankin AS, et al. Structures of the Escherichia coli ribosome with antibiotics bound near the peptidyl transferase center explain spectra of drug action. Proc Nat Acad Sci. 2010;107(40):17152–17157.
- Shivram H, Iyer VR. Identification and removal of sequencing artifacts produced by mispriming during reverse transcription in multiple RNA-seq technologies. RNA. 2018;24(9):1266–1274.
- Gillen AE, Yamamoto TM, Kline E, et al. Improvements to the HITS-CLIP protocol eliminate widespread mispriming artifacts. BMC Genomics. 2016;17(1):1–11.
- Balázs Z, Tombácz D, Csabai Z, et al. Template-switching artifacts resemble alternative polyadenylation. BMC Genomics. 2019;20(1):1–10.
- Tang DT, Plessy C, Salimullah M, et al. Suppression of artifacts and barcode bias in high-throughput transcriptome analyses utilizing template switching. Nucleic Acids Res. 2013;41(3):e44–e44.
- Wulf MG, Maguire S, Humbert P, et al. Non-templated addition and template switching by Moloney murine leukemia virus (MMLV)-based reverse transcriptases co-occur and compete with each other. J Biol Chem. 2019;294(48):18220–18231.
- Kivioja T, Vähärautio A, Karlsson K, et al. Counting absolute numbers of molecules using unique molecular identifiers. Nat Methods. 2012;9(1):72–74.
- Hansen KD, Brenner SE, Dudoit S. Biases in Illumina transcriptome sequencing caused by random hexamer priming. Nucleic Acids Res. 2010;38(12):e131–e131.
- Hadizadeh MH, Yang L, Fang G, et al. The mobility and solvation structure of a hydroxyl radical in a water nanodroplet: a Born–Oppenheimer molecular dynamics study. Phys Chem Chem Phys. 2021;23(27):14628–14635.
- Sugimoto Y, König J, Hussain S, et al. Analysis of CLIP and iCLIP methods for nucleotide-resolution studies of protein-RNA interactions. Genome Biol. 2012;13(8):1–13.
- Han CM, Catoe D, Munro SA, et al. Simultaneous RNA purification and size selection using on-chip isotachophoresis with an ionic spacer. Lab Chip. 2019;19(16):2741–2749.
- Adilakshmi T, Soper SF, Woodson SA. Structural analysis of RNA in living cells by in vivo synchrotron X-ray footprinting. Methods Enzymol. 2009;468:239–258.