
ABSTRACT
The genetic disorder Prader-Willi syndrome (PWS) is mainly caused by the loss of multiple paternally expressed genes in chromosome 15q11-q13 (the PWS region). Early diagnosis of PWS is essential for timely treatment, leading to effectively easing some clinical symptoms. Molecular approaches for PWS diagnosis at the DNA level are available, but the diagnosis of PWS at the RNA level has been limited. Here, we show that a cluster of paternally transcribed snoRNA-ended long noncoding RNAs (sno-lncRNAs, sno-lncRNA1–5) derived from the SNORD116 locus in the PWS region can serve as diagnostic markers. In particular, quantification analysis has revealed that 6,000 copies of sno-lncRNA3 are present in 1 μL whole blood samples from non-PWS individuals. sno-lncRNA3 is absent in all examined whole blood samples of 8 PWS individuals compared to 42 non-PWS individuals and dried blood samples of 35 PWS individuals compared to 24 non-PWS individuals. Further developing a new CRISPR-MhdCas13c system for RNA detection with a sensitivity of 10 molecules per μL has ensured sno-lncRNA3 detection in non-PWS, but not PWS individuals. Together, we suggest that the absence of sno-lncRNA3 represents a potential marker for PWS diagnosis that can be detected by both RT-qPCR and CRISPR-MhdCas13c systems with only microlitre amount of blood samples. Such an RNA-based sensitive and convenient approach may facilitate the early detection of PWS.
Introduction
Characterized as a genetic multisystem disorder, Prader-Willi syndrome (PWS) has a prevalence of 1/10,000 to 1/30,000 in newborn infants and a death rate of about 3% per year [Citation1]. Individuals with PWS could experience several symptoms like prenatal and infantile hypotonia, developmental disability, hyperphagia in childhood and obesity, facial and hand malformations, hypogonadism, short stature, behavioural, and psychiatric disturbance, etc [Citation2,Citation3]. Clinically, treating PWS patients with the growth hormone could, to some extent, alleviate symptoms involving head circumference, height, and morbid obesity. In addition, the early treatment of PWS infants (before 6 months old) with testosterone or human chorionic gonadotropin could partially rescue the defect of hypogonadism. However, almost all the effective cures for PWS symptoms need to be applied to young patients, indicating that the early diagnosis of PWS is extremely important [Citation2–5].
Symptoms of PWS such as hypotonia, cryptorchidism and hypoplastic scrotum, and behaviour problems are critical phenotypic diagnostic criteria for PWS. However, many other disorders could also behave similarly to PWS. For example, clinical symptoms of craniopharyngioma and some other hypothalamus damages overlap with those of PWS. In addition, hypotonia can be seen in muscle nervous system syndromes like congenital myotonic dystrophy type 1 (CMD1), and genetic syndromes like Angelman Syndrome (AS). To distinguish PWS from disorders with similar clinical symptoms, an additional molecular test is necessary prior to confirming the diagnosis with the commonly used clinical criteria.
Genetically, the two main molecular causes of PWS are a paternally derived deletion in the maternally imprinted 15q11-q13 region (PWS region) through three common deletion breakpoints (BP1, BP2, and BP3, ) [Citation3,Citation8–12] or maternal uniparental disomy of 15q11-q13 [UPD(15)mat] [Citation13]. Other causes include imprinting defects [Citation14]; and chromosome rearrangements of this region [Citation15,Citation16]. Accordingly, the difference of DNA methylation on the imprinting centre (IC) between the paternal and maternal at 15q11-q13 has been used as PWS diagnosis by methylation-specific PCR (MS-PCR) and methylation-specific multiplex ligation-dependent probe amplification (MS-MLPA). However, neither method can distinguish the exact molecular cause of PWS [Citation3,Citation9–11,Citation15]. Subsequently, a combined approach was applied to PWS diagnosis. In such a context, Fluorescence in situ hybridization (FISH) and Chromosomal Microarray Analysis (CMA) were applied to detect PWS deletion and DNA polymorphism analysis was used to distinguish maternal UPD and imprinting defect [Citation3,Citation17,Citation18]. Notably, all existing approaches focusing on the detection of paternally deleted DNA or aberrant DNA methylation require a large amount of blood samples with a complex operation procedure, thereby limiting their application in PWS diagnosis, in particular, potential PWS patients in the neonate age.
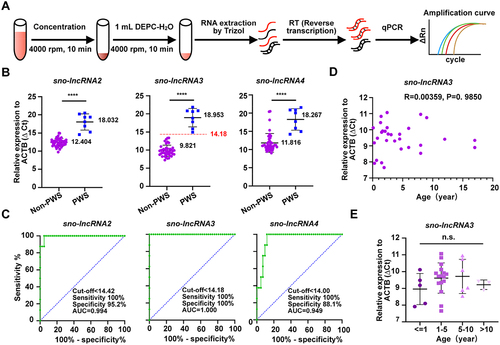
Figure 1. Sno-lncRNAs are derived from the minimal deletion region of PWS patients. (A) Schematic of the human PWS region in chromosome 15q11-q13. Non-imprinted regions are shown in green, PWS (Prader-Willi syndrome) region is shown in blue, and AS (Angelman syndrome) region is shown in yellow. Individual cases are shown with overlapped deletion fragments in the region containing SNORD109A, SNORD116s, and IPW. Of note, five sno-lncRNAs are derived from this minimal deletion region (PWS region sno-lncRNAs) (modified from [Citation6,Citation7]). (B)(C) RT-qPCR detection of the half-life of PWS region sno-lncRNAs (B), the control RNAs including the ACTB and KRAS mRNAs, and the circular RNA circHIPK3 (C) in PA1 cells. (D) Quantification of the copy number of individual sno-lncRNA2/3/4 molecules in the whole blood samples via RT-qPCR. n = 4. Data are represented as mean ± SD.
![Figure 1. Sno-lncRNAs are derived from the minimal deletion region of PWS patients. (A) Schematic of the human PWS region in chromosome 15q11-q13. Non-imprinted regions are shown in green, PWS (Prader-Willi syndrome) region is shown in blue, and AS (Angelman syndrome) region is shown in yellow. Individual cases are shown with overlapped deletion fragments in the region containing SNORD109A, SNORD116s, and IPW. Of note, five sno-lncRNAs are derived from this minimal deletion region (PWS region sno-lncRNAs) (modified from [Citation6,Citation7]). (B)(C) RT-qPCR detection of the half-life of PWS region sno-lncRNAs (B), the control RNAs including the ACTB and KRAS mRNAs, and the circular RNA circHIPK3 (C) in PA1 cells. (D) Quantification of the copy number of individual sno-lncRNA2/3/4 molecules in the whole blood samples via RT-qPCR. n = 4. Data are represented as mean ± SD.](/cms/asset/9e6144ea-cff4-4f88-a7ea-9e9551680906/krnb_a_2230406_f0001_oc.jpg)
Coding genes (MKRN3, MAGEK2, NDN, C15orf2, SNURF-SURPN), the bipartite imprinting centre (IC), and the snoRNA gene clusters like SNORD116s and SNORD115s are located in the PWS region [Citation17,Citation19–21]. Although how the lack of these factors contributes to PWS pathogenesis has largely remained elusive [Citation2,Citation3,Citation6,Citation7,Citation12,Citation17,Citation20–23], their absence may serve as PWS diagnosis markers at the RNA level. For example, the expression of SNRPN was considered as a candidate for PWS diagnosis [Citation24,Citation25]; however, some PWS individuals caused by chromosome rearrangements have shown the unaffected expression of the SNRPN gene, excluding its further application as a diagnostic marker for PWS [Citation26,Citation27].
Importantly, however, in contrast to such large-scale genetic deletion, the minimal deletion in PWS patients has been narrowed down to the region containing only SNORD109A, IPW, the SNORD116 gene cluster of 29 Box C/D snoRNAs, 5 sno-lncRNAs, and their host SPA2 lncRNA, which are located in the 3’ untranslated region of SNRPN gene () [Citation6,Citation7,Citation20,Citation21,Citation23,Citation28]. Thus, the absence of these ncRNAs, in particular, sno-lncRNAs, given their high expression levels in examined human cell lines [Citation6,Citation7], may serve as PWS diagnosis markers.
The prokaryotic adaptive immune system CRISPR-Cas13 has been applied to manipulate, cleave and visualize RNA in cells and in vivo, by using its specific single-strand RNA-targeting capacity [Citation29,Citation30]. Due to its collateral RNA cleavage activity, meaning that once the Cas13 enzyme is activated by a targeting sequence, it cleaves surrounding reporter RNA indiscriminately [Citation31,Citation32], the CRISPR-Cas13 system has been developed as sensitive and convenient tools to detect RNA in lateral visualization [Citation33–35]. We proposed that a CRISPR-Cas13 system can also be applied to detect the presence and absence of PWS region sno-lncRNAs. Notably, although CRISPR-Cas13a, b, and d systems have been reported as robust RNA-detecting tools [Citation33–36], no CRISPR-Cas13c system was reported as such an effective RNA-detecting tool.
Here, we examined the expression and stability of the PWS region sno-lncRNAs, in whole and dried blood samples in non-PWS controls and PWS patients. We confirmed that the most abundant sno-lncRNA3 can serve as a biomarker with 100% specificity and 100% sensitivity for its absence in 43 randomly collected PWS samples using RT-qPCR. In addition, we identified a new CRISPR-MhdCas13c with a robust targeting and collateral RNA cleaving activity that is comparable to the well-known CRISPR-LwaCas13a [Citation33]. By screening gRNAs targeting sno-lncRNA3, we further developed the CRIPSR-MhdCas13c-based method for potential PWS diagnosis, which is efficient and specific for PWS detection.
Materials and methods
Cell culture
PA1 cell lines obtained from American Type Culture Collection were cultured at 37 °C and 5% CO2 in modified Eagle medium (MEM, Thermo Fisher) supplemented with 10% Fetal Bovine Serum (FBS) and 1% Glutamax.
Protein expression and purification
pET28a-6× His-MhdCas13c were transformed into the E. coli expression strain, the Transetta (DE3) chemically competent cells (Transgene Biotech, Cat. No. CD801), according to the manufacturer’s protocol. After transformation, the cells were cultivated at 37 °C, 250 rpm for 2 h, followed by transferring into 1 L of LB culture media for growth at the same condition. Once the absorbance of the culture media reached the OD600 around 0.6–0.8, isopropyl β-D-1-thiogalactopyranoside (IPTG) was added to the final concentration of 0.5 mM (GoldBio, Cat. No. I2481C50) to induce protein expression, and then cultured at 16 °C, 180 rpm for another 18 h.
The next day, cell pellets were collected by centrifugation (5,000 g, 10 min, 4 °C), and resuspended in 25 mL lysis buffer (40 mM Tris-HCl, pH 7.4, 500 mM NaCl). Then, the resuspension was sonicated at 4 °C by a high-pressure homogenizer (Ultrahigh pressure cell crusher UH-06; Union-biotech) followed by centrifugation at 10,000 rpm for 45 min at 4 °C. After that, the supernatant cell lysates were collected and sterile-filtered through a 0.4-μm polyvinylidene difluoride membrane (Millipore, Cat. No. GSWP04700). The supernatant was then incubated for 10 min with 1 mL Ni-NTA beads in the column (referred to as 1 column volume, Ni Sepharose 6 Fast Flow, GE Healthcare, Cat. No. 17-5318-01) and then flowed through. Next, the Ni-NTA beads were washed three times with 10 column volumes of the wash buffer (40 mM Tris-HCl, pH7.4, 500 mM NaCl, 50 mM Imidazole), and the bound proteins were eluted with 10 column volumes of the elution buffer (40 mM Tris-HCl, pH7.4, 500 mM NaCl, 300 mM Imidazole). Proteins were then concentrated using an Amicon® Ultra-15 Centrifugal Filter (50K, Millipore, Cat. No. UFC905008) by centrifugation at 4,000 g at 4 °C and were sterile filtered before purification by Akta Pure FPLC (GE Healthcare). The proteins were purified through a 5-mL HiLoad Superdex 200 PG gel filtration chromatography column, first equilibrated with storage buffer (40 mM Tris-HCl, pH 7.4, 500 mM NaCl). Protein-containing fractions were collected and concentrated, followed by quantification with serial dilutions of standard BSA by using Bradford Protein Assay Kit (Beyotime, Cat. No. P0006). Finally, proteins were snap-frozen in liquid nitrogen and stored in aliquots at − 80 °C.
In vitro transcription and purification of gRNA and target RNA
DNA templates for gRNAs and target RNAs were amplified by primers (Table S1), followed by agarose gel purification. The crRNA and target RNA for gRNAs were synthesized by in vitro transcription with T7 RNA polymerase (Promega, Cat. No. P1300) according to the manufacturer’s protocol. The crRNA and target RNA were then purified by gel electrophoresis on a 12% denaturing (8 M urea) polyacrylamide gel. The crRNA and target RNA were resuspended in DNase/RNase-Free Deionized Water (TIANGEN, Cat. No. 4992956).
Collateral RNA cleavage assays
In collateral RNA cleavage assays detected by denaturing polyacrylamide gel, 176 nt non-target reporter RNA was synthesized by in vitro transcription. Equal ratio of gRNA, MhdCas13c, and target RNA were incubated with 500 nM reporter RNA in cleavage buffer (40 mM Tris-HCl, pH 7.4, 10 mM MgCl2 unless otherwise stated) at 37 °C for 10 min in 10 μL reactions. Reactions were quenched with 1 μL enzyme stop solution (10 mg/mL Proteinase K, 4 M Urea, 80 mM EDTA, 20 mM Tris pH 8.0) at 37 °C for 15 min and finally denatured by adding 2× RNA loading buffer. Samples were analysed on a 10% urea-denaturing polyacrylamide gel with TBE buffer. Cleavage products were visualized by EB staining.
Cleavage site preference assay
DNA/RNA-chimeric reporters were synthesized at GenScript Company and labelled with Digoxigenin (Dig) using a terminal transferase kit (NEB, Cat. No. M0315). 20 nM complex of gRNA, MhdCas13c, and target RNA were incubated with 200 nM reporter RNA in cleavage buffer (40 mM Tris-HCl, pH 7.4, 10 mM MgCl2) at 37 °C for 15 min in 10 μL reactions. Reactions were quenched with 1 μL enzyme stop solution (10 mg/mL Proteinase K, 4 M Urea, 80 mM EDTA, 20 mM Tris pH 8.0) at 37 °C for 15 min and finally denatured by adding 2× RNA loading buffer. Samples were resolved on 10% denaturing urea polyacrylamide gel, transferred to a nylon membrane (Roche), and UV-crosslinked using standard manufacturer’s protocol. The membrane was then detected with an Alkaline Phosphatase Anti-Digoxigenin antibody (Roche).
Fluorescent reporter assay
Reporter RNA modified with 6-FAM at 5’-end and BHQ-1 at 3’-end was synthesized at GenScript Company. 200 nM complex of gRNA and MhdCas13c were incubated with 20 nM target RNA (except for the specific copies of RNAs in detection sensitivity assay), and 66.7 nM reporter RNA in cleavage buffer (40 mM Tris-HCl, pH 7.4, 10 mM MgCl2) in 60 μL reactions. BioTek SynergyNEO was used for measuring the fluorescence of the detection reaction. Fluorescence kinetics were monitored using a monochromator with excitation at 490 nm and emission at 520 nm with a reading every 5 minutes for up to 2 hours.
RNA isolation, RT-qPCR
Fresh anticoagulant-treated whole blood samples were treated with three volumes of RNALock reagent (TIANGEN, Cat. No. 4992731) to stabilize RNAs during storage. 200 μL treated samples were centrifuged at 4,000× g for 10 minutes, the pellet was then washed in DEPC-H2O, and RNAs from the blood cell pellet were extracted with Trizol (Life Technologies Cat. No. 15596018) according to the manufacturer’s protocol. The extracted RNAs were solved in 10 μL DNase/RNase-free water. For RPA amplification, the extracted RNAs were treated with DNase I (Ambion, Cat. No. AM1907) to remove genomic DNAs first, which was performed according to the instructions.
Half of the dried blood spots cutting into pieces were collected into a 1.5 mL tube, and treated with 1 mL Trizol for 30 minutes. Then RNAs were extracted with Trizol according to the manufacturer’s protocol. The extracted RNAs were resolved in 10 μL DNase/RNase-free water and treated with DNase I to remove genomic DNAs.
For RT–qPCR, cDNA synthesis was carried out using PrimeScriptTM RT Master Mix (TaKaRa, RR036A) with oligo (dT) and random hexamers. qPCR was performed using SYBR Green Realtime PCR Master Mix (TOYOBO) and a StepOnePlus real-time PCR system (Applied Biosystems). Each sample was determined with triplicate independent experiments. Primers used in qPCR are listed in Table S1.
RPA reactions
For RPA reactions, the GenDx RT-ERA kit or Hangzhou ZC bioscience RT-RAA kit was used according to the manufacturer’s instructions. For each reaction, 1 μL of extracted RNAs was used. Primer concentrations were 500 nM. All RPA reactions were done in 30 minutes unless otherwise stated.
Results and discussion
Sno-lncRNAs display a comparable half-life to the stable circHIPK3 and ACTB mRNA
Sno-lncRNA is produced from the single intron with two snoRNAs, and the mature sno-lncRNA is flanked by one snoRNA and its protein complex (snoRNP) at each end [Citation6]. Five sno-lncRNAs are produced from the minimal deletion of the PWS region [Citation6] (). To evaluate their potency as the clinical biomarkers for PWS diagnosis, we first checked the half-life of these sno-lncRNAs. We treated PA1 cells, a type of human embryonic carcinoma cell line known to express PWS region sno-lncRNAs [Citation6], with α-amanitin to block RNA polymerase II (Pol II) transcription, and then detected the remaining sno-lncRNA levels after 0, 3, 6, 12, and 24 hours post treatments. At the same time, we also examined other RNAs with different turnover rates, including stable RNAs such as the circular RNA circHIPK3 and the abundant mRNA ACTB, as well as the less stable RNA like KRAS mRNA as controls. We found that sno-lncRNA2, sno-lncRNA3, and sno-lncRNA4 were relatively stable and that almost half amount of these RNAs still remained after 24 hours of Pol II transcription pausing (), showing a half-life longer than 24 hours, which is similar to the half-life of circHIPK3 and ACTB (). In contrast, sno-lncRNA1 and sno-lncRNA5 were less stable than the other three, with a half-life about 12 hours (), consistent with the notion that they both were expressed at a relatively low level in PA1 and other cells [Citation6].
We next quantified their expression levels in human whole blood samples by determining the copy number of sno-lncRNA2, sno-lncRNA3, and sno-lncRNA4 with RT-qPCR, in which a serial dilution of the purified DNA template of sno-lncRNA2, 3, and 4 from PA1 cells were used for qPCR to generate standard curves (Fig. S1). Approximately 6,000 copies of sno-lncRNA2, 6,000 copies of sno-lncRNA3, and 1,500 copies of sno-lncRNA4 were found in 1 μL whole blood samples on average from four individuals, respectively (). These results indicated that sno-lncRNA2 and sno-lncRNA3 have high expression levels with a long half-life; thus in theory they are suitable for being used for clinical detection.
Sno-lncRNAs showed high sensitivities and specificities as molecular markers for PWS early diagnosis
We next asked whether the abundant sno-lncRNA2/3/4 were completely absent in PWS patients compared to healthy population. To address this question, we extracted blood RNAs from 8 PWS and 42 non-PWS individuals and analysed sno-lncRNAs’ expression by RT-qPCR (). The endogenous ACTB expression was used as a control to normalize the expression of different sno-lncRNAs among samples, resulting in ΔCt values for comparison. Of note, the higher ΔCt values means the lower expression of sno-lncRNAs. We found that all three sno-lncRNAs were significantly down-regulated (with higher ΔCt values) in the blood samples from PWS patients (). Then we acquired the receiver operating characteristic (ROC) curves of these sno-lncRNAs according to the ΔCt values to evaluate the diagnostic accuracy. Specifically, the ROC curves of the sno-lncRNA3 showed an area under the curve (AUC) of 1.000 (95% confidence intervals [CIs], 1.000–1.000; p < 0.0001) with 100% sensitivity and 100% specificity, in which the ΔCt cut-off value of sno-lncRNA3 < 14.18 ().
Figure 2. All PWS sno-lncRNAs are absent from PWS samples, and their absence can serve as diagnostic markers for PWS. (A) Schematic of detecting sno-lncRnas in whole blood samples by RT-qPCR. (B) RT-qPCR results of all tested three PWS region sno-lncRNAs (sno-lncRNA2, sno-lncRNA3, and sno-lncRNA4) showed significant differences in expression levels between whole blood samples from 42 non-PWS individuals and 8 PWS patients. Data are represented as mean ± SD. (C) ROC curves revealed the high specificity and sensitivity of all tested three sno-lncRNAs as PWS biomarkers in whole blood samples isolated from non-PWS individuals and PWS patients. (D) a scatter diagram of sno-lncRNA3 expression in blood samples derived from non-PWS individuals of different ages showed no observable correlation. (E) the relative expression of sno-lncRNA3 in individuals grouped from different age ranges showed no observable variance in its expression between different groups. Data are represented as mean ± SD.
For other examined PWS region sno-lncRNAs, the AUC for sno-lncRNA2 was 0.994 (95% CIs, 0.978–1.000) with 100% sensitivity and 95.2% specificity (ΔCt cut-off value < 14.42), and for sno-lncRNA4 was 0.949 (95% CIs, 0.892–1.000) with 100% sensitivity and 88% specificity (ΔCt cut-off value < 14.00) (). These analyses indicated that the designed PCR primers (after a tilling screen for these three sno-lncRNAs, data not shown) targeting sno-lncRNA3 showed the great potential for serving as the clinical diagnosis markers. Of note, the remaining maternal copy of these sno-lncRNAs due to paternal deletion or UPD(15)mat in these PWS samples can dampen the detection sensitivity, resulting in a relatively small difference in the observed ΔCt values between non-PWS and PWS samples (see below ).
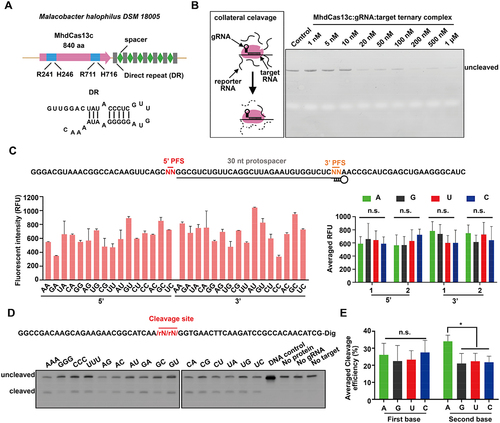
Figure 3. DNase I treatment increased the detection sensitivity of sno-lncRNAs in dried blood samples. (A) RT-qPCR detection showed no difference in sno-lncRNA3’s RNA level between dried blood spot samples of non-PWS individuals and PWS patients without DNase I treatment. n = 12 for PWS samples, n = 12 for non-PWS samples. Data are represented as mean ± SD. (B) DNase I digestion improved the specificity and sensitivity of the RT-qPCR detection of all tested three PWS region sno-lncRNAs. n = 4 for each of the PWS and non-PWS samples. (C) Schematic of detecting sno-lncRNAs in dried blood spot samples by RT-qPCR. (D) qPCR results of all tested three sno-lncRNAs showed a significant expression difference between the dried blood spot samples from 24 non-PWS individuals and 35 PWS patients. Data are represented as mean ± SD. (E) ROC curves revealed the high specificity and sensitivity of all PWS region sno-lncRNAs as PWS biomarkers in the dried blood spot samples from non-PWS individuals and PWS patients.
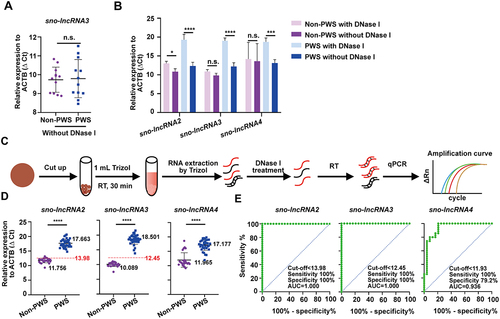
Moreover, we asked whether the age of individuals would affect the expression of sno-lncRNAs. Comparing sno-lncRNA3 expression in whole blood samples from non-PWS individuals at different ages showed that the expression of sno-lncRNA3 was not correlated with individuals’ age (), indicating that the absence of sno-lncRNA3 can serve as the potential biomarker for PWS using the whole blood samples.
DNase I treatment increased the detection sensitivity of sno-lncRNAs in dried blood samples
In clinical, whole blood samples are difficult to reserve. Thus, blood samples are commonly stored as dried blood spots, which could be used even in one year for those well stored at 4 °C. We then checked whether these sno-lncRNAs’ detections were as specific and sensitive in dried blood spots as in whole blood samples. To our surprise, after analysing total RNAs isolated from dried blood spots of 12 PWS patients and 12 non-PWS individuals, the expression of sno-lncRNA3 had no significant difference (). Two possibilities exist. First, the procedure of making dried blood spots may cause potential RNA degradation, resulting in fewer RNAs extracted from dried blood spots. Second, the contamination of genomic DNAs could be another issue as the ratio of DNA in the RNA extraction is relatively high (data not shown), which would result in unwanted signals in the qPCR test as the PWS patients contain the maternal PWS region in the paternal deletion or UPD, and both parental regions in imprinting defect cases [Citation3]. Consistent with this hypothesis, treating the extracted RNAs with DNase I to remove genomic DNAs, followed by re-analysing RNAs resulted in remarkably increased ΔCt values of all examined sno-lncRNAs in PWS patient samples (). As controls, only subtle or no change of ΔCt value in the non-PWS samples ().
These efforts have prompted us to include the DNase I treatment procedure in the dried blood sample analyses, in the enlarged sample pools including 35 PWS patients and 24 non-PWS individuals (). Similar to the results observed from the whole blood samples, we found all three sno-lncRNAs(2, 3, 4) were significantly decreased in patient samples (). By computing the ROC curves of these sno-lncRNAs using ΔCt, we found that the ROC curves of sno-lncRNA2 and sno-lncRNA3 an AUC of 1.000 (95% CIs, 1.000–1.000; p < 0.0001) with 100% sensitivity and 100% specificity (ΔCt cut-off value of sno-lncRNA2 < 13.98, ΔCt cut-off value of sno-lncRNA3 < 12.45) (). However, the ROC curve of sno-lncRNA4 was much less efficient than that of the other two (), indicating that sno-lncRNA4 was unlikely suitable as a biomarker to separate PWS from non-PWS samples.
Taken together, these results suggested that the absence of sno-lncRNA2 and sno-lncRNA 3 may serve for PWS diagnosis, given their long half-life and the high abundance in blood samples (). It is particularly true for sno-lncRNA3, which showed its robustness in whole blood samples even without the DNase I treatment ().
The CRISPR-MhdCas13c system exhibited a robust collateral RNA cleavage activity
In addition to RT-qPCR, we expect that the recently developed CRISPR-Cas13, a system that is less dependent on equipment [Citation33,Citation37] can also be applied to detect the presence and absence of sno-lncRNAs for PWS detection, and we aim to develop a new CRISPR-Cas13 system for our purpose.
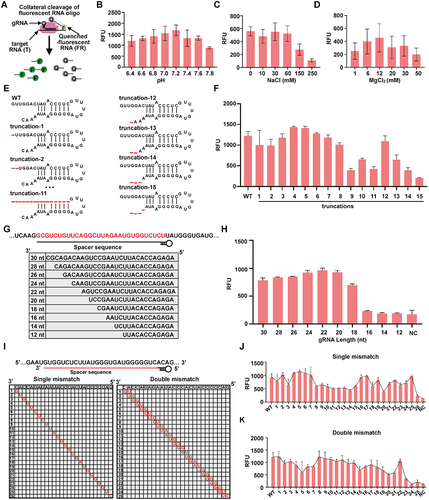
Till now, CRISPR-Cas13a, b, and d, but not CRISPR-Cas13c, have been reported as robust RNA-detecting tools [Citation33–36]. Recently, we found a new CRISPR-Cas13c locus from Malacobacter halophilus DSM 18,005 encoding MhdCas13c effector protein with 840 amino acid (aa), which is much smaller than other reported Cas13c proteins (more than 1000 aa) () [Citation38]. To characterize this new CRISPR-Cas13c system, we overexpressed and purified MhdCas13c, and purified the guide (g)RNA, target RNA, and the reporter RNA, followed by assembling different amounts of MhdCas13c, gRNA, and target RNA with the reporter RNA at 37 °C for 10 minutes to validate its collateral RNA cleavage activity (). The PAGE gel electrophoresis assay showed that the reporter RNA was efficiently digested by as few as 20 nM MhdCas13c-gRNA-target RNA complex (), showing the high RNA cleavage and detection capacity of the CRISPR-MhdCas13c system.
Figure 4. The CRISPR-MhdCas13c system exhibited a robust collateral RNA cleavage activity. (A) Schematic of CRISPR-MhdCas13c system. (Top) Schematic of the CRISPR-MhdCas13c locus in Malacobacter halophilus DSM 18,005. (Bottom) Secondary structure of the direct repeat (DR). (B) the PAGE gel electrophoresis assay showed that the bystander reporter RNA was efficiently digested by as few as 20 nM MhdCas13c-gRNA-target RNA complex. (Left) Schematic of collateral RNA cleavage of MhdCas13c. (Right) PAGE gel electrophoresis of the cleaved products. (C) CRISPR-MhdCas13c does not exhibit a PFS requirement. (Top), schematic of RNA substrate being targeted by the crRNA. The 30-nt protospacer region is indicated with grey words, the red bars indicate the 5‘ PFS and the orange bars indicate the 3’ PFS. Both the red letters and orange letters represent the altered sequences in the experiment; (Bottom left), quantification of fluorescence signals generated after 30 min incubation of MhdCas13c-gRNA complex with target RNA sequences described in (Top); (Bottom right), averaged fluorescence signals generated by MhdCas13c-gRNA targeting RNA sequences with the same flanking ribonucleotides. (D-E) Collateral cleavage reporter assay showed that the CRISPR-MhdCas13c system preferred cleaving N-A (N=A, U, C, G) dinucleotide combinations. (D) Top, Schematic of collateral RNA substrate modified by digoxin. The black letters represent DNA sequences, and the red letters represent altered RNA sequences. Bottom, the northern blot of reporter RNAs cleaved by CRISPR-MhdCas13c complex. Reactions were incubated for 30 min. (E) Quantification of average cleavage efficiency from northern blot results of (D). Cleavage percentage is determined by the ratio of cleaved band intensity divided by total lane intensity.
It has been shown that the existence of protospacer flanking sequence (PFS) in the target RNA could affect the efficiency of the CRISPR-Cas13a, b, and d systems [Citation39–42]. To examine whether PFS could impact CRIPSR-MhdCas13c, we constructed 16 target RNAs, each containing one type of 2-nt-long 5‘ or 3’ flanking sequence (). Examining these target RNAs to the CRIPSR-MhdCas13c system showed that a few combinations such as 3’ CC yielded lower reporter fluorescence than other combinations (, bottom left), however, no detectable difference of the RNA cleavage capacity was observed when comparing the average fluorescence of each nucleotide (, bottom right). These results indicated that PFS was not so essential for gRNA designing in this system.
In addition to PFS, the cleavage motif preference in the target RNA also matters for the activity of CRISPR-Cas13 families [Citation37,Citation39,Citation42]. Next, we designed the DNA/RNA chimeric collateral reporters by inserting two or three random nucleotides into the DNA backbone, followed by the examination of the cleavage efficiency of these chimeric reporters by CRIPSR-MhdCas13c. Although all reporters could be cleaved (), however, notably, statistics showed that N (N=A, U, C, G)-A combinations were preferred by the CRISPR-MhdCas13c system (), suggesting that reporter RNAs containing N-A combinations can serve for better RNA detection.
Optimization of CRISPR-MhdCas13c for the collateral RNA cleavage activity
To further advance the efficiency of this newly identified CRISPR-MhdCas13c system, we sought to optimize several parameters involved in this system including the reaction condition, the direct repeat (DR) sequence, the gRNA spacer length, and the target specificity. We first designed the quenched fluorescent RNA reporter and performed the collateral cleavage assay (). In this experiment, we tested effects of the pH value, the concentration of sodium (NaCl), and the concentration of ion (Mg2+) on the cleavage system. We found that the CRISPR-MhdCas13c exhibited the best RNA cleavage activity in the condition of 40 mM Tris-HCl (pH 7.2) (), 0–60 mM NaCl () and 12 mM MgCl2 (). Next, we evaluated the DR structure of the gRNA. As 7 nucleotides at the 5’− end and 4 nucleotides at the 3'- end of the DR structure protrude from the stem-loop structure (, bottom), we asked whether these nucleotides are important for the CRISPR-MhdCas13c system. To check this, we constructed gRNAs with different truncated DR sequences () and compared their impact on the RNA cleavage of MhdCas13c. The results indicated that the seven nucleotides at the 5'- end of the DR sequence were dispensable for CRISPR-MhdCas13c’s RNA cleavage activity, while the deletion of the four nucleotides at the 3’- end strongly affected the collateral cleavage (), which in part resembled the feature of the CRISPR-Cas13a systems [Citation43]. With these efforts, we concluded that gRNAs with shorter DR could be used for RNA detection in the CRISPR-MhdCas13c system.
Figure 5. Optimization of CRISPR-MhdCas13c for the collateral RNA cleavage activity. (A) Schematic of the collateral cleavage of MhdCas13c to the quenched fluorescent RNA reporter. (B-D) the CRISPR-MhdCas13c system exhibited the best cleavage activity with a buffer of 40 mM Tris-HCl (pH 7.2) (B), 0–60 mM NaCl (C), and 12 mM MgCl2 (D). (B) Quantification of fluorescence signals generated after 30 min incubation of 50 nM MhdCas13c-gRNA-target RNA ternary complex to the RNA reporter in the buffer of 40 mM Tris-HCl (pH from 6.4 to 7.8), 10 mM MgCl2. (C) Quantification of fluorescence signals generated after 30 min incubation of 50 nM MhdCas13c-gRNA-target RNA ternary complex to the RNA reporter in the buffer of 40 mM Tris-HCl (pH 7.2), 10 mM MgCl2 with 0–250 mM NaCl. (D) Quantification of fluorescence signals generated after 30 min incubation of 50 nM MhdCas13c-gRNA-target RNA ternary complex to the RNA reporter in the buffer of 40 mM Tris-HCl (pH 7.2) with 1–50 mM MgCl2. (E-F) 3’ flanking nucleotides and middle stem-loop structure is important for MhdCas13c-mediated RNA cleavage activity. (E) the sequence of original and truncated versions of MhdCas13c DR. (F) Quantification of fluorescence signals generated after 30 min incubation of MhdCas13c with the gRNAs with the DR sequences described in (E). (G–H) At least an 18-nt spacer length is required for efficient activation of CRISPR-MhdCas13c. (G) Schematic of spacer lengths used for MhdCas13c-complex-mediated RNA cleavage activity. (H) Quantification of fluorescence signals generated after 30 min RNA cleavage of MhdCas13c with the gRNAs described in (G). (I-K) Mismatches in the 5’- end of the spacer impaired MhdCas13c-complex-mediated RNA cleavage activity. (I) Schematic of the single-nucleotide and double-nucleotides gRNA-RNA mismatch within the 26-nt RNA targeting site. (J) Quantification of fluorescence signals generated after 30-min incubation of MhdCas13c with the gRNAs with single-nucleotide mismatches described in (I). (K) Quantification of fluorescence signals generated after 30 min incubation of MhdCas13c with the gRNAs with double-nucleotide mismatches described in (I).
To determine the minimal spacer length of the gRNA for efficient MhdCas13c targeting, we generated a series of gRNAs consisting of spacer truncations ranging from the unprocessed 30-nt down to 12-nt long. After assessing the system activities consisting of these gRNAs, we found that the cleavage activity dropped significantly with the gRNA harbouring the spacer less than 18-nt (), which was shorter than the 20-nt length requirement for CRISPR-Cas13a and CRISPR-Cas13d [Citation39,Citation42]. To assess the generalizability of the CRIPSR-MhdCas13c-based RNA detection, we then generated 16 gRNAs with 20-nt, 26-nt, and 30-nt spacer lengths, respectively, to specifically tile the complementary target RNA in that case to understand the detailed length requirements in this system (Fig. S2A). As shown in Fig. S3G, all three types of gRNAs achieved comparable nuclease activity when targeting some positions, but the longer ones, i.e. the 26- and 30-nt ones, exhibited more consistently efficient cleavage activity than the 20-nt ones (Fig. S2A).
Lastly, to characterize the targeting specificity of the CRISPR-MhdCas13c system, we introduced single- and double-nucleotide mismatches across the target sequence into the 26-nt gRNA used in and tested the cleavage activity of the system (). Interestingly, the RNA cleavage activity was sensitive to mismatches in the 5’-end of the spacer (close to the DR sequence), while mismatches in other positions only moderately affected the activity (). Meanwhile, we also generated single-nucleotide mismatches in the 20-nt gRNA (Fig. S2B), which showed that most mismatches impaired the RNA cleavage activity of CRISPR-MhdCas13c (Fig. S2C).
Together, these efforts suggest that gRNAs harbouring shorter spacers (i.e. 20-nt) showed higher specificity than those containing longer spacers (i.e. 26- and 30- nt) ( and Fig. S2B), but longer spacers appeared to bring consistent RNA cleavage activity (Fig. S2A). Thus, the choice of the gRNA spacers may be context-dependent: on one hand, the detection of a type of RNA may require the screening gRNAs containing longer spacers; on the other hand, the separation of RNAs containing mutations may need gRNAs containing shorter spacers to ensure specificity.
The CRISPR-MhdCas13c system efficiently detects sno-lncRNA3 in non-PWS and PWS blood samples
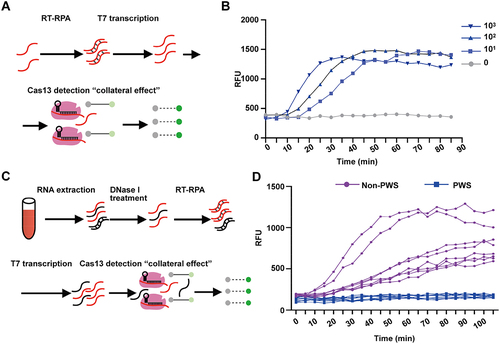
Next, we set to apply this optimized CRISPR-MhdCas13c system to detect sno-lncRNA3, the most reliable and robust marker from the PWS region as shown in . We first generated sno-lncRNA3 standards (a 200-nt region near 5’ of entire sno-lncRNA3) and 25 gRNAs containing 26-nt spacers that till to mark the sno-lncRNA3 standard sequence (Fig. S3A). The screening with the fluorescent reporter assay revealed that the gRNA-22 showed the highest RNA cleavage efficiency (Fig. S3B). Directly applying the gRNA-22 and fluorescent reporter to the CRISPR-MhdCas13c-based detection required at least 1010 copies of sno-lncRNA3 standards to achieve robust signals (Fig. S3D), which is higher than 103 ~ 104 copies of sno-lncRNA3 per microlitre of the whole blood samples (). In previous studies, isothermal amplification methods such as LAMP (Loop-mediated Isothermal Amplification) and RPA (Recombinase Polymerase Amplification) have been applied to amplify the DNA of interest to enhance the detection sensitivity [Citation34–36]. Here, we reversely transcribed sno-lncRNA3 into cDNA (RT), amplified it with an inserted T7 promoter at the 5’ end by RPA, followed by in vitro transcription for detection (). The CRISPR-MhdCas13c-based sno-lncRNA3 detection yielded a sensitivity of 10 copies per microlitre combining the RT-RPA/T7 amplification (). This is capable of discriminating the presence and absence of sno-lncRNA3 for PWS diagnosis. Indeed, we validated the CRISPR-MhdCas13c detection system for total RNAs extracted from the whole blood samples of six PWS patients and eight non-PWS individuals (). The expression of sno-lncRNA3 in all blood samples from non-PWS individuals was consistently detected, while no sno-lncRNA3 was detectable in PWS patients (). These results confirmed the efficiency of CRISPR-MhdCas13c system in sno-lncRNA3 detection and its capability in separating non-PWS and PWS individuals.
Figure 6. Detection of sno-lncRNA3 RNA by CRISPR-MhdCas13c system. (A) Schematic of detecting sno-lncRNA3 combining CRISPR-MhdCas13c and RPA amplification. (B) Time-lapse quantification of fluorescence signals generated by CRISPR-MhdCas13c detection showed that as low as 10 copies per microlitre of sno-lncRNA3 could be detected. (C) Schematic of the detection of sno-lncRNA3 by CRISPR-MhdCas13c system in the whole blood samples and dried blood spot samples using fluorescent reporter. (D) Detection of sno-lncRNA3 by CRISPR-MhdCas13c system in the whole blood samples showed the expression of sno-lncRNA3 in non-PWS individuals rather than PWS patients.
Concluding remarks and outlook
To cure PWS patients with efficient treatments, it is important to identify PWS individuals as early as possible. Currently, most of the PWS diagnoses are based on the typical clinical PWS symptoms combined with genetic tests including MS-PCR or MS-MLPA to detect DNA methylation, FISH or MCA to verify chromatin deletion, and polymorphism analysis to distinguish imprinting defects and UPD(15)mat. Although these methods have been routinely used for PWS diagnosis, the requirement of a large amount of samples and the incapability to identify patients caused by chromosomal rearrangements have limited their utility [Citation3,Citation8–10,Citation18,Citation44–47]. Here, we provide a type of RNA marker, the PWS region sno-lncRNAs, especially the sno-lncRNA3, whose absence can serve as a diagnostic marker for PWS. Their absence in PWS patients can be confirmed by RT-qPCR () and the CRISPR-Cas13c system () with high sensitivity and accuracy, thus providing an RNA level of approach in addition to the existing DNA-level diagnosis.
Sno-lncRNAs are paternally expressed from the minimal deletion region in PWS individuals (). The snoRNP at each end of the sno-lncRNA ensures its stability, resulting in high abundance in bloods of normal individuals () [Citation6,Citation7]. These features make sno-lncRNAs, in particular sno-lncRNA3, an ideal marker whose absence and presence were remarkably different in whole and dried blood samples from PWS and non-PWS individuals with 100% sensitivity and 100% specificity (). Unlike focusing on the single allele detection of DNA deletion or imprinting requiring millilitre amount of blood for MS-PCR- and MS-MLPA-based detection, this reported RNA-based diagnosis approach is user-friendly and convenient, with only a small amount of blood example (i.e. no more than 1 μL input) needed. Thus, detecting PWS region sno-lncRNA3 has the potential to be widely used clinically and for screening newborns with PWS risk.
In addition, the newly identified CRISPR-Cas13c system () has been opted for the detection of sno-lncRNA3 in non-PWS and PWS blood samples (), making the RNA-based detection less equipment dependent. Of note, the CRISPR-MhdCas13c system that we developed can not only detect sno-lncRNAs for PWS diagnosis but also other genetic or imprinting disorders with the aberrant RNA expression, such as Angelman syndrome (AS), Silver-Russell syndrome (SRS), and Beckwith-Wiedemann syndrome (BWS) [Citation48]. Nonetheless, such an RNA-based detection via the CRISPR-MhdCas13c system can be developed as an efficient and sensitive tool as RT-qPCR for diseases with abnormal gene expression.
Highlights
Sno-lncRNAs from the PWS deletion region are theoretically absent in all genetic types of PWS.
Sno-lncRNA3 shows robust signals in normal whole and dried blood samples but not PWS.
A miniature CRISPR-MhdCas13c is identified with the robust RNA cleavage activity.
CRISPR-MhdCas13c combining RT-RPA shows the potential for PWS diagnosis with high sensitivity.
Author contributions
L.-L.C. and C.Z. conceived the project. J.-R.S and L.-Z. Y designed and performed experiments with the help of H.W., S.L., Y.-F.X., and Y.H.; Y.-L.D., Z.S., and C.Z. provided PWS and control samples. H.W., L.-Z. Y and L.-L.C. wrote the manuscript. L.-L.C. and C.Z. supervised the project.
Ethics Declarations
This work was approved by the Institutional Ethics Committee of Children’s Hospital, Zhejiang University School of Medicine.
Supplemental Material
Download Zip (1.4 MB)Acknowledgments
This work was supported by the National Key R&D Programme of China (2021YFA1100203), the CAS Project for Young Scientists in Basic Research (YSBR-009), the National Natural Science Foundation of China (NSFC) (31725009, 31830108), the Centre for Excellence in Molecular Cell Science (CEMCS) (2020DF03), and the HHMI International Programme (55008728) to L.-L.C.; the Key R & D Projects of Zhejiang Provincial Science and Technology Agency (2021C03094) to C.Z., L.-L.C. acknowledges support from the Xplorer Prize and New Cornerstone Science Foundation.
Disclosure statement
L.-L.C. and H.W. are named as inventors on patents related to sno-lncRNAs detections held by CAS Centre for Excellence in Molecular Cell Science.
Data availability statement
Raw data of key experiments can be accessed on Mendeley Data: doi:10.17632/fh6ws758cf.1
Supplementary material
Supplemental data for this article can be accessed online at https://doi.org/10.1080/15476286.2023.2230406.
Additional information
Funding
References
- Butler JV, Whittington JE, Holland AJ, et al. Prevalence of, and risk factors for, physical ill-health in people with Prader-Willi syndrome: a population-based study. Dev Med Child Neurol. 2002 Apr;44(4):248–255.
- Goldstone AP. Prader-Willi syndrome: advances in genetics, pathophysiology and treatment. Trends Endocrinol Metab. 2004 Jan-Feb;15(1):12–20. doi: 10.1016/j.tem.2003.11.003
- Cassidy SB, Schwartz S, Miller JL, et al. Prader-Willi syndrome. Genet Med. 2012 Jan;14(1):10–26.
- Butler MG, Swift LL, Hill JO. Fasting plasma lipid, glucose, and insulin levels in Prader-Willi syndrome and obese individuals. Dysmorphol Clin Genet. 1990;4(1):23–26.
- Ruvalcaba RH, Holm VA. Effects of growth hormone in Prader-Willi syndrome. A case report. Clin Pediatr (Phila). 1993 May;32(5):292–295. doi: 10.1177/000992289303200507
- Yin QF, Yang L, Zhang Y, et al. Long noncoding RNAs with snoRNA ends. Mol Cell. 2012 Oct 26;48(2):219–230.
- Wu H, Yin QF, Luo Z, et al. Unusual processing generates SPA LncRNAs that sequester multiple RNA binding proteins. Mol Cell. 2016 Nov 3;64(3):534–548.
- Butler MG. Prader-Willi syndrome: current understanding of cause and diagnosis. Am J Med Genet. 1990 Mar;35(3):319–332. doi: 10.1002/ajmg.1320350306
- Driscoll DJ, Waters MF, Williams CA, et al. A DNA methylation imprint, determined by the sex of the parent, distinguishes the Angelman and Prader-Willi syndromes. Genomics. 1992 Aug;13(4):917–924.
- Dittrich B, Buiting K, Gross S, et al. Characterization of a methylation imprint in the Prader-Willi syndrome chromosome region. Hum Mol Genet. 1993 Dec;2(12):1995–1999.
- Glenn CC, Saitoh S, Jong MT, et al. Gene structure, DNA methylation, and imprinted expression of the human SNRPN gene. Am J Hum Genet. 1996 Feb;58(2):335–346.
- Horsthemke B, Wagstaff J. Mechanisms of imprinting of the Prader-Willi/Angelman region. Am J Med Genet A. 2008 Aug 15;146A(16):2041–2052. doi: 10.1002/ajmg.a.32364
- Nicholls RD, Knoll JH, Butler MG, et al. Genetic imprinting suggested by maternal heterodisomy in nondeletion Prader-Willi syndrome. Nature. 1989 Nov 16;342(6247):281–285.
- Glenn CC, Driscoll DJ, Yang TP, et al. Genomic imprinting: potential function and mechanisms revealed by the Prader-Willi and Angelman syndromes. Mol Hum Reprod. 1997 Apr;3(4):321–332.
- Horsthemke B, Maat-Kievit A, Sleegers E, et al. Familial translocations involving 15q11-q13 can give rise to interstitial deletions causing Prader-Willi or Angelman syndrome. J Med Genet. 1996 Oct;33(10):848–851.
- Flori E, Biancalana V, Girard-Lemaire F, et al. Difficulties of genetic counseling and prenatal diagnosis in a consanguineous couple segregating for the same translocation (14;15) (q11;q13) and at risk for Prader-Willi and Angelman syndromes. Eur J Hum Genet. 2004 Mar;12(3):181–186.
- Bittel DC, Butler MG. Prader-Willi syndrome: clinical genetics, cytogenetics and molecular biology. Expert Rev Mol Med. 2005 Jul 25;7(14):1–20.
- Bittel DC, Kibiryeva N, Sell SM, et al. Whole genome microarray analysis of gene expression in Prader-Willi syndrome. Am J Med Genet A. 2007 Mar 1;143A(5):430–442.
- Gray TA, Saitoh S, Nicholls RD. An imprinted, mammalian bicistronic transcript encodes two independent proteins. Proc Natl Acad Sci U S A. 1999 May 11;96(10):5616–5621.
- Sahoo T, Del Gaudio D, German JR, et al. Prader-Willi phenotype caused by paternal deficiency for the HBII-85C/D box small nucleolar RNA cluster. Nat Genet. 2008 Jun;40(6):719–721.
- Duker AL, Ballif BC, Bawle EV, et al. Paternally inherited microdeletion at 15q11.2 confirms a significant role for the SNORD116 C/D box snoRNA cluster in Prader-Willi syndrome. Eur J Hum Genet. 2010 Nov;18(11):1196–1201.
- de Smith AJ, Purmann C, Walters RG, et al. Elucidating the aetiology of Prader-Willi syndrome: deletion of the HBII-85 class of snoRNA is associated with hyperphagia, obesity and hypogonadism. J Med Genet. 2009 Sep;46:S83–S83.
- de Smith AJ, Purmann C, Walters RG, et al. A deletion of the HBII-85 class of small nucleolar RNAs (snoRnas) is associated with hyperphagia, obesity and hypogonadism. Hum Mol Genet. 2009 Sep 1;18(17):3257–3265.
- Wevrick R, Francke U. Diagnostic test for the Prader-Willi syndrome by SNRPN expression in blood. Lancet. 1996 Oct 19;348(9034):1068–1069.
- Carrel AL, Huber S, Allen DB, et al. Assessment of SNRPN expression as a molecular tool in the diagnosis of Prader-Willi syndrome. Mol Diag. 1999 03 01;4(1):5–10.
- Schulze A, Hansen C, Skakkebaek NE, et al. Exclusion of SNRPN as a major determinant of Prader-Willi syndrome by a translocation breakpoint. Nat Genet. 1996 Apr;12(4):452–454.
- Lei M, Mitsuhashi S, Miyake N, et al. Translocation breakpoint disrupting the host SNHG14 gene but not coding genes or snoRnas in typical Prader-Willi syndrome. J Hum Genet. 2019 Jul;64(7):647–652.
- Bieth E, Eddiry S, Gaston V, et al. Highly restricted deletion of the SNORD116 region is implicated in Prader-Willi Syndrome. Eur J Hum Genet. 2015 Feb;23(2):252–255.
- Kordys M, Sen R, Warkocki Z. Applications of the versatile CRISPR-Cas13 RNA targeting system. Wiley Interdiscip Rev RNA. 2022 May;13(3):e1694. doi: 10.1002/wrna.1694
- Liu L, Pei DS. Insights gained from RNA editing targeted by the CRISPR-Cas13family. Int J Mol Sci. 2022 Sep 27;23(19):11400.
- Abudayyeh OO, Gootenberg JS, Konermann S, et al. C2c2 is a single-component programmable RNA-guided RNA-targeting CRISPR effector. Science. 2016 Aug 5;353(6299). doi: 10.1126/science.aaf5573
- Liu L, Li X, Ma J, et al. The molecular architecture for RNA-Guided RNA cleavage by Cas13a. Cell. 2017 Aug 10;170(4):714–726 e10.
- Gootenberg JS, Abudayyeh OO, Lee JW, et al. Nucleic acid detection with CRISPR-Cas13a/C2c2. Science. 2017 Apr 28;356(6336):438–442. doi: 10.1126/science.aam9321
- Myhrvold C, Freije CA, Gootenberg JS, et al. Field-deployable viral diagnostics using CRISPR-Cas13. Science. 2018 Apr 27;360(6387):444–448.
- Kellner MJ, Koob JG, Gootenberg JS, et al. SHERLOCK: nucleic acid detection with CRISPR nucleases. Nat Protoc. 2019 Oct;14(10):2986–3012.
- Chandrasekaran SS, Agrawal S, Fanton A, et al. Rapid detection of SARS-CoV-2 RNA in saliva via Cas13. Nat Biomed Eng. 2022 Aug;6(8):944–956.
- Gootenberg JS, Abudayyeh OO, Kellner MJ, et al. Multiplexed and portable nucleic acid detection platform with Cas13, Cas12a, and Csm6. Science. 2018 Apr 27;360(6387):439–444. doi: 10.1126/science.aaq0179
- Yang L-Z, Gao B-Q, Huang Y, et al. Multi-color RNA imaging with CRISPR-Cas13b systems in living cells. Cell Insight. 2022 08 01;1(4):100044.
- Abudayyeh OO, Gootenberg JS, Essletzbichler P, et al. RNA targeting with CRISPR-Cas13. Nature. 2017 Oct 12;550(7675):280–284.
- Cox DBT, Gootenberg JS, Abudayyeh OO, et al. RNA editing with CRISPR-Cas13. Science. 2017 Nov 24;358(6366):1019–1027.
- Smargon AA, Cox DBT, Pyzocha NK, et al. Cas13b is a type VI-B CRISPR-Associated RNA-Guided RNase differentially regulated by accessory proteins Csx27 and Csx28. Mol Cell. 2017 Feb 16;65(4):618–630 e7.
- Konermann S, Lotfy P, Brideau NJ, et al. Transcriptome Engineering with RNA-Targeting Type VI-D CRISPR Effectors. Cell. 2018 Apr 19;173(3):665–676.
- Wang B, Zhang T, Yin J, et al. Structural basis for self-cleavage prevention by tag: anti-tag pairing complementarity in type VI Cas13 CRISPR systems. Mol Cell. 2021 Mar 4;81(5):1100–1115 e5.
- Holm VA, Cassidy SB, Butler MG, et al. Prader-Willi syndrome: consensus diagnostic criteria. Pediatrics. 1993 Feb;91(2):398–402.
- Kubota T, Das S, Christian SL, et al. Methylation-specific PCR simplifies imprinting analysis. Nat Genet. 1997 May;16(1):16–17.
- Clayton-Smith J, Laan L. Angelman syndrome: a review of the clinical and genetic aspects. J Med Genet. 2003 Feb;40(2):87–95. doi: 10.1136/jmg.40.2.87
- Del Gaudio D, Shinawi M, Astbury C, et al. Diagnostic testing for uniparental disomy: a points to consider statement from the American College of Medical Genetics and Genomics (ACMG). Genet Med. 2020 Apr 16;22(7):1133–1141.
- Chien SC, Chen CP, Liou JD. Prenatal diagnosis and genetic counseling of uniparental disomy. Taiwan J Obstet Gynecol. 2022 Mar;61(2):210–215. doi: 10.1016/j.tjog.2022.02.006