Abstract
The assessment of the immunogenicity of recombinant therapeutic proteins (RTPs) has received more attention in the past 4 years than in the previous 20 years. The induction of clinically adverse events in RTP-treated patients and the subsequent measurement of antibodies to those RTPs has challenged the scientific community to re evaluate the methods and techniques used for determining the immunogenic potential of therapeutic proteins. One preclinical strategy for determining the relative immunogenicity of RTPs is the use of a comparative hyperimmunization technique in animals that optimizes an immunological response. This approach has utility for analyzing the immunogenic potential of different formulations as well as for potential adverse effects. The hyperimmunization model may also provide a source of antisera specific to the RTP that can be used during selection of the appropriate assay technique(s) and conditions for measuring the immune response. Solid- or liquid-phase, affinities and the frequency of washes, isotypes, and sensitivities are key parameters that have become the focus of assay development techniques. The techniques that will be discussed include enzyme-linked immunoassays, surface plasmon resonance (Biacore™), and capillary electrophoresis.
INTRODUCTION
Preclinical immunogenicity is a toxicology parameter that is challenged by the lack of definitive predictive models, but is a regulatory expectation for the IND submission of recombinant protein therapeutics (RTP). The characterization of antibody responses in preclinical studies is performed primarily to address the concern of altered pharmacokinetics in the animal model due to the presence of anti-RTP antibodies clearing the drug from the system and therefore altering the exposure level. Adverse events due to immunogenicity are rare in the toxicology model, but when they occur, they can be illustrative of potential clinical adverse events. Our laboratory has designed models for the comparative assessment of antibody responses to RTPs that may reflect the relative immunogenic potential in humans. Optimal measurement and characterization techniques for antibody responses are also discussed.
Comparative Immunogenicity Models
The primate comparative hyperimmunization model is designed with multiple escalating doses (10 to 100 μg/monkey) of the therapeutic protein emulsified in Freund's adjuvant () and is performed in accordance with approved animal care and use protocols. The intramuscular doses are split into 2 injections, 1 in each leg, to avoid the discomfort associated with the adjuvant. Blood samples are collected prior to immunization for a baseline control and then on days 7 and 14 in an effort to obtain lower affinity antibodies.
FIG. 1. Monkey comparative hyperimmunization design. Primary dose is emulsified in 1% Tween 80/25% Complete Freunds Adjuvant. All secondary doses are emulsified in 1% Tween 80/25% Incomplete Freunds Adjuvant.
Samples are collected multiple times near the end of the study, days 35 through 70, to obtain sufficient volumes for use as positive control antisera and for the preparation of affinity purified standards for use in preclinical and clinical assays. The animals are rested for 14 days after the eight protein dose and then challenged with an intravenous dose of 100 μg/kg to assess the potential for hypersensitivity by clinical observations. Five recombinant protein analogs were evaluated in the primate comparative hyperimmunization model and the incidence of antibody responses was compared to the immunogenicity data obtained from protein treatment without adjuvant (safety studies) and compared to publicly reported clinical immunogenicity data. Although the dosing regimens were different between the hyperimmunization study, safety study and clinical trials, the percent incidence of antibody responses are informative ().
FIG. 2. Examples of 5 proteins that were tested in the hyperimmunization model with adjuvant compared to the immunogenicity data obtained from protein treatment without adjuvant (safety studies) and compared to the reported clinical immunogenicity data and reported clinical adverse events (AE). Recombinant Insulin, Leptin, tissue plasminogen activator (TPA), parathyroid hormone (PTH), human growth hormone (hGH). Percent (%) incidence of positive responders with anti-recombinant therapeutic protein (RTP) antibodies out of total analyzed population.
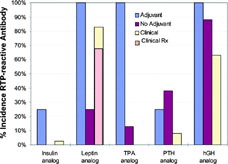
The lispro insulin analog, a 2-amino acid (aa) sequence variant analog of recombinant human insulin, induced antibodies in approximately 25% of monkeys when hyperimmunized with adjuvant, but there were no responses in monkeys treated with the insulin analog without adjuvant (Zwickl et al., Citation1995). Clinically, there is a reported 1%–3% incidence of antibodies detected in patients treated with lispro insulin (Eli Lilly and Company, Citation2004a; Fineberg et al., 2003). Recombinant human leptin (13 aa variant) induced a 100% incidence of antibodies when administered with adjuvant and a 25% incidence without adjuvant. These results correlated with the clinical findings of antibodies to leptin in 83% of the patients treated, with 67% of those experiencing injection site reactions. Correlation was not observed with a recombinant tissue plasminogen activator (TPA) protein that induced 100% and 13% incidence of antibodies in monkeys with and without adjuvant, respectively (Zwickl et al., Citation1996). There are no reported observations of immunogenicity in patients, but this may be due to the single-dose acute treatment indication and therefore a lack of experience with readministration of tPA. An abbreviated sequence of parathyroid hormone (rPTH) induced antibodies in 25% of monkeys treated with adjuvant.
The non-adjuvant treated monkeys produced antibodies at lower titers but a higher incidence of 38%. Clinically, immune responses to rPTH were observed in 8% of patients without reported adverse events (Eli Lilly and Company, Citation2004b). Recombinant human sequence human growth hormone (hGH) was compared to methionyl-hGH in the monkey model with very predictive results (Zwickl et al., Citation1991). Human growth hormone is an endogenous human protein of 23 kD MW with 4 aa difference in homology from monkey growth hormone. The analog is a 1 aa modification (5 aa difference from monkey). Recombinant hGH was not treated in monkeys with adjuvant, but repeated dosing with hGH, without adjuvant, induced antibodies in 23% of monkeys (Zwickl et al., Citation1991) and 1% of patients (Eli Lilly and Company, Citation2005). The methionyl-modified hGH protein induced strong antibody responses in 100% and 88% of monkeys treated with and without adjuvant, and in 63% of patients in clinical trials.
The use of transgenic mice for comparative immunogenicity of recombinant therapeutic proteins has previously been reported by Otteson et al. (Citation1994) for human insulin analogs and Stewart et al. (Citation1989) for modified human tissue plasminogen activator. The Transgenic Mouse Model was designed similar to that of Otteson and was used to determine the immunogenic potential of amino acid variant analogs (FLINTs) to a human Fas Ligand Inhibitory protein (DcR3). The DcR3 Transgenic mouse, derived from the FVB mouse strain, constitutively secretes approximately 200 to 600 ng DcR3/mL of serum. A Phase I pilot study was performed to determine the immune responsiveness of wild-type (wt-) FVB mice to DcR3 as compared to the transgenic (t-) mouse, and to 2 other common wild-type strains, Balb/c and C57BL/6J.
Mice were immunized with DcR3 (20 μg/mouse) in Freund's Complete Adjuvant on day 0 and again on day 21 with Freund's Incomplete Adjuvant (). Blood was collected on day 33 for analysis of DcR3-reactive antibody by ELISA. Wt-C57BL/6 and Balb/c mice produce low to moderate antibody response to DcR3 immunization, but wt-FVB mice developed high antibody responses (). As expected, the transgenic-FVB mice were negative for antibodies to DcR3, demonstrating a tolerance to human DcR3. This pilot study also provided positive control sera for the development and validation of an ELISA for the detection of DcR3-reactive IgG and FLINT-reactive IgG. Utilizing the same design and dosing regimen, wt- and DcR3 t-FVB mice (n = 3 wt-/group and 6 t-/group) were immunized with FLINT analogs containing sequence variations ranging from a 1 aa change to 5 aa changes (). The purpose of this Phase II study was to determine the rank order immunogenicity of native human DcR3 (0 aa changes) and the 5 FLINT analogs.
FIG. 3. Transgenic mouse model design.
TABLE 1 Phase I: Mouse strain responses to DcR3
TABLE 2 Phase II: Mouse comparative study design
The incidence of antibodies to human DcR3 was 100% in the DcR3 and FLINT analog-treated wt-FVB mice, with the exception of the 5 aa FLINT analog incidence of 67% (). The human DcR3 and the 1 aa FLINT analogs did not induce an immune response in the DcR3 t-FVB mice, however, 2, 3, and 5 aa sequence changes produced an increasing incidence (17% to 33%) of anti-DcR3 antibodies. Interestingly, the 5 aa FLINT produced a higher incidence with lower titers of antibody.
FIG. 4. Mouse anti-DcR3 antibody responses to DcR3 and FLINT analog immunizations.
When the same samples were analyzed for anti-FLINT antibodies, again the incidence of antibodies to human DcR3 was 100% in the DcR3 and all of the FLINT analog-treated wt-FVB mice, but the human DcR3 and the 1 aa FLINT analogs did not induce an immune response in the DcR3 t-FVB mice (). The DcR3 t-FVB mice responded with 33%, 17%, 100% incidence of anti-FLINT antibodies to 2, 3, and 5 aa changes, respectively. The mean antibody concentration was highest in the 3aa sequence change, however incidence is a stronger prediction parameter than individual response. Therefore, the overall rank order of immunogenicity by number of sequence substitutions was native 0 = 1 = 1 < 3 ≤ 2 < 5 aa.
FIG. 5. Mouse anti-FLINT analog antibody responses to FLINT analogs.
The comparative immunization models are useful tools for evaluating the relative RTP immunogenicity when comparing native protein to analog, analog to analog, or variations in formulation. The models also generate positive antisera for development of the immunoassays. The monkey model may also be used to evaluate the potential for adverse events when high antibody titers are developed, including the evaluation of a potential for IgE response if a rechallenge is performed. The generation of an antibody to a recombinant therapeutic protein in an animal model can be used effectively for comparison of responses and the identification of potential adverse events.
Immunogenicity Assays for Preclinical Studies
The International Conference on Harmonization Guideline S6 (Citation1997) and the U.S. FDA Points to Consider for Monoclonal Antibody Products (Citation1997) documents recommend the pretreatment and end of study determination of incidence and titer of antibody responses to the biotherapeutic. These documents also recommend that the antibody data be evaluated in context with any toxicological findings or observations such as the alteration of PK/PD, observed adverse events, or immune complex formation. The measurement of antibodies is considered to be a qualitative analysis, or “quasi-quantitative,” with a sensitivity of 250 to 500 ng/ml (Mire-Sluis et al., Citation2004). A reference standard for determining the limit of detection must be selected carefully. However, the sensitivity is not simply an interpolation from a standard curve, but rather a complex assessment of the naïve cut-off value (cut-point), the lowest measurable positive response, and the interpolated equivalence to a “known” standard. A treatment-induced “positive” antibody response is usually defined as (1) above the naïve cut-off, and (2) increased titer from individual pretreatment, and (3) > 30% inhibition of the response by pre-incubation of the sample with free drug. In addition to criteria for establishing a “positive,” assay interference and cross-reactivity concerns should also be addressed.
The choice of immunoassay technique varies in format. There are direct, sandwich, bridging, and competitive platforms using radioligand, enzymatic, fluorescent, chemiluminescent, or electrochemical reporters (Wild, Citation2001). The appropriate assay for measuring antibodies to the biotherapeutic is dependent upon the therapeutic protein class. When looking for antibodies to a non-immunoglobulin recombinant protein, all of the platforms and reporters listed above may be viable options. However, if the protein is a humanized or human immunoglobulin therapeutic, the choices for detection of primate anti-human antibodies (PAHAs) or human anti-human antibodies (HAHAs) are limited, usually due to secondary antibody cross-reactivity. Other considerations for selection of the assay platform include: (1) the desired measurement parameter (IgG, IgM, or IgG subclasses), (2) the potential for drug interference in the test system that may occur due to a long half-life and/or the lack of a “wash-out” period in the study design, and (3) the available technology in the laboratory. It is highly recommended that the appropriate regulatory agency be consulted to confirm that the selection of assay parameters and platform are satisfactory for that particular recombinant protein therapeutic.
Our laboratory has investigated several immunoassay platforms in efforts to identify the “optimal” approach to measuring PAHAs in serum collected from monkeys treated with an IgG4 therapeutic monoclonal antibody (tAb1). Reagents and standards were independently titrated for optimal signal:noise ratios for four immunoassay platforms: Bridging ELISA, Competitive Inhibition ELISA, Surface Plasmon Resonance, and Bridging Capillary Electrophoresis (). An affinity-purified standard (Affi-pure Ig) was prepared from positive control sera collected from tAb1 hyperimmunized monkeys. Cut-offs were determined by analysis of serum from ≥20 naïve monkeys in each assay platform. The cut-off was calculated as the Mean naïve absorbance + 1.645 (Standard Deviation) in an attempt to achieve 95% confidence that 5% of the evaluated normal sera would be false positives (). Although it was not used for this tAb, the median and the absolute deviation of the median may be useful when high false positive outliers skew the cut-off evaluation (Mire-Sluis et al., Citation2004).
FIG. 6. Immunoassay platform schematics.
FIG. 7. Baseline anti-therapeutic antibody (α-tAb1) measured in a bridging ELISA and reported as absorbance (OD) value.
Pre- and post-hyperimmune (day 56) samples from 4 cynomolgus monkeys were evaluated in each of the four assay platforms. In the Bridging ELISA, 1 pretreatment and 2 post-treatment samples were above the established cut-off of 1 μ g/ml in 4% matrix (). The OD of the highest positive serum sample (#93122; 1:4000) was interpolated from the Affi-Pure Ig standard that resulted in an assigned concentration of 8113 μ g/ml. When the same samples were analyzed using the Competitive Inhibition ELISA, where a known concentration of tAb1 competes with an unknown concentration of anti-tAb1 to bind to tAb1 target protein immobilized on a 96-well plate, 1 pretreatment (#93122) and 3 post-treatment samples were above the cut-off of 125 ng/mL ().
FIG. 8. Bridging ELISA anti-therapeutic antibody (α -tAb1) results from analysis of samples from 4 monkeys prior to (Pre-Immmune) and 56 days after (Post-Immune) weekly tAb1 hyperimmunization with adjuvant. The absorbance value of #93122 was interpolated from an Affi-pure α -tAb1 standard curve and assigned a value of 8113 relative μ g/mL.
FIG. 9. Competitive Inhibition ELISA anti-therapeutic antibody (α-tAb1) results from analysis of samples from 4 monkeys prior to (Pre-Immmune) and 56 days after (Post-Immune) weekly tAb1 hyperimmunization with adjuvant. The absorbance value of #93122 was interpolated from an Affi-pure α-tAb1 standard curve and assigned a value of 8381 relative μg/mL.
When interpolated from the affi-pure standard curve and corrected for dilution (1:60,000 in 10% matrix), the highest responder (#93122) was reported with a physiologically improbable value of 8381 μg/mL. Using the Biacore 3000 for surface plasmon resonance analysis of the samples, 1 pretreatment (#93122) and 3 post-treatment samples were above the cut-off of 10 μg/mL (). When interpolated from the Affi-pure standard curve and corrected for dilution (1:10), the highest responder (#93122) was reported as 130 μg/mL.
FIG. 10. Surface Plasmon Resonance (SPR) immunoassay anti-therapeutic antibody (α-tAb1) results from analysis of samples from 4 monkeys prior to (Pre-Immmune) and 56 days after (Post-Immune) weekly tAb1 hyperimmunization with adjuvant. The Relative Response Unit value of #93122 was interpolated from an Affi-pure α-tAb1 standard curve and assigned a value of 130 relative μg/mL.
The bridging assay format with capillary electrophoresis detection of an E-Tag™ label (ACLARA/ViroLogic) demonstrated a cut-off of 80 ng/ml and detected positives in 1 pretreatment and 2 post treatment samples (). The interpolated value for the highest responder was 8639 μg/mL relative to the affi-pure standard curve.
FIG. 11. Bridging Capillary Electrophoresis immunoassay anti-therapeutic antibody (α-tAb1) results from analysis of samples from four monkeys prior to (Pre-Immmune) and 56 days after (Post-Immune) weekly tAb1 hyperimmunization with adjuvant. The Relative Fluorescent Unit value of #93122 was interpolated from an Affi-pure α-tAb1 standard curve and assigned a value of 8639 relative μg/mL.
In an attempt to reconcile the standard interpolated values, affi-pure anti-tAb Ig material was compared to a commercially purchased monoclonal murine anti-human IgG4 standard for reactivity to the tAb1 (IgG4). The monoclonal anti-IgG4 standard demonstrated 10-fold higher sensitivity in the bridging capillary electrophoresis assay (). This was confirmed in the Bridging ELISA as well (data not shown), indicating that the selection of reference standard can significantly alter the assigned sensitivity value of an anti-therapeutic protein antibody immunoassay. Therefore, although the preparation of an affinity purified RTP-reactive polyclonal Ig standard material, which contains antibodies of mixed affinities, is the more relevant standard for the intent of these assays, an investigator may report a higher sensitivity of an assay by using a high-affinity monoclonal standard.
FIG. 12. Bridging Capillary Electrophoresis immunoassay comparison of sensitivity of affinity purified anti-tAb1 Ig (AffiPure a-tAb1) and monoclonal mouse anti-human IgG4 (Mu a-huIgG) standards (ng/mL) and correlation to dilutional titration of the positive control a-tAb1 serum.
During development of immunoassays for anti-therapeutic proteins, the potential for assay interference is also evaluated. Common interfering substances such as hemoglobin and lipids in blood-derived samples, and endogenous cross-reacting antibodies, such as rheumatoid factor and autoantibodies, are assessed by percent recovery of the addition of a known amount of anti-RTP Ig to samples containing the interfering substance (data not shown). With the advent of monoclonal antibody therapeutics that have longer half-lives than common recombinant human proteins, the issue of drug interference in antibody immunoassays has become more prevalent. During development of an anti-RTP immunoassay, a common practice for demonstrating specificity of the assay is to add free RTP to a sample containing known amounts of anti-RTP antibody and looking for inhibition of the expected signal. However, if an assay is expected to reliable perform in the presence of therapeutic serum levels of RTP, specificity may not be demonstrated. The bridging ELISA for anti-tAb1 Ig was evaluated for the effects of increasing concentrations of tAb in positive control sera ().
FIG. 13. Bridging ELISA evaluation of therapeutic antibody (tAb1) drug interference. Increasing concentrations of tAb1 were added to low-, mid-, and high-titer positive control anti-tAb1 serum samples at 4% matrix. The presence of 0.1 ug/ml tAb1 reduces the measured response of the low and mid controls to below the cut-off.
A low positive control that repeatedly analyzes above the cutoff (“positive”) under normal assay conditions becomes a “negative,” below the cut-off, when ≥0.1 μg/ml of tAb is added to the sample. The high positive control became negative when ≥1 μg/ml of tAb was added to the sample. This effect was also evaluated when using the affi-pure standard material in the anti-tAb bridging ELISA (). The response of a 0.125 μg/ml standard in 4% matrix was reduced from an above cut-off “positive” to a below cut-off “negative” when ≥0.1 μg/ml of tAb was added to the sample and a 2 μg/ml affi-pure standard was inhibited to below cut-off “negative” status when ≥1 μg/ml of tAb was added.
FIG. 14. Bridging ELISA evaluation of therapeutic antibody (tAb1) drug interference. Increasing concentrations of tAb1 were added to low-, mid-, and high concentrations of affinity purified anti-tAb1 Ig standard in 4% matrix. The presence of 0.1 μg/mL tAb1 reduces the measured response of 0.125 μg/mL anti-tAb1Ig to below the cut-off and 1 μg/ml tAb1 negates the measurement of ≤2 μg anti-tAb1 std/ml.
In a typical safety study, where monkeys were administered up to 30 mg tAb1/kg biweekly for 6 weeks with a 16-week recovery period, the circulating tAb1 concentration in serum after the recovery period was ∼ 35 μg/ml. Although the samples are diluted 1:25 for analysis, the tAb1 concentration would still be 10-fold higher than the allowable interference level of the assay (0.1 μg tAb1/ml). Using the bridging-capillary electrophoresis platform, experiments were performed in an effort to reduce the interference of drug (). The concentrations of biotin-tAb1 and E Tag™-TAb1 conjugates were increased from 1 nM up to 8 nM to compete with the free tAb1 concentration. This approach had optimal effects at the 4 nM conjugate concentration and allowed more reportable “positives” above the cut-off with up to 6 μg/ml of free tAb1.
FIG. 15. Bridging capillary electrophoresis with increasing molar concentrations of conjugates (1, 2, 4, and 8 nM Biotin-tAb1 and E-tag tAb1) to reduce tAb1 assay interference. Increasing the concentration of the conjugates decreases the drug interference and allows for more reportable positives 3–12 ug/ml.
It is possible that this approach may be useful in other assay platforms such as electrochemi-luminescent assays, but the best solution to the drug interference issue would be to eliminate drug interference altogether. Meanwhile, our current plan is to analyze all pretreatment samples and all post-treatment samples containing RTP concentrations less than the interference level as determined by toxicokinetic analysis. All samples collected at the end of the study are analyzed regardless of RTP concentration. The resulting titers are reported with the caveat that interfering drug levels may cause underestimation of actual antibody levels.
The comparison of 4 immunoassay platforms resulted in the conclusion that surface plasmon resonance or bridging capillary electrophoresis may provide more information with less interference for all types of recombinant protein therapeutics. Electrochemiluminescence detection may also have this advantage, but the comparison experiments have not been performed. The E-Tag™ capillary electrophoresis platform may also allow for analysis of multiple immunoglobulin iso- or sub-type identification in a single sample analysis. The comparison demonstrated that the detection of “positives,” values above the established cut-off, may be a better indicator of assay sensitivity rather than prepared standards. The selection of the appropriate standard material should be physiologically relevant, however, the interpolation of results from those standards may be physiologically irrelevant. In 4 assay platforms, results for the same serum sample, interpolated against the same affinity-purified standard analyzed in on each platform, provided anti-RTP antibody concentrations that varied from 130 to 8639 μg/ml.
SUMMARY
Overall, no development programs in our company have been terminated because of antibody responses to the recombinant therapeutic protein in preclinical studies. The data are provided to clinicians for consideration during the design of clinical studies. Preclinically, the concern is primarily for alteration of pharmacokinetics or adverse events due to the presence of antibodies. Our comparative immunization models are the “worst case” scenarios for developing anti-RTP immunoglobulins and may be used as a relative correlation of immunologic or adverse event potential. Interestingly, in our experience, the clinical manifestations normally associated with the adverse events of an immune response (e.g., serum sickness due to immune complex formation or autoimmune disease) have not been observed in this model. The characterization of antibody responses in preclinical animal safety studies is a regulatory expectation, but how to achieve this expectation is still in development across the pharmaceutical industry. Our data suggests that the practice of driving an assay down to the guideline-referenced sensitivity by utilizing a high affinity monoclonal antibody standard, instead of using a physiologically relevant mixed affinity polyclonal antibody, is a simple method for assigning a mass unit sensitivity, but it may not provide an accurate assessment of assay sensitivity. The true “sensitivity” of an assay is not a concentration interpolated from an irrelevant standard curve, but rather the ability of the assay to detect antibody above the baseline cut-off value established for that assay. A solid-phase bridging ELISA may produce very low backgrounds and seemingly good sensitivity with a monoclonal antibody, but it may not detect polyclonal antibody in a dilution of positive serum that an SPR or ECL assay could detect. Therefore, the selection of a method to fulfill regulatory expectations takes thoughtful consideration and perhaps the development of multiple platforms and standards to identify the optimal approach.
The authors would like to thank the following contributors from Eli Lilly and Company: Simone Hengeltraub, Denise Sun-Lin, Anthony Butterfield, and the Lilly Research Laboratories Primate Studies Area. We would also like to thank the following investigators from ViroLogic (previously ACLARA) for their contracted services: Hrair Kirakossian and Hossein Salimi-Moosavi.
REFERENCES
- Eli Lilly and Company. HUMALOG Lispro Injection (rDNA Origin). Prescribing Information #PA 9129 FSAMP. Eli Lilly and Company, Indianapolis, IN 2004a
- Eli Lilly and Company. FORTEO teriparatide (rDNA Origin) injection. Prescribing Information #PA 9242 FSAMP. Eli Lilly and Company, Indianapolis, IN 2004b
- Eli Lilly and Company. HUMATROPE Somatropin (rDNA Origin) for Injection Vials and Cartridges. Prescribing Information #PA 1644 AMP. Eli Lilly and Company, Indianapolis, IN 2005
- Fineberg S. E., Huang J., Brunelle R., Gulliya K. S., Anderson J. H. Effect of long-term exposure to insulin LisPro on the induction of antibody response in patients with Type 1 or Type 2 diabetes. Diabetes Care 2003; 26: 89–96, [PUBMED], [INFOTRIEVE], [CSA]
- International Committee for Harmonization. Guidance for Industry. S6 Preclinical Safety Evaluation of Biotechnology-Derived Pharmaceuticals. 1997, Available at 〈http://www.fda.gov/cder/guidance/1859fnl.pdf〉
- Mire-Sluis A. R., Barrett Y. C., Devanaraayan V., Koren E, Liu H., Maia M., Parish T., Scott G., Shankar G., Shores E., Swanson S. J., Taniguchi G., Wierda D., Zuckerman L. A. Recommendations for the design and optimization of immunoassays used in the detection of host antibodies against biotechnology products. J. Immunol. Meth. 2004; 289: 1–16, [CSA], [CROSSREF]
- Otteson J. L., Nilsson P., Jami J., Weilguny D., Duhrkop M., Bucchini D., Havelund S., Fogh J. M. The potential immunogenicity of human insulin and insulin analogues evaluated in a transgenic mouse model. Diabetalogia 1994; 37: 1178–1185, [CSA]
- Stewart T. A., Hollingshead P. G., Pitts S. L., Chang R., Martin L. E., Oakley H. Transgenic mice as a model to test immunogenicity of proteins altered by site-specific mutagenesis. Mol. Biol. Med. 1989; 6: 275–281, [PUBMED], [INFOTRIEVE], [CSA]
- U.S. Department of Health and Human Services Food and Drug Administration, Center for Biologics Evaluation and Research. Points to Consider in the Manufacturing and Testing of Monoclonal Antibody Products for Human Use. #94D-0259. 1997, Available at 〈http://www.fda.gov/cber/guidelines.htm〉
- The Immunoassay Handbook, D. Wild. Nature Publishing Group, New York 2001
- Zwickl C. M., Cocke K. S., Tamura R. N., Holzhausen L. M., Brophy G. T., Bick P. H., Wierda D. Comparison of the immunogenicity of recombinant and pituitary human growth hormone in rhesus monkeys. Fundam. Appl. Toxicol. 1991; 16: 275–287, [PUBMED], [INFOTRIEVE], [CSA], [CROSSREF]
- Zwickl C. M., Hughes B. L., Piroozi K. S., Smith H. W., Wierda D. Immunogenicity of tissue plasminogen activators in rhesus monkeys: Antibody formation and effects on blood level and enzymatic activity. Fundam. Appl. Toxicol. 1996; 30: 243–254, [PUBMED], [INFOTRIEVE], [CSA], [CROSSREF]
- Zwickl C. M., Smith H. W., Zimmerman J. L., Wierda D. Immunogenicity of biosynthetic human LysPro insulin compared to native-sequence human and purified porcine insulins in rhesus monkeys immunized over a 6-week period. Arz. Forsch./Drug Res. 1995; 45: 524–528, [CSA]