Abstract
The objective of this study was to determine the inflammatory response initiated by various organic dusts by measuring in vitro interleukin-8 (I-8) production from transformed respiratory epithelial cells after dust exposure. To accomplish this objective, the following specific tasks were performed: 1) dust samples were collected from grain farms, grain storage facilities, and poultry houses and their endotoxin levels were determined; 2) A549 transformed respiratory epithelial cells were exposed to 0, 10, 100, or 1,000 μg/ml of organic dust or lipopolysaccharide (LPS); and, 3) production was measured using enzyme-linked immunosorbant assays (ELISAs). The results indicate that LPS induced at all concentrations. All dust types (corn, wheat, and poultry) induced at significantly higher levels than control and at significantly different levels between dust types. Overall there was an increasing trend of elevated production as the concentration of dust exposure was increased except at the highest concentration where IL-8 levels decreased and more cell death was observed. Corn dust exposure induced IL-8 that increased with increasing dust concentration and correlated with increasing amounts of LPS in the corn dust samples. However, IL-8 production in response to wheat dust was inversely related to LPS concentration suggesting that other factors besides LPS are present in the dust that are responsible for induction of IL-8 production. This study indicates that IL-8 induction varies between agricultural dust types and does not always correlate with endotoxin levels present in the dust. Therefore, other factors may be present in the dust that also elicit the immune response after exposure.
INTRODUCTION
The long-term inhalation of organic dust may lead to the occurrence of different respiratory diseases such as Organic Dust Toxic Syndrome, asthma, chronic bronchitis, and Farmer's Lung. These diseases result because of exposure to microorganisms and toxic substances present in the dust. This exposure results in infection, inflammation, or an exacerbated immune response. There are various factors present in agricultural dust that can cause these effects including bacteria, fungi, organic material, pesticides, and herbicides among other possible components (Clapp et al., Citation1994). When bronchial epithelial cells become irritated, the immune response initiates a cell-mediated inflammatory response as a protection mechanism (Saraf et al., 1999). Previous research of bronchial alveolar lavage fluid from exposed workers has shown that, in general, exposure to organic dust induces the immune system to secrete interleukin-1β, interleukin (IL)-6, interleukin-8, and tumor necrosis factor-α (TNFα) (Larsson et al., Citation1994; Wang et al., Citation1997; Saraf et al., 1999).
IL-8 is a chemokine or low-molecular-weight cytokine. It is a pro-inflammatory protein whose primary effect is the active recruitment of neutrophils to the site of inflammation (Von Essen et al., Citation1988; Strieter et al., Citation2002). Increases in IL-8 expression directly correlate with an increase in cellular immune response both in vivo and in vitro; therefore, IL-8 is commonly used as a measurable indicator to assess the immune response to exposure events. Palmberg et al. (Citation1998) conducted experiments that linked the exposure of respiratory epithelial cells to swine dust in vitro to the production of IL-8 as well as to the activation and recruitment of neutrophils during respiratory illnesses. This group also showed that A549 transformed human respiratory epithelial cells could be induced to express high levels of IL-8 when exposed to swine dust, but had no response to grain dust (consisting of coarsely milled barley).
Respiratory epithelial cells are one of the major sources of cytokines following airway exposure to dust. Extracts from various organic dusts have been shown to have physiological effects on the lung that are similar to those that occur following exposure to lipopolysaccharide or endotoxin. Research by Von Essen et al. (Citation1999) and Clapp et al. (Citation1993) indicated that different types of organic dusts caused a variety of effects in the lungs, and that each ranged in the intensity of their elicited immune responses. For example, corn dust caused higher levels of chemotactic activity than dust from soybeans, wheat, or endotoxin (Clapp et al., Citation1993).
Previous studies of the effects of agricultural-dust exposure have also used a variety of exposure methods. For example, some researchers exposed cell cultures directly to unfiltered dust (Palmberg et al., Citation1998), while others prepared the dust extracts either by filtration (Von Essen et al., Citation1995, Citation1999) or by filtration and lyophilization (Ting-Ting et al., Citation1988). These differences in dust preparation and exposure methods have made it difficult to perform comparisons among these previous studies.
The purpose of the research reported here was to, for the first time, determine and directly compare the inflammatory potential of agricultural dusts generated in the poultry and grain industries (e.g., poultry, corn, and wheat dusts) in vitro as well as the endotoxin content present in each dust type. To avoid the aforementioned problems that have complicated data interpretation across the earlier cited studies, the current study utilized a standard method for dust preparation and testing, as well as a standardized enzyme-linked immunosorbant assay (ELISA) to evaluate the immunomodulatory/inflammatory potential of each dust in human respiratory epithelial cells.
MATERIALS AND METHODS
Culture and Growth of A549 Cells
A549 human respiratory epithelial cells (ATCC CCL-185, Rockville, MD) were grown in HAM's F-12 medium with 90% sodium bicarbonate and 10% fetal bovine serum. The media was supplemented with 1% streptomycin and penicillin and maintained at 37°C in 5% CO2.
Dust Extract Collection and Preparation
Agricultural dust was collected from both commercial and private farms and grain storage facilities within the same geographic area and under the same weather conditions (June-July). Corn, poultry, and wheat dusts were collected for analysis. Poultry dust samples were taken ≈1–2 meters above the ground and stored in sterile plastic bags until processing in the laboratory. Grain samples were collected from grain elevators through the discharge funnel at the bottom of the elevators. The grain was discharged for 5 sec to clear the discharge funnel. Then a grain sample was collected from the discharge funnel in a sterile plastic bag and returned to the lab for processing. Grain dust was collected in the laboratory by sifting the grain samples through a sterile wire strainer onto sterile aluminum foil. Samples were collected and stored in sterile plastic vials in a dessicator at 4°C until use.
Two aqueous dilutions of the dust samples were prepared in Hank's Balanced Salt Solution (HBSS) at 10,000 and 1,000 μg/ml (0.01 and 0.001 g/1 ml) of dust. Aqueous extracts of the dust were prepared by gently mixing the correct amount of dust in 10 ml of HBSS for 60 minutes. After mixing, the suspension was allowed to settle at room temperature for 90 min. Large particles of debris were removed from the sample by centrifugation (5,000 × g) for 10 min. The resulting supernatant was filtered through a 0.45 μm filter followed by a 0.20 μm filtration. A 50 μl sample of each filtered solution was plated on LB agar plates for 48 hrs to check for sterility. The sterile extracts were stored at 4°C until use. Aliquots of the initial dust dilution were further diluted for cell exposure. The cells were exposed to a total of four dust dilutions: 1,000, 100, 10, and 0 μg/ml.
LPS Extract Preparation and LPS Assays
Lipopolysaccharide (LPS) from Escherichia coli strain OP50 was used as a positive endotoxin control for IL-8 induction (Sigma #62325, St. Louis, MO). The LPS was diluted to a working concentration of 100 μg/ml in Ham's F-12 unsupplemented medium. Cells were exposed to four serial dilutions of LPS concentrations at 100, 50, 25, and 12.5 μg/ml. Endotoxin levels in duplicate dust samples were measured with the Limulus Ameobocyte Assay (LAL, Charles River Laboratories, Wilmington, MA).
Preparation of A549 Cells for Exposure Assays
A549 cells were harvested from growth flasks by adding 2.0 ml of trypsin-EDTA. The cells were centrifuged and re-suspended in 2.0 ml of HAM's F-12 supplemented medium. Cells were counted using a hemacytometer and then viable cells were used to inoculate designated wells of a 24-well plate (1 × 10⁵ cell/well).
Exposure of A549 Cells to Dust and LPS Extracts
Semi-confluent A549 cells were exposed to varying dust dilutions and LPS. In preparation for dust exposure, each well was washed three times with HAM's F-12 unsupplemented medium. Duplicate cell cultures were exposed to 1.0 ml of the appropriate dust or LPS dilution. The positive control wells were stimulated with LPS at the final concentrations of 100, 50, 25, and 12.5 μg/ml (Wang et al., Citation1996). The cells were exposed to the corn, wheat, or poultry dust at the final concentrations of 1,000, 100, 10, and 0 μg/ml (Wang et al., Citation1996). The cells were exposed for 24 hrs at 35.2°C in 5% CO2 and 95% humidity. Negative control cells were exposed to unsupplemented HAM's F-12 medium.
Cell Counts
Cell counts were performed in triplicate from each well to determine the number of cells producing IL-8. After the incubation period, the supernatant was removed from the exposed cells and placed into sterile 1.0 ml microcentrifuge tubes. At this time, the supernatant could either be used immediately for an ELISA assay or frozen away at −20°C. Trypsin-EDTA was then added to each well and incubated for 3–4 min to release the cells from their wells. Cell counts were subsequently done using trypan-blue dye exclusion and assessments on a hemocytometer. Only the viable cells were included in the final counts and calculations.
Quantitative Enzyme-Linked Immunosorbent Assay for Immunoreactive IL-8
IL-8 was measured in cell-culture supernatants using a commercially-available ELISA kit (DY208, R&D Systems, Minneapolis, MN). Four supernatant aliquots from four separate wells were analyzed per experiment and the IL-8 level averaged for each dust-exposure concentration. The ELISA was conducted in a 96-well microtiter plate with a detection antibody concentration of 20 ng/ml. The substrate solution was used in a 1:1 dilution of Color Reagent A (H202) and Color Reagent B (tetramethylbenzidine) (R&D Systems, DY999). The optical density of each well was measured using a microplate reader at 450 nm.
Statistical Analysis
Mean concentrations of IL-8 produced by A549 cells at different dust exposure concentrations, and between different types of dust exposures, were compared by two-tailed Analysis of Variance (ANOVA). Populations tested by ANOVA met the assumptions of equal variance and normal distribution. A two-tailed Dunnett's test as used to determine if IL-8 levels at each dust exposure concentration were significantly different from the control exposure (no dust, cell culture medium only). In addition, Dunnett's test was also used to determine if IL-8 levels produced by different dust types were significantly different from the control exposures and each other as well (Dunnett, Citation1955). Finally, linear regression was used to determine the potential correlation between dust endotoxin content and IL-8 levels produced in response to dust exposure based on the tested assumptions of normal distribution of data, equal variance, and independent measurements. The alpha level considered significant for all analyses was 0.05.
RESULTS
Endotoxin Content in Dust Samples
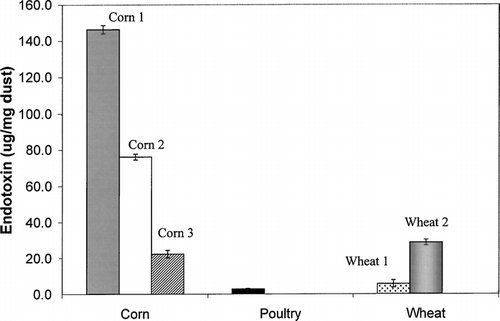
Since endotoxin/LPS is a known modulator of cytokine levels, the endotoxin level in each dust sample was measured (). Corn dust samples contained the highest levels of endotoxin (average 81.6 μg/mg), while poultry and wheat dusts contained significantly less endotoxin as measured by two-tailed ANOVA (average 2.9 and 17.2 μg/mg, respectively). In addition, two-tailed ANOVA indicated that there were significant differences in endotoxin content between different types of corn dust and wheat dust as well.
FIG. 1 Endotoxin levels of each dust sample. The error bars represent the mean of two separate experiments (4 averaged wells). Overall, corn dust samples contained more endotoxin than either poultry or wheat dust and this difference approached significance (p = 0.054). Within dust types, the endotoxin of individual corn and wheat dust samples were significantly different (p = 0.001, 0.012 respectively).
LPS Exposure
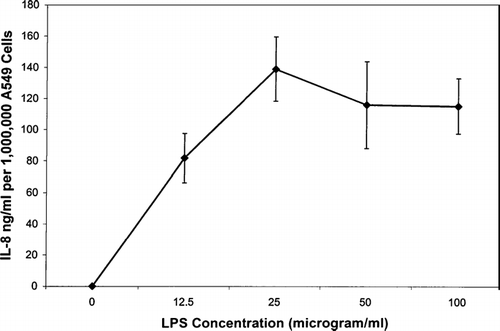
Purified E. coli LPS was used as a positive-control stimulant for the production of cytokines. The cells were exposed to LPS for 24 hrs at 35.2°C in 5% CO2 incubator at various dilutions. LPS concentrations ranging from 12 to 100 μg/ml induced the production of IL-8 by A549 respiratory epithelial cells. This confirmed that these cells do produce this cytokine in response to a known stimulus. The highest quantity of IL-8 produced in response to LPS was approximately 139 ng IL-8/million cells ().
Wheat Dust Exposure
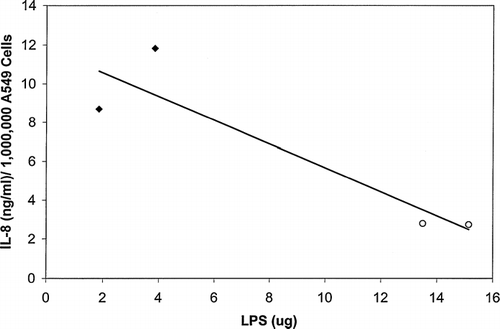
Sub-confluent A549 transformed respiratory epithelial cells were exposed to two different wheat dust samples. The cells were exposed to the wheat dust at the final dust concentrations of 1,000, 100, 10, or 0 μg/ml as described by Wang et al. (Citation1996). Wheat Sample 1 (F(3,4) = 14.07, p = 0.01) and 2 (F(3,4) = 774.54, p < 0.0001) induced significantly increasing IL-8 production with increasing dust concentration (). The highest concentration of IL-8 produced was ≈ 110 ng IL-8/million cells after exposure to Wheat Sample 2. To determine potential correlations between wheat dust concentration and endotoxin content, the linear correlation of endotoxin content with IL-8 level was calculated using IL-8 levels produced in response to a wheat dust exposure concentration of 100 μg/ml (). Linear regression analysis indicated that there was a negative correlation between IL-8 production after A549 cell exposure to wheat dust and endotoxin levels in the dust extract. This correlation was significant as indicated by two-tailed ANOVA. As the endotoxin concentration present in the dust samples increased, the IL-8 levels decreased (, , and ).
FIG. 3 Interleukin-8 production (ng per one-million cells) of A549 transformed respiratory epithelial cells when exposed to wheat (2a), poultry (2b) or corn (2c) dusts. Each data point is the mean of two experiments.
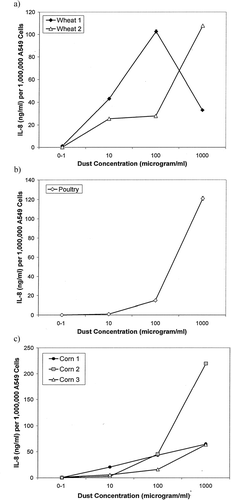
FIG. 4 Linear regression analysis of IL-8 with LPS (endotoxin) content of the wheat dust. As the LPS concentration increases in the wheat dust samples, the IL-8 levels significantly decrease (R2 = 0.83, p < 0.0001). The LPS concentrations represent the amount of LPS in micrograms per 1 mg dust. The IL-8 levels reported in this graph were produced in response to exposure to 100 μg wheat dust. Wheat 1 dust LPS levels are indicated by the ⧫ symbol, and Wheat 2 dust LPS levels are indicated by the ○ symbol.
Poultry Dust Exposure
Only one sample of poultry dust was collected and tested. The cells were exposed to the wheat dust at final concentrations of 10,000, 1,000, 100, 10 or 0 μg/ml. Two-tailed ANOVA indicated that the poultry dust induced IL-8 production in A549 cells that significantly increased with increasing dust concentration (F(3,4) = 30.57, p = 0.0032). A peak IL-8 production of 120 ng/IL-8/million A549 cells occurred at the dust concentration of 1,000 μg/ml ().
Corn Dust Exposure
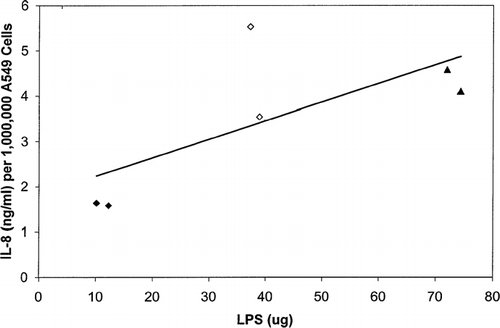
A549 cells were exposed to three different corn samples at final concentrations of 1,000, 100, 10, or 0 μg/ml. All corn dust samples caused an overall significant increase in IL-8 production as the dust concentration increased as measured by two-tailed ANOVA (Corn 1: F(3,4) = 199.46, p < 0.0001; Corn 2: F(3,4) = 18.27, p = 0.0085; Corn 3: F(3,4) = 77.5, p = 0.0005) (). The maximum IL-8 produced by Corn 2 was ≈ 220 ng IL-8/million cells at the dust concentration of 1,000 μg/ml. There were significant differences in the IL-8 production at the 10, 100 and 1,000 μg/ml Corn 1 dust exposure levels (F(3,4) = 199.46, p < 0.0001) that correlated with an increase in cell death as confirmed by trypan-dye exclusion and reduced cell counts (32.5% reduction in viable cells at 1,000 μg/ml Corn 1 exposure and 24.5% reduction at 100 μg/ml). Only viable cells were included in the calculations for total IL-8 production. To determine potential correlations between corn dust concentration and endotoxin content, the linear correlation of endotoxin content with IL-8 level was calculated using IL-8 levels produced in response to a corn dust exposure concentration of 100 μg/ml (). In contrast to wheat dust, linear regression analysis indicated that there was a positive correlation between IL-8 production and endotoxin levels in the corn dust extract. Two-tailed ANOVA indicated that correlation was significant. As the endotoxin concentration present in the dust samples increased, the IL-8 levels also increased ().
FIG. 5 Linear regression analysis of IL-8 with LPS (endotoxin) content of the corn dust. As the LPS concentration increases in the dust samples, the IL-8 levels significantly increase also (R2 = 0.51, p < 0.0001). The LPS concentrations represent the amount of LPS in micrograms per 1 mg dust. The IL-8 levels reported in this graph were produced in response to exposure to 100 μg corn dust. Corn 3 dust LPS levels are indicated by the ⧫ symbol; Corn 2 dust LPS levels are indicated by the σ symbol; and Corn 1 dust LPS levels are indicated by the ◊ symbol.
Comparison of the Effect of Different Dust Types on IL-8 Production
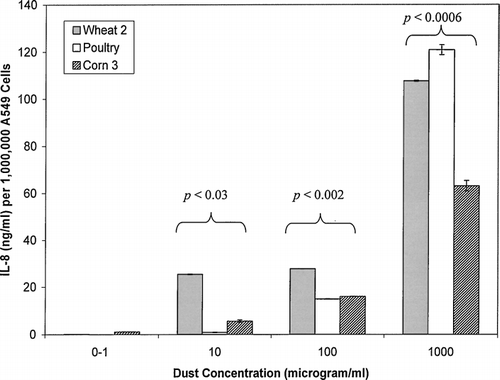
represents the IL-8 production by A549 cells after exposure to three different dust types. These particular dust samples were chosen for comparison because they were collected under the same weather conditions and in uniform geographical areas. All three dust types induced IL-8 levels that significantly increased with increasing dust concentration. The averaged dust samples followed this trend in each category as well. Two-tailed ANOVA indicated that there were significant differences in IL-8 production induced by different dust types at 10 (F(3,5) = 24.49, p = 0.002), 100 μg/ml (F(3,5) = 527.22, p = 0.001) and 1000 μg/ml (F(3,5) = 40.23, p = 0.0006) dust exposure levels compared to control as well.
FIG. 6 A comparison of IL-8 produced by A549 cells in response to exposure by representative dust wheat, poultry, and corn dust isolates. The data labels indicate significant differences of IL-8 levels produced by different dust types within concentration groups. There were no significant differences in IL-8 levels produced within the 0–1 exposure concentration. Each bar represents the mean of two experiments.
DISCUSSION
The current study found that poultry, corn, and wheat dusts were potent stimulators of cytokine production by A549 human respiratory epithelial cells. In particular, each of these dust types stimulated production of IL-8 in a dose-dependent manner similar to the production of IL-8 in response to LPS exposure. Wheat-dust and poultry-dust exposures each caused over a 100-fold increase in IL-8 production by A549 cells, while corn-dust-exposure resulted in IL-8 production that ranged from a 60- to 200-fold increase over baseline. Exposure of A549 cells to medium without dust did not produce any measurable levels of IL-8. Exposure of A549 cells to the same type of dust samples collected from different locations (i.e., Corn 1, Corn 2, and Corn 3) resulted in varying responses in IL-8 induction. This suggested that the dust samples contained different substances and amounts of substances that incited an inflammatory response. Previous studies have suggested that the immune response elicited after dust exposure is due primarily to endotoxin levels in the dust itself (Clapp et al., Citation1993; Schwartz et al., Citation1995; Jagielo et al., Citation1996). In the current study, IL-8 response after corn-dust exposure positively correlated overall with endotoxin content of the dust; however, Corn 1, which contained the highest level of endotoxin, caused the second highest levels of IL-8 at 1,000 μg/ml exposure concentration. In addition, IL-8 response after wheat dust exposure negatively correlated with endotoxin content. These two findings together suggest that, in contrast to some previous studies, dust components other than endotoxin are contributing to the immune response.
Previously published studies used a variety of methods for preparation of the dust extracts which make it difficult to compare results between research groups. The current study improved upon this by using a standard method of dust extract preparation for each experiment. This is the first study to compare the effect of corn, poultry, and wheat dusts on human respiratory epithelial cells in vitro using the same standard methods of dust exposure. In addition, these data demonstrate that the elicited immune response following dust exposure does not always directly correlate with endotoxin content of the dust.
It has been previously shown that high levels of dust exposure of a variety of dust types in vivo induced IL-8 production by endothelial cells, fibroblasts, macrophages, and monocytes and actively recruit neutrophils to the site of chronic pulmonary inflammation (Palmberg et al., Citation1998; Von Essen et al., Citation1988; Wang et al., Citation1998; Saraf et al., 1999). However, few studies have been conducted that assess the effect of corn, poultry, or wheat dusts on the {in vitro} IL-8 respiratory immune response using consistent methods of dust extract preparation and testing. Palmberg et al. (Citation1998) demonstrated that swine dust induced a 28-fold increase in IL-8 production while barley dust did not induce any detectable level of IL-8. This is in contrast to the current study that shows that grain dusts from corn and wheat do significantly induce an IL-8 response in A549 cells. This is an interesting finding since the Palmberg study did not include filtration of the dust extract prior to cell exposure like the current study did. Differences in IL-8 levels between the two studies may be due to either: 1) the dust type (coarse barley vs. corn and wheat); 2) the dust preparation method (unfiltered vs. filtered); or, 3) other differences in dust composition.
The current work supports a previous study of corn dust exposure by Clapp et al. (Citation1994) that demonstrated increases in IL-1, -6, and -8 in bronchioalveolar lavage fluid (BAL) after human exposure to corn dust. The Clapp study was similar to the current study in that it used filtered dust extracts for the exposure assays; however, the results of that study can only be indirectly compared as they involved in vivo versus in vitro assays. In addition, several other studies have reported increases in tumor necrosis factor alpha (TNFα), IL-1, and IL-2 after respiratory epithelial cell exposure to corn dust in vitro (Jagielo et al., Citation1996). Ting-Ting et al. (Citation1988), showed that wheat and corn dust both stimulated neutrophil chemotaxis that is also suggestive of immune response activation. They used wheat and corn dust extracts that had been filtered, lyophilized, and resuspended for in vitro assays with macrophages. Their study also demonstrated increases in IL-1 in response to wheat, corn, flaxseed, and oat. However, their results were expressed as the degree of stimulation of cultured thymocytes and not as directly measured IL-1; therefore, only general comparisons can be made here as well. The current study supports their finding and expands their study by identifying increases in cytokine levels (IL-8) after respiratory-epithelial-cell dust exposure, which is one of the mediators responsible for neutrophil chemotaxis. In addition, the current study supports a method by which individual dust types can be systematically compared for inflammatory potential and allows the prediction of which specific dust types may put workers more at risk for respiratory inflammation.
Several factors may contribute to the variability measured in IL-8 production both between and within dust types. Perhaps the most likely contributing factor is that although each dust type was collected under similar climate, temperature, and weather conditions, each was collected from a different location and contained different microorganisms and potentially different dust components. Second, the dust samples were filtered, allowing only very small particles to pass through. There may have been an uneven distribution of dust particles between wells or between dust concentrations. Third, differences in IL-8 induction due to different types of dust may have been due to varying antigen levels other than endotoxin. Corn dust exposure induced IL-8 that increased with increasing dust concentration and correlated with increasing amounts of endotoxin in the corn dust samples. However, IL-8 production in response to wheat dust was inversely related to LPS concentration suggesting that other factors besides endotoxin are present in the dust that are responsible for induction of IL-8 production.
This study is significant because it compared the in vitro effects of wheat, poultry, and corn dusts on the respiratory immune response using the same methods of dust extract preparation and exposure for each dust type. Previous studies have used a variety of methods which make it impossible to compare dust exposure results between laboratories. In addition, this study suggests that the inflammatory response to dust exposure is different between dust types and does not always correlate to endotoxin content of the dust. In particular, corn dust exposure produced the highest inflammatory response as indicated by IL-8 levels. Finally, this study proposes a systematic method by which environmental dust samples can be assayed for their potential in causing respiratory inflammation in humans.
ACKNOWLEDGMENTS
The authors would like to thank Dr. Ann Rushing and Dr. Kevin Gutzwiller for their careful reviews of the manuscript.
REFERENCES
- Clapp W. D., Thorne P. S., Frees K. L., Xiaouji Z., Lux C. R., Schwartz D. A. The effects of inhalation of grain dust extract and endotoxin on upper and lower airways. Chest 1993; 104: 825–830, [PUBMED], [INFOTRIEVE], [CSA]
- Clapp W. D., Becker S., Quay J., Watt J. L., Thorne P. S., Frees K. L., Zhang X., Koren H. S., Lux C. R., Schwartz D. A. Grain dust-induced airflow obstruction and inflammation of the lower respiratory tract. Am. J. Resp. Crit. Care Med. 1994; 150: 611–617, [PUBMED], [INFOTRIEVE], [CSA]
- Dunnett C. W. A multiple comparison procedure for comparing several treatments with a control. J. Am. Stat. Assoc. 1955; 50: 1096–1121, [CSA]
- Jagielo P., Throne P. S., Watt J. L., Frees K. L., Quinn T. J., Schwartz D. A. Grain dust and endotoxin inhalation challenge produce similar inflammatory responses in normal subjects. Chest 1996; 110: 263–270, [PUBMED], [INFOTRIEVE], [CSA]
- Janeway C. A., Travers P., Walport M., Capra J. D. Immunobiology: The Immune System in Health and Disease. Current Biology Publications, New York 1999
- Larsson K., Eklund A., Hansson L. O., Isaksson B. M., Malmberg P. Swine dust causes intense airways inflammation in healthy subjects. Am. J. Resp. Crit. Care Med. 1994; 150: 973–977, [PUBMED], [INFOTRIEVE], [CSA]
- Palmberg L., Larsson B. M., Malmberg P., Larsson K. Induction of IL-8 production in human alveolar macrophages and human bronchial epithelial cells in vitro by swine dust. Thorax 1998; 53: 260–264, [PUBMED], [INFOTRIEVE], [CSA]
- Saraf A., Larsson L., Larsson B. M., Larsson K., Palmberg L. House dust induces IL-6 and IL-8 in A549 epithelial cells. Indoor Air 1990; 9: 219–225, [CSA], [CROSSREF]
- Schwartz D. A., Thorne P. S., Yagla S. J. The role of endotoxin in grain-induced lung disease. Am. J. Resp. Crit. Care Med. 1995; 152: 603–608, [PUBMED], [INFOTRIEVE], [CSA]
- Shen Y. E., Sorenson W. G., Lewis D. M., Olenchock S. A. Microbial analysis and inflammatory effects of settled dust from rice and hay. Biomed. Environ. Sci. 1990; 3: 353–363, [PUBMED], [INFOTRIEVE], [CSA]
- Strieter R. M. Interleukin-8: A very important chemokine of the human airway epithelium. Am. J. Physiol. - Lung Cell Mol. Physiol. 2002; 283: L688–L689, [PUBMED], [INFOTRIEVE], [CSA]
- Ting-Ting Y., Lewis D. M., Sorenson W. G., Olenchock S. A. Inflammatory potential of grain dust. Biomed. Environ. Sci. 1988; 1: 115–124, [CSA]
- Von Essen S. G., Robbins R. A., Thompson A. B., Ertl R. F., Linder J., Rennard S. Mechanisms of neutrophil recruitment to the lung by grain dust exposure. Am. Rev. Resp. Dis. 1988; 138: 921–927, [PUBMED], [INFOTRIEVE], [CSA]
- Von Essen S. G., O'Neill D. P., Olenchok S. A., Robbins R. A., Rennard S. I. Grain dusts and grain plant components vary in their ability to recruit neutrophils. J. Toxicol. Environ. Health 1995; 46: 425–441, [PUBMED], [INFOTRIEVE], [CSA]
- Von Essen S. G., Frysek J., Nowakowski B., Wampler M. Respiratory symptoms and farming practices in farmers associated with an acute febrile illness after organic dust exposure. Chest 1999; 116: 1452–1458, [PUBMED], [INFOTRIEVE], [CSA], [CROSSREF]
- Wang Z., Larsson K., Palmberg L., Malmberg P., Larsson P., Larsson L. Inhalation of swine dust induces cytokine release in the upper and lower airways. Eur.Resp. J. 1997; 10: 381–387, [CSA], [CROSSREF]
- Wang Z., Malmberg P., Ek A., Larsson K., Palmberg L. Swine dust induces cytokine secretion from human epithelial cells and alveolar macrophages. Clin. Exp. Immunol. 1999; 115: 6–12, [PUBMED], [INFOTRIEVE], [CSA], [CROSSREF]
- Wang Z., Malmberg P., Larsson P., Larsson B. M., Larsson K. Time course of interleukin-6 and tumor necrosis factor-alpha increase in serum following inhalation of swine dust. Am. J. Resp. Crit. Care Med. 1996; 153: 147–152, [PUBMED], [INFOTRIEVE], [CSA]
- Wang Z., Manninen A., Malmberg P., Larsson K. Inhalation of swine-house dust increases the concentrations of interleukin-1 beta (IL-1β) and interleukin-1 receptor antagonist (IL-1RA) in peripheral blood. Resp. Med. 1998; 92: 1022–1027, [CSA], [CROSSREF]
