
Abstract
Vaccines are inoculated in healthy individuals from children to the elderly, and thus high levels of safety and consistency of vaccine quality in each lot must meet the required specifications by using preclinical and lot release testing. Because vaccines are inoculated into humans, recapitulation of biological reactions in humans should be considered for test methods. We have developed a new method to evaluate the safety of influenza vaccines using biomarker gene expression in mouse and rat models. Some biomarker genes are already known to be expressed in human lymphocytes, macrophages and dendritic cells; therefore, we considered some of these genes might be common biomarkers for human and mice to evaluate influenza vaccine safety. In this study, we used human peripheral blood mononuclear cells (PBMC) as a primary assessment tool to confirm the usefulness of potential marker genes in humans. Analysis of marker gene expression in PBMC revealed biomarker gene expressions were dose-relatedly increased in toxic reference influenza vaccine (RE)-stimulated PBMC. Although some marker genes showed increased expression in hemagglutinin split vaccine-stimulated PBMC, their expression levels were lower than that of RE in PBMC from two different donors. Many marker gene expressions correlated with chemokine production. Marker genes such as IRF7 were associated with other Type 1 interferon (IFN)-associated signals and were highly expressed in the CD304+ plasmacytoid dendritic cell (pDC) population. These results suggest PBMC and their marker genes may be useful for vaccine safety evaluation in humans.
Introduction
Because vaccines that are inoculated into healthy individuals ranging in age from children to the elderly have an inherent potential for variability, a high safety profile, and lot-to-lot quality consistency are essential. Animal testing is used for preclinical studies and post-licensure lot release tests; however, they might not be predictive of what will ultimately occur in humans. Further, there are requirements to reduce numbers of animals used in testing. Thus, alternative 3R-based/human adaptive methods need to be established for the evaluation of vaccine safety.
Our laboratory has developed a novel method to evaluate influenza vaccine safety and quality using biomarkers (NIID Citation2006). As whole-virion influenza vaccine (WPv) caused many side effects in the 1970s in Japan, WPv is used as an influenza vaccine toxicity reference for animal testing in Japan (Mizukami et al. Citation2008). Using WPv, 18 biomarkers highly induced in WPv-treated rat lungs were identified that could distinguish WPV from hemagglutinin split vaccine (HAv). Using these biomarkers, a novel safety assessment method was developed that could replace conventional animal safety testing methods (Mizukami et al. Citation2008, Citation2014; Momose et al. Citation2015). Expressions of these marker genes highly correlated with peripheral blood toxicity (leukopenic toxicity) and weight loss in test animals, due to WPv. Those studies also showed the genes could be used to evaluate safety of influenza vaccine by conventional intraperitoneal inoculation and intranasal routes. More recently, the synergistic effect of adjuvant and influenza vaccine was measured by biomarker expression (Sasaki et al. Citation2017). When taken together, these data suggested the 18 genes could be widely used in safety assessment of vaccines/adjuvants and might help in any extrapolation of findings from animals to humans (if recapitulated in humans after vaccination).
Human peripheral blood mononuclear cells (PBMC) are present in human blood and comparatively easy to obtain, thereby reducing the burden on donors. PMBC have been used in biological studies and biomarker exploration studies (Komatsu et al. Citation2012; Ishimura et al. Citation2013; Sambor et al. Citation2014; Tan et al. Citation2014). Generally, PBMC contains various principal immune cells, and even under in vitro culture conditions, these cells undergo immune reactions similar to in vivo situations (Reimann et al. Citation2000; Weinberg et al. Citation2006; Haudek-Prinz et al. Citation2012). Based on these properties, PBMC were chosen here for use in extrapolating the identified 18 marker genes to humans to develop a novel in vitro vaccine safety evaluation system using human samples. An advantage in using PBMC for these types of analyses is that they provide a mechanism for direct safety assessment for humans as compared with analyses that have to be extrapolated from animal models. In additions, with PMBC, vaccine safety can be determined for individual human immune responses by simply comparing individual donor-derived PBMC.
Though these marker genes were identified from within whole lung tissues, they might nonetheless be involved in immune responses. For example, IRF7, CXCL9, and CXCL11 are related to plasmacytoid dendritic cell (pDC)-mediated reactions (Pablos et al. Citation1999; Birmachu et al. Citation2007), and IFI47 (Wei et al. Citation2006; Pfeffer Citation2011) and ZBP1 (Takaoka et al. Citation2007; Upton et al. Citation2012) are related to Type 1 IFN-related signaling. In addition, TAP2 and PSMB9 are involved in antigen digestion and presentation (Ferrington and Gregerson Citation2012). As such, the 18 marker genes identified in lungs are likely also expressed in monocytes, DC, and lymphocytes.
Development of side-effects caused by vaccination has not been observed in all inoculated subjects, only in a limited number of subjects (Margolis, Nichol, et al. Citation1990; Margolis, Poland, et al. Citation1990; Nichol et al. Citation1996) suggesting that evaluating the susceptibility to develop side-reactions against vaccination in individuals before vaccination is important to avoid unexpected side-effects. To date, reports on safety evaluation of vaccines using biomarkers and PBMC have been limited. Accordingly, the study reported here established an in vitro assay for influenza vaccine safety assessment by analyzing lymphocyte subset changes by FACS and the expression pattern of 17 marker genes using several donor-derived human PBMC cultures. The data suggested to us that the marker gene expressions here might be useful for extrapolating animal data to humans in order to establish a human PBMC-based in vitro safety evaluation system for influenza vaccine.
Materials and methods
Subjects and protocol for in vitro treatments
PBMC obtained from healthy adult subjects were purchased from AllCells (Alameda, CA) and cultured in complete RPMI, i.e. RPMI 1640 supplemented with 10% fetal calf serum (FCS), 100 U penicillin/ml and 100 μg streptomycin/ml (Sigma, St. Louis, MO). Human PBMC from one healthy donor (24-year-old male Caucasian) were used for the experiment shown in . PBMC from another healthy donor (32-year-old female Caucasian) were used for the biomarker gene expression analyses (shown in Supplemental Figure 2). Here, HAv and national reference influenza vaccine (RE, composed of whole-virion inactivated influenza vaccine) were used as model vaccines. HAv containing A/California/7/2009 (H1N1), A/New York/39/2012 (H3N2), and B/Massachusetts/2/2012 strains were bought from Chemo-Sero-Therapeutic Research Institute, Kaketsuken (Kumamoto, Japan). RE is lyophilized whole-virion preparation of an inactivated influenza virus consisting of three different types of inactivated whole-virion, e.g. A/New Caledonia/20/99 (H1N1), A/Hiro-shima/52/2005 (H3N2), and B/Malaysia/2506/2004 and is the toxicity reference issued by NIID (Japan) (NIID Citation2006). RE was re-constituted in an appropriate volume of saline (SA). For both HAv and RE, serial dilutions using complete RPMI were done to prepare each to appropriate concentrations for use in the studies below.
Figure 1. Characterizing lymphocyte, monocyte, and DC frequencies in PBMC and assessment of cell viabilities after influenza vaccine stimulations. (A) Representative gating strategy and dot-plots of DC (Lineage−, HLA-DR+), B-cells (CD19+), CD4+ T-cells, CD8+ T-cells, NK cells (CD3−, CD56+), and monocytes (CD14+). (B) Frequency of each cell type. (C) Cell viabilities of vaccine stimulated PBMC assessed by PI staining. Sixteen hours after vaccine stimulation, PBMC were stained with PI and the frequencies of PI-negative cells were assessed using flow cytometry. Experiments were conducted in triplicate. Data shown are means (SD) **p < 0.01 and ***p < 0.001 vs. SA-treated group.
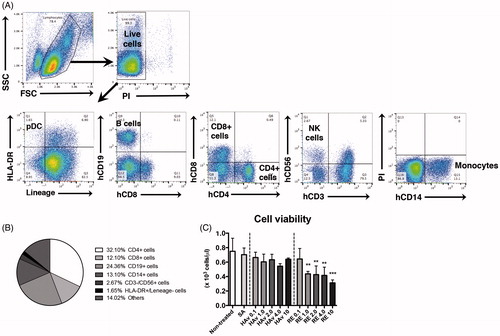
Figure 2. Marker gene expression analyses in PBMC after influenza vaccine stimulations. PBMC were stimulated with toxicity reference vaccine (RE), hemagglutinin split vaccine (HAv) or saline (SA) for 16 h, and then collected and used for QGP assay. Experiments were conducted in triplicate. Data shown are means ± SD. Data represent expression levels relative to HRRT-1. *p < 0.01, **p < 0.01, and ***p < 0.001 vs. SA-treated group.
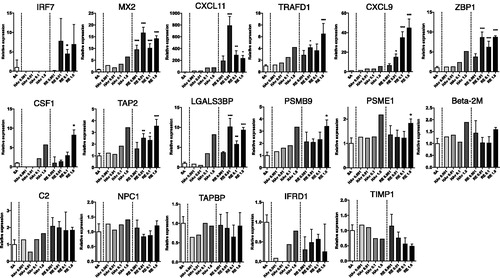
Figure 3. Cytokine profile for PBMC after influenza vaccine stimulation. PBMC were stimulated with RE HAv, or SA for 16 h, and then culture medium was collected and analyzed using a Human Cytokine Magnetic 30-plex Panel. Experiments were conducted in triplicate. Data shown are means ± SD. *p < 0.01, **p < 0.01, and ***p < 0.001 vs. SA-treated group.
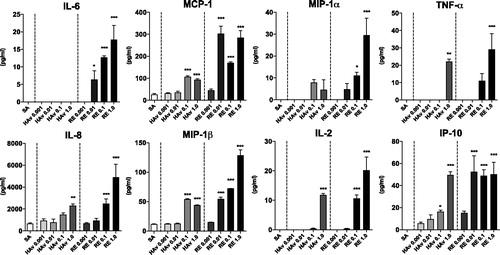
Figure 4. Marker gene expression analyses in Lineage−, HLA-DR+ cells, and other cells. PBMC were stimulated with RE or SA for 16 h and then sorted into lineage−, HLA-DR+ cells and other cells via FACS. Marker gene expression levels were assessed in both fractions by QGP assay. Experiments were conducted in duplicate. Data shown are means.
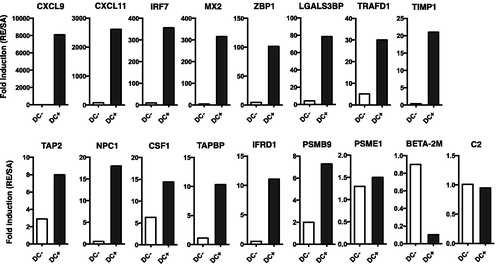
Figure 5. Effects of CD304+ cell enrichment on marker gene expression in PBMC. CD304+ cells were enriched using a magnetic-activated cell sorting (MACS) system. The frequency of CD304+ pDC was analyzed in MACS+ selected, negative selected, and non-MACS-treated cells. (A) Gating strategy for pDC in non-enriched PBMC [indicated as dot-plots]. MACS-treated cells are represented by (B) dot-plots and (C) frequencies. MACS+ selected, negative selected, and non-MACS-treated cells were stimulated with RE, HAv, or SA for 16 h, then collected and used for QGP assay to assess marker gene expression (D). QGP assays were conducted in triplicate. Data shown are means ± SD. *p < 0.01, **p < 0.01, and ***p < 0.001 vs. RE-stimulated whole PBMC group. Data represent expression levels relative to HRRT-1.
![Figure 5. Effects of CD304+ cell enrichment on marker gene expression in PBMC. CD304+ cells were enriched using a magnetic-activated cell sorting (MACS) system. The frequency of CD304+ pDC was analyzed in MACS+ selected, negative selected, and non-MACS-treated cells. (A) Gating strategy for pDC in non-enriched PBMC [indicated as dot-plots]. MACS-treated cells are represented by (B) dot-plots and (C) frequencies. MACS+ selected, negative selected, and non-MACS-treated cells were stimulated with RE, HAv, or SA for 16 h, then collected and used for QGP assay to assess marker gene expression (D). QGP assays were conducted in triplicate. Data shown are means ± SD. *p < 0.01, **p < 0.01, and ***p < 0.001 vs. RE-stimulated whole PBMC group. Data represent expression levels relative to HRRT-1.](/cms/asset/eadc7629-75b7-4eeb-953f-3855842039fa/iimt_a_1447052_f0005_c.jpg)
Both inactivated influenza vaccines (RE and HAv) were prepared at 0.001, 0.01, 0.1, 1.0, 2.0, and 4.0 µg protein/ml. PBMC in complete RPMI were seeded at a density of 5 × 10⁵ cells/well in 24-well plates (Falcon, Becton Dickinson, Franklin Lakes, NJ) and then cultured at 37 °C, 5% CO2 with or without each influenza vaccine at an appropriate concentration. After 16 h of vaccine stimulation, the PBMC and their culture supernatants were collected for analysis of marker gene expression and cytokine production. In pilot experiments, the optimal stimulatory vaccine dose for PBMC was determined for all vaccine types by measuring IL-2 levels in conditioned supernatants (data not shown).
All research protocols were approved by the Institutional Review Boards of the National Institute of Infectious Diseases (Tokyo, Japan) before the start of the study.
QuantiGene Plex analyses
A customized QGP version 2.0 assay (Affymetrix Inc., Fremont, CA) was designed in our laboratory to measure expression of human marker genes corresponding to previously-established rat genes (Mizukami et al. Citation2014; Momose et al. Citation2015) (). Genes that were not appropriate homologs to human genes or for which appropriate probes for QGP assay could not be designed were excluded. Overall, 17 marker genes were evaluated. PBMC lysate preparation was done using a QuantiGene Plex Assay Kit (Affymetrix, Santa Clara, CA) in accordance with manufacturer instructions, and then a QuantiGene Plex (QGP) assay was performed as described in Mizukami et al. (Citation2014) and Momose et al. (Citation2015). Gene expression was assessed by the QGP assay with luminescence, which was measured with a Bio-Plex 200 System (Bio-Rad, Hercules, CA). Expression levels of marker genes and hypoxanthine HPRT-1 were simultaneously quantified and the ratio of each marker gene expression to that of HPRT-1 calculated.
Table 1. Marker gene internal standard genes for the safety evaluation of influenza vaccines.
Flow cytometry and cell sorting
Total viability and percentages of PBMC after 16 h of vaccine stimulation were determined using a propidium iodide (PI) exclusion assay (flow cytometry). To determine cytotoxic effects of the tested vaccines, 5 × 10⁵ PBMC were treated with HAv or RE as above, then washed with phosphate-buffered saline (PBS, pH 7.4) supplemented with 5% FCS (FACS medium) and re-suspended in 0.5 ml FACS medium containing 1 μg PI/ml (BD PharMingen, San Diego, CA). A Japan-made Sorter Analyzer (JSAN, BayBioscences, Kobe, Japan) flow cytometer was used for all analyses. Size and granularity parameters were evaluated with 488-nm detectors (blue) based, respectively, on forward- and side-scattered light. For PI-treated cells, 20 000 events were acquired in the lymphocyte gate based on size vs. granularity (FSC × SSC) dot-plots. PI fluorescence was evaluated for each histogram. Unstained cells were used to determine the percentage of live cells.
Changes in PBMC cell subset levels after vaccine stimulation were also assessed using flow cytometry. The basic analytical conditions of these analyses were the same as the cell viability assay (above.) In brief, 16 h after vaccine stimulation, PBMC were suspended in 0.5 ml of FACS medium and washed twice with FACS medium. Cells were suspended in 100 µl FACS medium and an appropriate volume of fluorescence-conjugated antibody was then added. Stained cells were then analyzed by JSAN flow cytometer. A total of ≈200 000 events was collected and data were analyzed using FlowJo software (TreeStar, San Carlos, CA).
Conjugated antibodies used for flow cytometry analyses were: For DC gate (Wollenberg et al. Citation2002), a phycoerythrin (PE)-conjugated lineage cocktail containing anti-human CD3 (HIT3a), CD14 (61D3), CD16 (CB16), CD19 (HIB19), CD20 (2H7), and CD56 (CMSSB) and anti-human HLA-DR (LN3)-fluorescein isothiocyanate (FITC) (all eBioscience, San Diego, CA). For other cells, anti-human CD19 (HIB19)-PE, CD8a (OKT8)-allophycocyanin (APC), CD56 (CMSSB)-PE, CD3 (HIT3a)-FITC, and CD14 (61D3)-APC antibodies were used (eBioscience, San Diego, CA). Anti-human CD4 (OKT4)-FITC was from BioLegend (San Diego, CA).
To sort the DC-enriched fraction, cells were stained with the conjugated reagents for DC as above. The cells were then purified into DC+ (lineage negative and HLA-DR+ cells) and other fractions using the JSAN flow cytometer. A total of ≈15,000 cells was collected in each fraction and the sorted cells used for the QGP analyses to assess marker gene expression levels.
pDC enrichment
To prepare pDC-enriched PBMC, cells stained with biotinylated anti-human CD304-biotin antibodies (Miltenyi Biotec, Auburn, CA) were collected by magnetic-activated cell sorting (MACS) (using Miltenyi Anti-Biotin MicroBeads) according to manufacturer protocols. The aliquot of sorted cells was then stained with conjugated reagents to determine pDC enrichment in the PBMC. The fluorescence-conjugated antibodies used for flow cytometry were: Anti-human CD3 (HIT3a)-PE, CD8a (OKT8)-PE, CD20 (2H7)-PE, HLA-DR (LN3)-FITC, and CD11c (3.9)-APC-eFluor780 (all eBioscience, San Diego, CA, USA). Anti-human CD14 (61D3)-Pacific blue was from BioLegend and anti-human CD123 (7G3)-APC from BD Pharmingen. All stained cells were then analyzed using a CytoFLEX Flow Cytometer (Beckman Coulter, La Brea, CA). A total of ≈300 000 events was collected and all data were analyzed using FlowJo software (TreeStar, San Carlos, CA, USA). The remaining sorted cells were seeded at a density of 5 × 10⁵ cells/well in 24-well plates, and treated with 0.1 μg/ml HAv or RE protein for 16 h. After stimulation, cells were collected for QGP analyses.
Cytokine assay
Culture supernatants collected at 16 h after vaccine stimulation were subjected to analysis using a Human Cytokine Magnetic 30-plex Panel (Life Technologies, Frederick, MD) according to manufacturer’s instructions. The panel evaluated epidermal growth factor (EGF), eotaxin, fibroblast growth factor (FGF)-basic, granulocyte-colony stimulating factor (G-CSF), granulocyte-macrophage colony stimulating factor (GM-CSF), hepatocyte growth factor (HGF), interferon (IFN)-α, IFNγ, interleukins (IL)-1ra, -1β, -2, -2r, -4, -5, -6, -7, -8, -10, -12(p40/p70), -13, -15, and -17, IFNγ-induced protein (IP)-10, monocyte chemotactic protein (MCP)-1, monokine induced by IFNγ (MIG), macrophage inflammatory protein (MIP)-1α/β, RANTES (regulated on activation, normal T-cell expressed and secreted), tumor necrosis factor (TNF)-α, and vascular endothelial growth factor (VEGF). All samples were evaluated in duplicate.
Statistical analysis
Data are reported as means ± SD. Statistical analyses were performed using Prism version 6 Software (GraphPad, La Jolla, CA). For multiple comparisons, a one-way analysis of variance (ANOVA) followed by a Dunnett’s multiple comparison test was performed. For the comparison of two groups, an unpaired Student’s t-test was performed. A p-value ≤ 0.05 was considered statistically significant.
Results
Characterization of lymphocyte, monocyte, and dendritic cell populations in PBMC and optimization of vaccine concentration for evaluation
Before using PBMC, compositions of lymphocytes (T-, B-, and NK cells), monocytes, and dendritic cells (DC) were analyzed by FACS. The cell distribution among the PMBC was found to be 71% lymphocytes (CD4+ T-cells: 32%, CD8+ T-cells: 12%, CD19+ B-cells: 24%, and CD3−/CD56+ NK cells: 3%), 13% monocytes (CD14+ cells) and 2% DC (Lineage-/HLA-DR+ cells) (), an outcome in accordance with reported normal PBMC phenotypes (Autissier et al. Citation2010).
To determine the optimal concentration of influenza vaccines for stimulation in the in vitro assays, cell viabilities were assessed 16 h after vaccine treatment in which WPV induced biomarker gene expression in vivo (Mizukami et al. Citation2008). Vaccine concentrations were based on 1 µg/ml according to a previous study (Saurwein-Teissl et al. Citation1998) that monitored DC stimulation and IL-2 production induced by HAv and WPv. More than half of the PBMC died at a level of RE ≥ 1.0 µg/ml (). The HAv-induced cell death was concentration-related, but viability was not < 50% with any concentration. Further, when PBMC were stimulated with RE or HAv at ≤ 1.0 μg/ml (protein level), no stimulation-induced changes in cell populations were observed (Supplemental Figure 1(A–C)). Based on these findings, in vitro safety evaluation assays thereafter were conducted at ≤ 1.0 µg/ml vaccine protein.
Marker gene expression in response to different types of influenza vaccines
A customized QGP version 2.0 (Affymetrix Inc., Fremont, CA) assay was used to measure expression of human marker genes corresponding to already-established rat genes (Mizukami et al. Citation2014; Momose et al. Citation2015) (). As Ifi47 could not be designed as there is no human homolog, only 17 genes were evaluated. To assess utility of the genes in a PBMC in vitro assay, marker expression analyses were conducted after 16 h of stimulation with various doses (all ≤1.0 µg/ml) of the influenza vaccines. Among the 17 genes, RE at all doses ≥0.001 µg/ml led to significant increases (compared to SA-induced levels) in MX2 expression, but the effects were not dose-related (). In contrast, RE caused dose-trend increases in expression levels for CXCL9 and CSF1, and a dose-related decrease in TIMP1. With CXCL9, the effect was significant at all doses ≥0.01 µg/ml, and with CSF1, at 1.0 µg/ml. For TIMP1, IFRD1, TAPBP, and NPC1, treatment with RE in almost all cases caused reductions (albeit not to significant levels) in expression relative to SA-treated cell levels. Among the other genes evaluated, levels of IRF7, CXCL11, TRAFD1, ZBP1, TAP2, and LGALS3BP were all uniformly significantly increased relative to control values, but the effects were not dose-related. For PSMB9, only the dose of 1.0 µg RE/ml yielded a significant increase in expression. Neither C2 nor Beta-2 M expression levels were significantly impacted by any dose of the RE.
Similar effects were noted with HAv-treated samples, but levels of induction were more often lower than those due to RE (see comparative increments for MX2, CXCL11, or TRAFD1). In other cases, relative to control, HAv induced no significant effects on IRF7, CXCL9, C2, or NPC1 expression, only induced any change at doses ≥ 0.1 µg/ml (e.g. TAP2, CSF1, LGALS3BP, ZBP1, and TRAFD1) or only at 1 µg/ml (Beta-2 M and PSME1), or led to decreased expression in general (e.g. TIMP1, IFRD1, and TAPBP). Similar results with both HAv and RE were obtained for CXCL11, CXCL9, IRF7, MX2, TIMP1, TAP2, and Beta2M with a second donor-derived PBMC sample (Supplemental Figure 2). These results indicated that five of 17 marker genes were potential universal biomarkers for use in influenza vaccine safety evaluation.
Cytokine production by vaccine stimulation
To assess if the biomarker gene expression reflected/correlated with the immunization response, concentrations of pro-inflammatory cyto-/chemokines in culture media at 16 h vaccine stimulation were measured. In almost every case where the dose was ≥ 0.01 μg/ml, RE led to significant increases in IL-6, MCP-1, MIP-1α/β, TNFα, IL-8, IL-2, and IP-10 levels in the PBMC (). In comparison, doses of ≥ 0.01 μg HAv/ml only caused significant increases in MCP-1, MIP-1β, IL-8, and IP-10. A dose of 1.0 µg/ml was needed to induce significant increases in release of TNFα and IL-2 by the HAv-treated cells. Of note, only in two instances did the dose of 1.0 µg/ml of each stimulant cause a similar level of cytokine (i.e. TNFα and IP-10) to be released. These results indicated the newly-developed PBMC assay might reflect actual immune responses that occur in human peripheral blood in vivo.
Marker gene expression profiles in DC and other cells in response to RE
As DC has a critical role in initial immune responses induced by vaccines/adjuvants, DC in PBMC were evaluated for marker gene expression. Saline (SA)- or RE-stimulated PBMC were collected and purified into lineage (CD3, CD14, CD16, CD19, CD20, and CD56)-/HLA-DR+ cells and other subsets using FACS; 85% purity was obtained for each fraction (Supplemental Figure 3). The cells were used for QGP analyses to assess marker gene expression, and results are shown as fold-induction by RE-stimulation compared to levels from SA treatment (RE/SA) (). Marker gene expressions, except for PSME1, Beta-2 M, and C2, were almost uniformly increased in the lineage− and HLA-DR+ DC subsets, with this outcome substantially more among HLA-DR+ cells. This suggested that most of the selected marker genes in PBMC could be reflected in gene expression patterns among DC subtypes. Data for HAv-treated cells is not shown.
Change in marker gene expression in pDC-enriched PBMC
pDC (Type 1 IFN-secreting cell) rapidly respond to virus infection and/or vaccination (Piqueras et al. Citation2006; Wolf et al., Citation2009; Koyama et al. Citation2010), infection-induced inflammation (Dinarello et al. Citation1984; Takagi et al. Citation2011; Davidson et al. Citation2014) and vaccination-induced leukopenic toxicity (Ato et al. Citation2013). Thus, pDC are key for initial immunity against vaccines and immunotoxicity. pDC were enriched among PBMC here using anti-CD304 and a MACS system (Marshall et al. Citation2007; Hilbert et al. Citation2013). Here, a ≈17-fold enrichment in pDC was observed in CD304+ MACS-enriched PBMC compared with among non-enriched PBMC (). In the MACS− fraction, the frequency of pDC in total PMBC was decreased to less than 1/10 compared with among non-enriched PBMC (). Marker gene expression levels are shown in . Expression of Type 1 IFN-regulated or -inducible genes, i.e. CXCL9, CXCL11, and ZBP1, was increased in the pDC-enriched fraction and reduced in the pDC-reduced fraction (CD304− MACS fraction) compared to among non-enriched PBMC. Expression levels of all genes were not reduced in the pDC-depleted fraction compared with the bulk PBMC (except for NPC1 and Beta-2 M: ), suggesting marker gene expressions were not limited in pDC. However, sensitivity of expression against vaccine stimulations was higher in the pDC-enriched PBMC than in the bulk PBMC (). This suggested pDC might be useful in marker gene-based in vitro influenza vaccine safety evaluation.
Discussion
In this study, the extrapolation potential of 17 marker genes in an in vitro culture system using human PBMC were examined. More than half of the marker genes showed an increase in expression in response to RE stimulation, indicating that marker gene expression levels might be used to indicate immunotoxic potentials of influenza vaccines, and could be expected to predict biomarkers for influenza vaccine-induced side effects in humans. As such, PBMC should be considered a useful tool for the in vitro evaluation system using the previously identified 17 marker genes, which can also be applied to animal tests (Mizukami et al. Citation2008, Citation2014; Momose et al. Citation2015; Sasaki et al. Citation2017).
Among the 17 genes, some showed increases in response to RE and HAv stimulation, including many that are involved in antigen processing (Ferrington and Gregerson Citation2012). Here, vaccine concentrations were set equally for HAv and RE such that the genes might simply reflect antigen digestion processes. Tissue inhibitor of metalloproteinase-1 (TIMP1) (coding for TIMP1) only showed vaccine dose-related decreases in expression. In contrast to the other gene products, TIMP1 plays a pivotal role in matrix remodeling during tissue injury and repair rather than innate immunological responses (Gomez et al. Citation1997). Thus, we speculate that TIMP1 functions in tissue repair responses against vaccine-induced tissue damage. However, as in vitro conditions cannot accurately reproduce in vivo/in situ tissue or organ conditions, it remains uncertain if changes in TIMP1 expression can be truly reflected among isolated circulating PBMC.
Other marker genes in the set are presumed to be useful when levels of their expression might be used as tools to reflect potential expected effects induced in situ by a test vaccine. For example, several of the marker genes evaluated contained Type 1 IFN-inducible/-induced genes, i.e. IRF7, ZBP-1, CXCL9, and CXCL11. As such, the present results could suggest marker gene expression levels reflect likely Type 1 IFN-induced (inflammatory) reactions since that cytokine normally contributes to normal, i.e. inflammatory responses during acute influenza pneumonitis occur mainly via enhanced Type 1 IFN production (Davidson et al. Citation2014) and untoward immune-based outcomes, i.e. reductions in leukocyte levels or fever-like reactions and cytokine storm (Quesada et al. Citation1986) possibly caused by aberrant Type 1 IFN production (Ato et al. Citation2013). While these (and other) genes were being differentially-induced/-expressed in the PBMC, it remains to be determined if similar changes are occurring in situ after an actual vaccination.
Generally, it is difficult to classify vaccine-induced immune responses as a toxicity- and efficacy-related factor. For example, many cytokines, such as Type 1 IFNs, are involved in inflammation (Bucasas et al. Citation2011); however, they also play important roles in the induction of humoral and cellular immunities to elicit the effectiveness of vaccines (Pang and Iwasaki Citation2011; Ato et al. Citation2013). We believe that the biomarker genes used in this evaluation system would reflect both toxicity and effectiveness of influenza vaccines. RE (composed from WPv) was used as a toxicity control in the proposed evaluation system and has the potential to elicit both toxicity and high effectiveness in humans (al-Mazrou et al. Citation1991). In case the biomarker gene expression levels of a tested vaccine exceed those of RE, it can be considered that the tested vaccine has the potential to be more effective and toxic than RE. Thus, one example of the criteria for determining the safety of influenza vaccines is that when the biomarker gene expression levels of the tested vaccine exceeded those of RE, the tested vaccine is judged unsafe. This is because it can be predicted that the risk of toxicity development in case of the tested vaccine is higher than that in case of RE. One reason for this is that WPv (used as RE) was associated with a high frequency of side-reactions (i.e. pain, fever, and swelling) in humans (al-Mazrou et al. Citation1991). Thus, it can be considered that vaccines with a reactogenicity exceeding that of RE are not safe, despite being highly effective.
As shown in and , HAv and WPv are similar in responsiveness in the expression pattern of some biomarker genes (e.g. TRAFD1 and CSF1), and the production of some cytokines (e.g. IL-8 and IL-2) patterns. As HAv is a split vaccine, by increasing its concentration, the biological effects of contaminants, i.e. contents other than HA antigen, like lipids and single-strand RNAs from virus particles, will increase (Pickering et al. Citation1992). Unlike recombinant vaccines, split vaccines are produced by purifying whole inactivated viral particles, and therefore, bioactive substances (e.g. single-stranded RNA) may cause contamination. In addition, these contaminants are included in WPv (RE) as major components. From this, it can be considered that if the concentration of HAv is increased, the gene expression levels will be close to that of WPv.
According to a study in a rat model (Mizukami et al. Citation2008; Momose et al. Citation2015), the biomarker genes showed high responsiveness 16–24 h after vaccinations. In PBMC experiments, the difference in kinetics of biomarker gene expression levels has not been verified and as such remains unknown. However, in animal experiments, no increase in the expression levels of biomarker genes has been observed in HAv and WPv (RE) 2, 3, and 7 d after vaccination (Mizukami et al. Citation2008). From this, we believe that HAv is less likely to promote an increase in the biomarker gene expression levels after a few days, than WPv. Therefore, we think that the difference in kinetics between HAv and WPv has not been linked to the difference in their expression levels of biomarker genes in PBMC.
It is interesting to note the relationship between induced changes in expression of Type 1 IFN-related genes and in subtypes of the PBMC. Type 1 IFN, mainly produced and secreted by pDC, is produced by activation of downstream signals from TLR7 or TLR9 (Gibson et al. Citation2002). Analyses of PBMC here post-stimulation revealed the frequency of DC among the total pool of PBMC had a tendency to increase, especially with RE. From this, we speculate that increased expression of some marker genes (including IFN-related ones) might reflect pDC-mediated reactions. The hypothesis is supported by the differing levels of enhanced gene expression (by RE) within the differing DC fraction. Even so, because only ≈2–5% of DC were present in the PBMC here, actual gene expression fluctuations in DC might be masked by other cell populations present in the parent cell population. Fortunately, expression of many genes was seen to still be elevated as a result of RE stimulation among PBMC that were “pDC-reduced”. This indicated to us that most of the marker genes were also expressed in circulating cell types other than pDC. This was clearly shown in the studies here wherein the expression of almost all the marker genes were markedly reduced – but not eliminated – in PMBC that had their pDC-removed compared with pDC-enriched-PBMC indicating pDC.
Lastly, one final point about the utility of this novel approach needs to be commented upon. As an important demonstration of assay reproducibility, it was observed that alterations in expression of marker genes caused by the test vaccines were also reproduced in PBMC from a second donor (Supplemental Figure 2). Thus, the changes in expression (up or downward) of the marker genes might be a universal phenomenon across human PBMC. Clearly, however, as this studies were performed with only two donors, further analyses of PBMC from larger donor pools are required to increase the reliability of the findings. Among those who should have their PBMC examined for marker gene expressions are donor populations wherein there might potentially be side-effects from any actual vaccination, such as children and the elderly (Giefing-Kröll et al. Citation2015) as any part of a “vaccine safety evaluation system reflecting human reactions”.
Conclusions
This study demonstrated a novel in vitro vaccine safety evaluation system using human PBMC. The results showed that changes in expression levels of six genes (e.g. IRF7, MX2, CXCL11, TRAFD1, CXCL9, and ZBP1) were useful markers of influenza vaccine-induced reactogenicity in these cells. Further, the results here suggested to us that pDC were a key factor for reactogenicity and useful in evaluating elevation of marker gene expression. The present method could be expected to detect toxic potentials of vaccines in humans as well as individual differences in susceptibility to immunotoxic side-effects of influenza vaccines. On the other hand, we think there are many issues about test systems still to be considered, including interpretation of responsive biomarker gene patterns, differences in donor responsiveness, and relationships with cytokine secretion. Further analyses will help us to continue to promote this research toward commercialization.
Takuo_Mizukami_et_al_supplemental_content.zip
Download Zip (411.9 KB)Acknowledgments
The authors would like to thank Dr. Keigo Shibayama and Dr. Kazunari Kamachi (Department of Bacteriology II, National Institute of Infectious Diseases) for the gift of the RE vaccine.
Disclosure statement
The authors declare no conflicts of interest. The authors alone are responsible for the content of this manuscript.
Additional information
Funding
Related Research Data
References
- al-Mazrou A, Scheifele D, Soong T, Bjornson G. 1991. Comparison of adverse reactions to whole-virion and split-Virion influenza vaccines in hospital personnel. CMAJ. 145:213–218.
- Ato M, Takahashi Y, Fujii H, Hashimoto S, Kaji T, Itamura S, Horiuchi Y, Arakawa Y, Tashiro M, Takemori T. 2013. Influenza a whole virion vaccine induces a rapid reduction of peripheral blood leukocytes via interferon-α-dependent apoptosis. Vaccine. 31:2184–2190.
- Autissier P, Soulas C, Burdo T, Williams K. 2010. Evaluation of a 12-color flow cytometry panel to study lymphocyte, monocyte, and dendritic cell subsets in humans. Cytometry A. 77:410–419.
- Birmachu W, Gleason R, Bulbulian B, Riter C, Vasilakos J, Lipson K, Nikolsky Y. 2007. Transcriptional networks in plasmacytoid dendritic cells stimulated with synthetic TLR 7 agonists. BMC Immunol. 8:26.
- Bucasas K, Franco L, Shaw C, Bray M, Wells J, Niño D, Arden N, Quarles J, Couch R, Belmont J. 2011. Early patterns of gene expression correlate with the humoral immune response to influenza vaccination in humans. J Infect Dis. 203:921–929.
- Davidson S, Crotta S, McCabe T, Wack A. 2014. Pathogenic potential of IFN-αβ in acute influenza infection. Nat Commun. 5:3864.
- Dinarello C, Bernheim H, Duff G, Le H, Nagabhushan T, Hamilton N, Coceani F. 1984. Mechanisms of fever induced by recombinant human interferon. J Clin Invest. 74:906–913.
- Ferrington D, Gregerson D. 2012. Immunoproteasomes: Structure, function, and antigen presentation. Prog Mol Biol Transl Sci. 109:75–112.
- Gibson S, Lindh J, Riter T, Gleason R, Rogers L, Fuller A, Oesterich J, Gorden K, Qiu X, McKane S, et al. 2002. Plasmacytoid dendritic cells produce cytokines and mature in response to the TLR7 agonists, imiquimod and resiquimod. Cell Immunol. 218:74–86.
- Giefing-Kröll C, Berger P, Lepperdinger G, Grubeck-Loebenstein B. 2015. How sex and age affect immune responses, susceptibility to infections, and response to vaccination. Aging Cell. 14:309–321.
- Gomez D, Alonso D, Yoshiji H, Thorgeirsson U. 1997. Tissue inhibitors of metalloproteinases: Structure, regulation and biological functions. Eur J Cell Biol. 74:111–122.
- Haudek-Prinz V, Klepeisz P, Slany A, Griss J, Meshcheryakova A, Paulitschke V, Mitulovic G, Stöckl J, Gerner C. 2012. Proteome signatures of inflammatory activated primary human peripheral blood mononuclear cells. J Proteomics. 76:150–162.
- Hilbert T, Bongartz J, Weisheit C, Knüfermann P, Baumgarten G, Hoeft A, Poth J. 2013. β2-Adrenoceptor stimulation suppresses TLR9-dependent IFNA1 secretion in human peripheral blood mononuclear cells. PLoS One. 8:e65024.
- Ishimura M, Yamamoto H, Mizuno Y, Takada H, Goto M, Doi T, Hoshina T, Ohga S, Ohshima K, Hara T. 2013. A non-invasive diagnosis of histiocytic necrotizing lymphadenitis by means of gene expression profile analysis of peripheral blood mononuclear cells. J Clin Immunol. 33:1018–1026.
- Komatsu N, Matsueda S, Tashiro K, Ioji T, Shichijo S, Noguchi M, Yamada A, Doi A, Suekane S, Moriya F, et al. 2012. Gene expression profiles in peripheral blood as a biomarker in cancer patients receiving peptide vaccination. Cancer. 118:3208–3221.
- Koyama S, Aoshi T, Tanimoto T, Kumagai Y, Kobiyama K, Tougan T, Sakurai K, Coban C, Horii T, Akira S, et al. 2010. Plasmacytoid dendritic cells delineate immunogenicity of influenza vaccine subtypes. Sci Transl Med. 2:25ra24.
- Margolis K, Nichol K, Poland G, Pluhar R. 1990. Frequency of adverse reactions to influenza vaccine in the elderly. A randomized, placebo-controlled trial. JAMA. 264:1139–1141.
- Margolis K, Poland G, Nichol K, MacPherson D, Meyer J, Korn J, Lofgren R. 1990. Frequency of adverse reactions after influenza vaccination. Am J Med. 88:27–30.
- Marshall J, Heeke D, Gesner M, Livingston B, van Nest G. 2007. Negative regulation of TLR9-mediated IFN-α induction by a small-molecule, synthetic TLR7 ligand. J Leukoc Biol. 82:497–508.
- Mizukami T, Imai J, Hamaguchi I, Kawamura M, Momose H, Naito S, Maeyama J, Masumi A, Kuramitsu M, Takizawa K, et al. 2008. Application of DNA microarray technology to influenza A/Vietnam/1194/2004 (H5N1) vaccine safety evaluation. Vaccine. 26:2270–2283.
- Mizukami T, Momose H, Kuramitsu M, Takizawa K, Araki K, Furuhata K, Ishii K, Hamaguchi I, Yamaguchi K. 2014. System vaccinology for the evaluation of influenza vaccine safety by multiplex gene detection of novel biomarkers in a preclinical study and batch release test. PLoS One. 9:e101835.
- Momose H, Mizukami T, Kuramitsu M, Takizawa K, Masumi A, Araki K, Furuhata K, Yamaguchi K, Hamaguchi I. 2015. Establishment of a new quality control and vaccine safety test for influenza vaccines and adjuvants using gene expression profiling. PLoS One. 10:e0124392.
- National Institute of Infectious Diseases (NIID). 2006. Minimum requirements for biological products. Japan: National Institute of Infectious Diseases (General Tests; p. 272–336 and Influenza Vaccine; p. 10–13).
- Nichol K, Margolis K, Lind A, Murdoch M, McFadden R, Hauge M, Magnan S, Drake M. 1996. Side-effects associated with influenza vaccination in healthy working adults. A randomized, placebo-controlled trial. Arch Int Med. 156:1546–1550.
- Pablos J, Amara A, Bouloc A, Santiago B, Caruz A, Galindo M, Delaunay T, Virelizier J, Arenzana-Seisdedos F. 1999. Stromal-cell derived factor is expressed by dendritic cells and endothelium in human skin. Am J Pathol. 155:1577–1586.
- Pang I, Iwasaki A. 2011. Inflammasomes as mediators of immunity against influenza virus. Trends Immunol. 32:34–41.
- Pfeffer L. 2011. The role of nuclear factor κB in the interferon response. J Interferon Cytokine Res. 31:553–559.
- Pickering J, Smith H, Sweet C. 1992. Influenza virus pyrogenicity: Central role of structural orientation of virion components and involvement of viral lipids and glycoproteins. J Gen Virol. 73:1345–1354.
- Piqueras B, Connolly J, Freitas H, Palucka A, Banchereau J. 2006. Upon viral exposure, myeloid and plasmacytoid dendritic cells produce three waves of distinct chemokines to recruit immune effectors. Blood. 107:2613–2618.
- Quesada J, Talpaz M, Rios A, Kurzrock R, Gutterman J. 1986. Clinical toxicity of interferons in cancer patients: A review. J Clin Oncol. 4:234–243.
- Reimann K, Chernoff M, Wilkening C, Nickerson C, Landay A. 2000. Preservation of lymphocyte immunophenotype and proliferative responses in cryopreserved peripheral blood mononuclear cells from human immunodeficiency virus type 1-infected donors: Implications for multicenter clinical trials. The ACTG immunology advanced technology laboratories. Clin Diagn Lab Immunol. 7:352–359.
- Sambor A, Garcia A, Berrong M, Pickeral J, Brown S, Rountree W, Sanchez A, Pollara J, Frahm N, Keinonen S, et al. 2014. Establishment and maintenance of a PBMC repository for functional cellular studies in support of clinical vaccine trials. J Immunol Meth. 409:107–116.
- Sasaki E, Kuramitsu M, Momose H, Kobiyama K, Aoshi T, Yamada H, Ishii KJ, Mizukami T, Hamaguchi I. 2017. A novel vaccinological evaluation of intranasal vaccine and adjuvant safety for preclinical tests. Vaccine. 35:821–830.
- Saurwein-Teissl M, Zisterer K, Schmitt T, Glück R, Cryz S, Grubeck-Loebenstein B. 1998. Whole virus influenza vaccine activates dendritic cells (DC) and stimulates cytokine production by peripheral blood mononuclear cells (PBMC) while subunit vaccines support T-cell proliferation. Clin Exp Immunol. 114:271–276.
- Takagi H, Fukaya T, Eizumi K, Sato Y, Sato K, Shibazaki A, Otsuka H, Hijikata A, Watanabe T, Ohara O, et al. 2011. Plasmacytoid dendritic cells are crucial for the initiation of inflammation and T-cell immunity in vivo. Immunity. 35:958–971.
- Takaoka A, Wang Z, Choi M, Yanai H, Negishi H, Ban T, Lu Y, Miyagishi M, Kodama T, Honda K, et al. 2007. DAI (DLM-1/ZBP1) is a cytosolic DNA sensor and an activator of innate immune response. Nature. 448:501–505.
- Tan Y, Tamayo P, Nakaya H, Pulendran B, Mesirov J, Haining W. 2014. Gene signatures related to B-cell proliferation predict influenza vaccine-induced antibody response. Eur J Immunol. 44:285–295.
- Upton J, Kaiser W, Mocarski E. 2012. DAI/ZBP1/DLM-1 complexes with RIP3 to mediate virus-induced programmed necrosis that is targeted by murine cytomegalovirus vIRA. Cell Host Microbe. 11:290–297.
- Wei L, Sandbulte M, Thomas P, Webby R, Homayouni R, Pfeffer L. 2006. NF-κB negatively regulates IFN-induced gene expression and anti-influenza activity. J Biol Chem. 281:11678–11684.
- Weinberg A, Tierney C, Kendall M, Bosch R, Patterson-Bartlett J, Erice A, Hirsch M, Polsky B. 2006. Cytomegalovirus-specific immunity and protection against viremia and disease in HIV-infected patients in the era of highly active antiretroviral therapy. J Infect Dis. 193:488–493.
- Wolf A, Buehler D, Hensley S, Cavanagh L, Wherry E, Kastner P, Chan S, Weninger W. 2009. Plasmacytoid dendritic cells are dispensable during primary influenza virus infection. J Immunol. 182:871–879.
- Wollenberg A, Wagner M, Günther S, Towarowski A, Tuma E, Moderer M, Rothenfusser S, Wetzel S, Endres S, Hartmann G. 2002. Plasmacytoid dendritic cells: A new cutaneous dendritic cell subset with distinct role in inflammatory skin diseases. J Invest Dermatol. 119:1096–1102.