
Abstract
Preeclampsia (PE) is a common obstetric syndrome with an unclear etiology and pathogenesis. The study here aimed to investigate the role of Yin Yang 1 (YY1) in PE, and to reveal any YY1-regulated mechanisms in PE. Peripheral blood, placenta, and endometrial tissues of PE patients, healthy volunteers, and patients who had undergone an elective Cesarean section and had a scarred uterus (control group) were collected for analyses. Rat PE models were established by lipopolysaccharide induction. Subsets of these rats were then made to over-express YY1. At 18 d after the PE was established, urine, blood, and placental tissues from all rats were collected. Levels of regulatory-T (Treg) and helper T-type 17 (TH17) cells in both human and rat blood were measured by flow cytometry. ELISA kits were used to evaluate blood levels of inflammatory factors (i.e. IL-6, IL-10, and IL-17) as well. RT-qPCR and Western blot assays were performed to quantify levels of forkhead box P3 (Foxp3), retinoic acid-related orphan receptor C (RORc), and YY1 in the human and rat placenta and endometrial tissues. Expressions of PI3K/AKT pathway-related proteins were also evaluated by Western blots. The results indicated that the PE patients, relative to levels in control group and the healthy control subjects, had decreased circulating levels of Treg cells/increased TH17 cells; tissues from these patients also had relatively-decreased FoxP3 mRNA and protein expressions and elevated RORc mRNA and protein expressions. YY1 was expressed only at low levels in the PE patient placenta and endometrial tissues. In rats, PE rats treated with over-expressed YY1 had (relative to in PE rats without over-induced YY1) increased circulating levels of Treg cells/decreased TH17 cells; tissues from these rats had elevated FoxP3 mRNA and protein expressions and reduced mRNA and protein RORc expressions, as well as indications of alleviated inflammation. In the rat placenta samples, YY1 was also determined to activate the PI3K/AKT pathway. In summary, YY1 regulates the balance among Treg/TH17 cells and so affect the PE process in part through activation of the PI3K/AKT pathway.
Introduction
Preeclampsia (PE) is a common complication of pregnancy, characterized by hypertension and proteinuria, together with augmented platelet consumption and generalized vasocon-striction during the second and third trimesters of gestation (Zhang et al. Citation2017). Pregnant women with PE have increased mortality, disability rates, and overall fetal mortality (Quan et al. Citation2018). The etiology and pathogenesis of PE are not fully understood, in part, due to a lack of reliable and effective ways to diagnose/prevent PE and effective therapies or pharmacological agents (Ahmed et al. Citation2017).
A previous study reported that PE may be caused by alterations in the innate and adaptive immune systems (Darmochwal-Kolarz et al. Citation2012). It is increasingly accepted that an imbalance among T-helper type 17 (TH17) and T-regulatory (Treg) cells (i.e. an event associated with inappropriate activation of the immune system) is closely associated with the occurrence of PE (Eghbal-Fard et al. Citation2019). Treg cells initiate immune responses directly via cell contact-dependent mechanisms or indirectly through induced production of immunomodulant cytokines such as interleukin [IL]-10 and transforming growth factor [TGF]-β (Quinn et al. Citation2011). TH17 cells are considered essential effector cells in the stimulation of inflammatory responses; a combined over-expression of TH17 cells and elevation in circulating pro-inflammatory cytokines (including IL-17 and IL-22) is capable of recruiting immune effector cells and secreting other inflammatory cytokines, leading to chronic inflammatory conditions (Darmochwal-Kolarz et al. Citation2012). It is not unsurprising then that elevated circulating levels of pro-inflammatory IL-6 and IL-17 and reduced levels of anti-inflammatory IL-10 and TGF-1β have been reported in PE (Ribeiro et al. Citation2017).
Yin Yang 1 (YY1) is a transcription factor that interacts with different regulatory proteins such as transcription factors, co-activators, and co-repressors (Castellano et al. Citation2009). YY1 has pleiotropic effects on multiple cellular processes, including cell growth, apoptosis, and differenti- ation (Gordon et al. Citation2006). With respect to cells/processes associated with PE, YY1 was shown to regulate trophoblast-endothelial cell interaction network under the regulation of miR-651-3p (Yin et al. Citation2021). Evidence has also shown that YY1 can affect the proliferation and infiltration of trophoblasts by regulating cytoskeleton-related proteins (Tian et al. Citation2016). With regard to the immune system, Hwang et al. (Citation2016) reported YY1 could suppress the differentiation and subsequent functionality of Treg cells in part by blocking expression of forkhead box P3 (Foxp3) and its target genes. Apart from what the above studies suggest, there is still no direct evidence to support a potential role for YY1 in regulating the onset/progression of PE.
In addition to the potential importance of YY1 in PE, because PI3K/AKT pathways are known to be important in the regulation on cell proliferation (Peng et al. Citation2018), investigations were undertaken to ascertain if the PI3K/AKT pathway participated in any manner in the pathogenesis of PE (Zhou et al. Citation2017; Zhang et al. Citation2018) and/or with abnormalities in placental development (Lague et al. Citation2010; Tong et al. Citation2016). Other studies showed that activity within the PI3K/Akt/eNOS pathway was associated with ANXA4-promoted trophoblast invasion (Xu et al. Citation2019) and with Mangiferin-ameliorated placental oxidative stress during PE (Huang et al. Citation2020).
Based on these above-noted findings, it would seem plausible that there are possible interaction between YY1 and the PI3K/AKT pathway in PE. Accordingly, this study was under- taken to explore such possible interactions of YY1 and PI3K/AKT pathways in PE, and how each of these might also impact on the balance among TH17/Treg cells as this also can lead to the onset/progression of PE.
Materials and methods
Clinical sample collection
This study was approved by the Ethics Committee of the Second Xiangya Hospital at Central South University (Approval #2020176). All patients signed informed consent forms before the study commenced.
Eighteen PE patients (PE group; all who who gave birth via Cesarean section), as well as 23 non-PE patients who had undergone an elective Cesarean section and had a scarred uterus (control group) were selected for enrollment in these experiments. All patients were recruited from the Second Xiangya Hospital of Central South University over the period from March 2019–July 2020. The diagnostic criteria for PE were based on those in the 9th Edition of Obstetrics and Gynecology: this included hypertension that appeared after 20 wk of pregnancy [with systolic blood pressure (SBP) ≥ 140 mm Hg and/or diastolic blood pressure (DBP) > 90 mm Hg]. Exclusion criteria here were: women who suffered other chronic diseases (i.e. hypertension, diabetes, chronic nephritis, autoimmune diseases), who had conceived with assisted reproductive technology, who had multiple pregnancies, who suffered from pregnancy complications other than PE, or had incomplete data on delivery.
Before delivery, fasting venous blood (≈ 8 ml) were collected and processed for subsequent analyses by flow cytometry using standard automated systems and by ELISA using commercial kits (see below). At delivery, the placentas of the PE patients and those controls who underwent Cesarean section were collected and rinsed with normal saline; the fetal chorio- amniotic membrane tissues were then harvested. All placental and endometrial tissues were stored in a liquid N2 until analyzed using RT-qPCR and Western blot protocols (see below). All offspring were evaluated for weight, as well as for Apgar scores in the 1st and 5th min after birth.
Establishment of PE rat models
All procedures were done in strict accordance with regulations approved by the Ethics Committee of Second Xiangya Hospital of Central South University (Approval #2020199).
A total of 30 female (10-wk-old) and 15 male (12-wk-old) Sprague-Dawley (SD) rats were purchased from the Hunan SJA Laboratory Animal Co. (Changsha, Hunan, China). All rats were housed under specific pathogen-free vivarium conditions of a stable temperature (20–22 °C) and 50% relative humidity, and with a 12 hr light:dark cycle. All rats were provided ad libitum access to standard rodent chow and filtered tap water. At the start of the experiment, male and female rats were caged together at a 1:2 ratio. Each day, presence/absence of a vaginal plug was evaluated. All rats with a plug were recorded as being at gestational day 0 (GD0). In the end, a total of 18 pregnant rats were obtained and these, in turn, were sub-divided into three groups (n = 6/group) for use in the studies described below.
Animal protocols
Based on the protocols of Wu et al. (Citation2015) and Li et al. (Citation2018), rats in the PE model group and in the OE-YY1 + model group were injected daily with 0.5 μg lipopolysaccharide/kg (LPS; type L5293 from Escherichia coli [Sigma, St. Louis, MO]) via the caudal vein on GD5-GD19. Rats in a sham group were injected in parallel with the same amount of normal saline. Rats in the OE-YY1 + model group were also injected via the caudal vein (at the same time) with 80 mg OE-YY1 adenovirus/kg (GeneChem, Shanghai, China) as outlined in Su et al. (Citation2020). No sham rats received this extra OE-YY1 treatment.
Every 3 d from GD0 to GD18, the systolic blood pressure (SBP) of the tail artery was measured using an noninvasive blood pressure monitor (BP-2010A, RWD Life Science Co., Shenzhen, China). Prior to euthanization on GD19, a 14-hr fasting urine was collected for determination of protein/creatinine ratios (Li et al. Citation2018); samples were collected (in metabolic cage) and then analyzed using a Seamaty biochemical analyzer (Seamaty, Chengdu, China). On GD19, all rats were euthanized by injection of a mixture of ketamine (60 mg/kg) and xylazine (5 mg/kg) into the peritoneal cavity. The chest of each rat was opened and blood collected from the heart for subsequent analyses by flow cytometry and ELISA. The rats then underwent a Cesarean section to obtain the fetuses; fetal weights and numbers were recorded. Placental decidual tissues were also collected and immediately frozen in liquid N2 for later analyses (see below).
Immunohistochemical staining for Treg cell presence in human placental samples
The deciduate placental tissues from the PE (n = 18) and control (n = 23) women that were harvested underwent fixation in paraffin. These samples were then sectioned (to 5 µm) and transferred to glass slides. These, in turn, were deparaffinized and hydrated, and then subjected to antigen retrieval in citrate buffer. Each sample was treated with 3% H2O2 solution, and then covered with a solution of phosphate-buffered saline (PBS, pH 7.4) containing 10% goat serum (Beyotime, Shanghai, China).
For Treg cell marker detection, parallel sections were either examined for surface expression of galectin-1 (normally over-expressed by Treg cells [Garin et al. Citation2007]) or permeabilized and then examined for intracellular expression of FoxP3. The slides for FoxP3 detection were coated with permeabilization working solution (Sigma) followed by incubation at 4 °C for 60 min. Thereafter, slides were coated with a solution of PBS bearing either rabbit anti-human Foxp3 antibody (ab215206, 1:100, manufacturer-recommended dilution; Abcam, Cambridge, UK) or rabbit anti-human galectin-1 (ab138513, 1:300; Abcam), and incubated for 2 hr at room temperature (RT). After gentle washing with PBS, goat horseradish peroxidase (HRP)- conju- gated anti-rabbit IgG (ab6112, 1:500; Abcam) in PBS was applied as a secondary antibody, and the slides were incubated at RT for 1 hr. After a rinsing with PBS, slides were coated with a commercial solution of 3,3′-diaminobenzidine (DAB) chromagen solution and incubated at RT for 10 min to permit antibody detection. All slides were then counterstained with hematoxylin solution, cover-slipped, and then examined in a blinded manner. For each sample, five fields of view/slide was selected to calculate the average number of positive cells (i.e. Treg) present.
TUNEL analyses of human samples
Transferase-mediated deoxyuridine triphosphate-biotin nick-end labeling (TUNEL) stain- ing kits were purchased from Beyotime. Here, slides containing harvested tissue sections from each group (see above) were fixed with 4% paraformaldehyde for 10 min, permeabilized with 0.2% Triton-X-100 (in PBS) for 10 min, and then treated with kit-provided blocking solution (#P0100B) for 20 min at RT. After a gentle rinsing with PBS, each sample was coated with 50 μl of kit-provided biotin labeling solution (containing 2.5 μl TdT enzyme and 22.5 μl Biotin-dUTP combined with 25 µl labeling solution [total reaction volume = 50 μl]) and incubated for 60 min at 37 °C in the dark. After a gentle rinsing, each slide received 50 μl kit-provided streptavidin- HRP solution and was incubated for 30 min at 37 °C. After a final rinsing, each slide was treated with 0.3 ml DAB solution and incubated for 5 min at 37 °C. After a PBS rinse, all sections were photographed using an Olympus microscope fitted with a digital camera (Tokyo, Japan). For each sample, five fields of view/slide were evaluated to help calculate the average number of TUNEL+ cells (staining brown) present.
EVOS imaging of human samples
The harvested clinical tissue sections were de-paraffinized and hydrated, stained with hematoxylin solution for 5 min, differentiated with a solution of 1% hydrochloric acid in ethanol for 30 s, dyed with 0.5% eosin stain for 3 min, dehydrated with gradient alcohol, cleared with xylene, and then blocked with neutral resin. The sections were then evaluated in an EVOS M700 imaging system (ThermoFisher Scientific, Waltham, MA). The criteria for determining tropho- blast infiltration depth in the placental bed were the infiltration depth of trophoblasts from the chorionic-decidual junction to the decidual-superficial muscle layer junction, i.e. a depth of ≥ 1/2 the decidual layer or < 1/2 the decidual layer. The criteria for the infiltration depth of trophoblasts in the superficial myometrium of the uterus were as follows: according to the infiltration degree of trophoblasts from the decidua-muscular layer junction to the muscular layer, they were divided into one low-power field (1LPF) (trophoblasts infiltrating myometrium penetrating into one low-power field at decidual-myometrial junction), 2LPF (trophoblasts infiltrating myometrium, penetrating into two low-power fields at decidual-myometrial junction), and 3LPF (trophoblasts infiltrating myometrium penetrating into three low-power fields at decidual-myometrial junction).
Criteria for determining infiltration density of trophoblasts in the placenta bed were based on the standards of Ota et al. (Citation2001) and the different depth levels of the above-mentioned trophoblasts infiltrating the membrana serotina and myometrium. In all cases, two observers evaluated the slices in a blinded manner. In each slice at the same level, the vascular dense area was avoided. Five non-overlapping fields were selected to count the trophoblasts using a high-power Olympus microscope (at 100×). The average number was used as the trophoblast infiltration density.
An Olympus optical microscope (400× magnification) was used to observe the changes in myometrium and placental bed, and to calculate the lumen area. In brief, each slice was first calibrated at a 40× magnification, and then 10 spiral arteries were randomly selected for observation via a CMIAS-II multifunctional true color pathological image analysis system (Motic China Group Co., Beijing, China). At least five spiral arteries in each slice were measured for the lumen area and wall thickness, and the average value was used for statistical analysis.
Flow cytometric analyses of rat and human blood samples
Peripheral blood mononuclear cells (PBMC) from the human and rat blood samples were isolated using standard density gradient centrifugation (Gradisol, Aqua Medica, Warsaw, Poland). After counting, 106 PBMC suspension (in 100 μl) was added to each flow tube; 10 μl fluorescein isothiocyanate (FITC)-conjugated anti-human CD4 antibody solution (#11-0048-41, eBioscience, San Diego, CA) was then added, and the tube incubated 30 min at 4 °C in the dark. Thereafter, 1 ml Foxp3 fixation/permeabilization working solution (Sigma) was added and each tube was incubated 60 min at 4 °C in the dark. Each sample then received 2 ml permeabilization buffer and was centrifuged (500 × g, 5 min, RT); resultant supernatant was removed and the cells re-suspended in PBS. Each tube then received a solution of 100 µl PBS containing 10 μl phyco- erythrin (PE)-conjugated anti-human Foxp3 antibody (#560082, Becton Dickinson, Franklin Lakes, NJ) and was incubated at RT for 20 min in the dark. After addition of FACS buffer (PBS, 0.5–1.0% BSA, 0.1% sodium azide), each sample was centrifuged and the final cell pellet re-suspended in FACS buffer. Levels of Treg cells were evaluated in BD flow cytometer (BD, San Jose, CA) using system-associated FlowJo software. A minimum of six samples per group was analyzed, with a minimum of 50,000 events acquired per sample.
To measure inducibility of TH17 cells, 1-ml aliquots (each with 106 cells) of the PBMC were placed in triplicate wells of a 24-well plate. After 5 hr at 37 °C, dedicated subsets of wells received a solution containing 500 ng phorbol myristate acetate/ml (PMA, Sigma) and 10 µg ionomycin/ml (BioLegend, San Diego, CA); control wells (basal cytokine production) received vehicle only. All plates were then incubated 5 hr at 37 °C. Thereafter, non-adherent [i.e. lymphocytes] cells were harvested from each well and then counted; after centrifugation, pelleted cells were re-suspended with PBS to a final concentration of 2 × 10⁶ cells/ml. An aliquot of each suspension (containing 106 cells) was removed, adjusted to a final volume of 500 µl, and then treated with a solution of 100 µl PBS containing 10 μl FITC-anti-CD4 antibody (11-0041-82, eBioscience). After incubation in the dark for 30 min at RT, the cells then received 100 μl Cell Fixation Buffer (BD) and were incubated in the dark for a further 30 min at RT. Each sample then received 2 ml Permeabilization Buffer (BD) and was incubated in the dark for 30 min at RT. The samples were then centrifuged (500 × g, 5 min, RT), the resulting supernatant was removed, and the cells re-suspended in 100 µl PBS. Each suspension then received 100 µl PBS containing 10 μl PE-conjugated anti-human IL-17A antibody (#14-7178-85, eBioscience) and was incubated in the dark for 40 min at RT. After addition of FACS buffer, each sample was centrifuged (500 × g, 5 min, RT) and the final cell pellet re-suspended in FACS buffer. Levels of TH17 cells were then assessed in the BD flow cytometer system as above. A minimum of six samples per group was analyzed, with a minimum of 50,000 events acquired per sample.
For analyses of rat blood samples, the same protocols as outlined above were employed with appropriate anti-rat antibodies.
ELISA analyses of cytokines in rat and human blood
Levels of select inflammatory factors (e.g. IL-6, IL-10, and IL-17) in peripheral blood from the rats and human patients were measured using commercial enzyme-linked immunosorbent assay (ELISA) kits (Beyotime), as per kit instructions. The level of detection for the human kits was ≈ 5–600 pg IL-6/ml, ≈ 62–2000 pg IL-10/ml, and ≈ 31–1000 pg IL-17/ml, and 250–8000 pg IL-6/ml, 125–4000 pg IL-10/ml, and ≈ 6–200 pg IL-17/ml for the rat kits.
Reverse transcription quantitative polymerase chain reaction analyses
Samples (i.e. 10 mg) of placental tissues from the human subjects (control group, n = 23; PE group, n = 18) and from the rats (n = 6/group) were each placed in 1 ml Trizol (ThermoFisher), and then total RNA was extracted based on kit instructions. The total RNA recovered was checked for purity and concentration using a Nanodrop system (ThermoFisher), and then an aliquot (≈ 1 µg) of each sample was reverse-transcribed using a Premix Ex TaqTM II kit (Takara, Dalian, China). Reverse transcription quantitative polymerase chain reactions (RT-qPCR) were then performed using reaction conditions outlined in . All steps were performed in an ABI7500 quantitative PCR instrument (Applied Biosystems, Shanghai, China). Glyceraldehyde phosphate dehydrogenase (GAPDH) was utilized as internal reference. All data were then analyzed by the 2−ΔΔCt method and relative mRNA expression levels were determined.
Table 1. Primer sequences used in the study.
Western blot analyses of human and rat placental samples
Samples (i.e. 100 mg) of placental tissues from the human subjects (control group, n = 23; PE group, n = 18) and from the rats (n = 6/group) were each placed in lysis buffer on ice for 0.5 hr and then centrifuged (15,000 rpm, 4 °C, 10–15 min) to pellet debris. Resulting supernatant was collected and total protein concentration determined with a bicinchoninic acid protein kit (#23227, ThermoFisher). Thereafter, an aliquot of protein (containing 20 µg total protein) was resolved over a 12% SDS-PAGE gel, and the separated proteins then electrotransferred to a PVDF membrane. Dedicated membranes were generated for each potential protein of interest so as to avoid the need for stripping steps after each evaluation (and thus potential loss of antigen).
Each membrane was placed in TBST (Tris-buffered saline [pH 7.4] containing 0.1% Tween-20) bearing 5% (w/v) nonfat milk powder and incubated at RT for 1 hr to block potential nonspecific binding sites. After a gentle rinsing with TBST, each membrane was coated with a solution of TBST bearing rabbit anti-human (or anti-rat) antibody against Foxp3 (1:500, ab215206), RORc (1:500, ab207082), YY1 (1:500, ab109237), phosphorylated (p)-PI3K (1:500, ab182651), PI3K (1:500, ab140307), p-AKT (1: 500, ab38449), OR AKT (1:500, ab8805), and incubated overnight at 4 °C. Each membrane was also probed with anti-GAPDH (1:1000, ab8245) as a protein loading control. All antibodies were from Abcam; dilutions used in each case were manufacturer-recommended. The next day, each membrane was gently rinsed with TBST, coated with TBST containing goat anti-rabbit IgG antibody (1:500, ab150077), and incubated at RT for 1 hr. After a final gentle rinsing with TBST, antibody presence on each membrane was detected using treatment with an enhanced chemiluminescence system reagent (ThermoFisher). Each membrane was then photographed in a BioSpectrum Imaging System (UVP, Hudson, MA) and density of antibody presence quantified using system-associated Image J software.
Statistical analysis
Data are presented as means ± SD. All data were subjected to K-S normal distribution tests. A Student’s t-test was utilized for comparisons between two groups; a one-way analysis of variance (ANOVA) and a Dunnett’s multiple comparisons test were used for comparisons among multiple groups. A p-value <0.05 was deemed significant. All analyses were performed using SPSS 18.0 (IBM, Armonk, NY) and Prism 6.0 (GraphPad, San Diego, CA) software.
Results
Comparison of clinical data
Clinical data for the patients who underwent elective Cesarean section [and had scarred uterus; control group], and patients with PE (PE group) are shown in . There was no significant difference in age between the two sets. No differences found between the PE and control groups with regard to measures taken from blood drawn at the gestational week indicated (all p > 0.05). The only parameters that revealed any inter-group differences were an elevated DBP and SBP in the PE subjects relative to values seen in women in the control group. Further, reduced offspring weights were observed with the PE mothers relative to in the control mothers, and proteinuria secretion was only observed in the PE mothers (all p < 0.01).
Table 2. Clinical data from patients in the control and PE groups.
Circulating/tissue levels of Treg and TH17 cells in PE and control groups
Flow cytometry was performed to assess blood levels of Treg and TH17 cells in the human subjects. Reduced Treg cell (CD4+Foxp3+) levels, elevated TH17 cell (CD4+IL-17A+) levels, and a decreased ratio of Treg/TH17 cells were found in the blood of the PE patients in comparison to in blood of control subjects (, p < 0.01). Immunohistochemical staining for Foxp3 protein in the placental tissues showed the numbers of Treg (Foxp3+) cells were reduced in the PE group vs. in the control and blank groups (; p < 0.01).
Figure 1. Circulating Treg and TH17 cell levels in human subjects. (A and B) Treg and TH17 cells in blood (flow cytometry). (C and D) detection of Treg cells in placental tissues (immunohistochemical staining). (E and F) Foxp3 and RORc mRNA and protein expression (RT-qPCR and Western blot analyses). **p < 0.01 vs. control group. Control group, n = 23; PE group, n = 18.
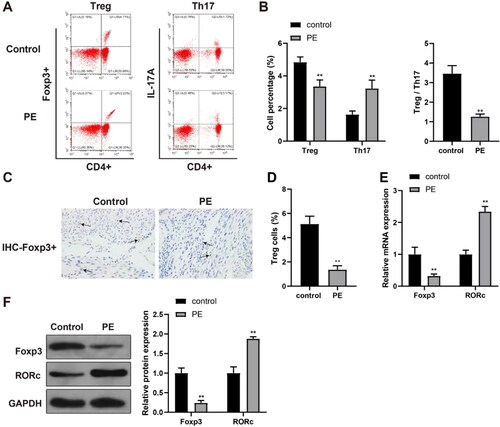
Foxp3 and RORc expression in PE and control placental samples
RT-qPCR and Western blot analyses were used to determine Foxp3 expression in placental tissues and RORc expression in TH17 cells. The results indicated significantly-reduced Foxp3 expression and elevated RORc expression in samples from the PE hosts in contrast to in the samples recovered from control (, p < 0.01).
Inflammation response indices in blood and cell apoptosis in placental tissues
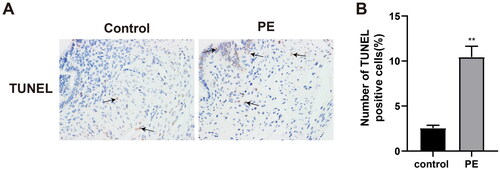
ELISA was used to measure levels of select inflammatory cytokines in the peripheral blood of the human subjects. The results indicated elevated blood levels of IL-6 and IL-17, and reduced IL-10 levels in the PE hosts vs in the blood from the control women (, p < 0.01) - suggestive of an enhanced inflammatory response in the PE patients. In addition, TUNEL staining of the placental tissues demonstrated that the ratios of TUNEL+ apoptotic cells were increased in the PE host tissues in comparison to in control host placentae (, p < 0.01) - suggestive of an increase in cell apoptosis associated with PE.
Figure 2. Inflammation response indices in the blood. (A-C) ELISA was used to measure select inflammatory cytokines in the peripheral blood. *p < 0.05, **p < 0.01 vs. control group. Control group, n = 23; PE group, n = 18.
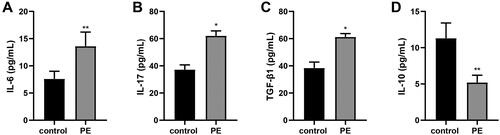
Figure 3. Cell apoptosis in placental tissues. TUNEL staining was used to assess levels of cell apoptosis in all harvested human placental tissues. **p < 0.01 vs. control group. Control group, n = 23; PE group, n = 18.
Trophoblast infiltration and placental blood flow
Hematoxylin-eosin (H&E) staining and EVOS imaging were used to assess the depth and density of trophoblast infiltration of the placenta. It was found that there was no change in the depth of trophoblast infiltration in the decidua, and the difference was mainly in the superficial myometrium of the uterus from the junction of the membrana serotina-muscle layer to 3LPF. The trophoblast invasion depth was found to have been decreased in tissues from the PE patients relative to those from the control women (, , p < 0.01).
Figure 4. Changes in trophoblast infiltration and spiral artery. (A) Changes in trophoblast infiltration and spiral artery. Spiral arteries: (B) without physiological and pathological changes (H&E, 200× magnification); (C) with physiological expansion (H&E, 200× magnification); or, (D) with pathological changes (H&E, 200× magnification). physiologically-altered spiral arteries (E) with trophoblast infiltration (immunohistochemical staining, 400× magnification) or (F) without trophoblast infiltration (immunohistochemical staining, 400× magnification). trophoblasts appear brownish yellow.
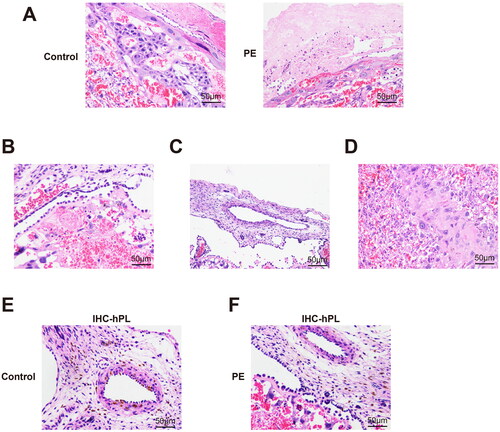
Table 3. Depth of trophoblast infiltrating membrana serotina and superficial myometrium of placenta bed.
With respect to density, trophoblast infiltration density ≤ 1/2 the membrana serotina was no different in the tissues from the PE and control hosts. However, the density from > the 1/2 membrana serotina to the superficial myometrium of the uterus, as well as at the superficial myometrium of the uterus, was reduced in the PE group vs. in tissues from the control group (, , p < 0.01).
Table 4. Density of trophoblast infiltrating membrana serotina and superficial myometrium of placenta bed.
The average lumen area of the spiral artery in the membrana serotina and the superficial myometrium of the placenta bed were significantly smaller in the PE women than in samples from the control women; the average wall thickness was thicker in the PE group in contrast to the control groups (, all p < 0.05). HE and immunohistochemical staining results of the control group () and the PE group () showed that compared with the control group, there were more pathological changes and irrational changes in spiral arteries of the PE group ().
Table 5. Lumen area and wall thickness of spiral artery in placental bed.
Zinc finger protein YY1 expression in human placenta samples
As evidence has shown YY1 can regulate cytoskeleton-related proteins and so affect trophoblast proliferation/infiltration (Tian et al. Citation2016), YY1 expression in placental tissues was evaluated. The results suggested there was reduced YY1 expression in the PE group placentae vs. in samples from control hosts (, p < 0.01). Further, linear correlation analysis showed YY1 expression was positively-correlated with Foxp3 expression (, p < 0.01).
Figure 5. Over-expression of YY1 and the PE process. RT-qPCR and Western blot analysis were used to determine YY1 (A) mRNA and (B) protein expression in human placental samples. (C) Linear correlation analysis of the correlation between YY1 and Foxp3 expression in PE patient placental tissues. RT-qPCR and Western blot analyses were used to determine YY1 (D) mRNA and (E) protein expression in rat placental tissues. (F) Blood pressure in rats. (G) Rat urinary protein content. (H-J) Blood inflammatory cytokines (ELISA). N = 6/group. *p < 0.05, ** p < 0.01 vs. sham group; #p < 0.05 vs. control group.
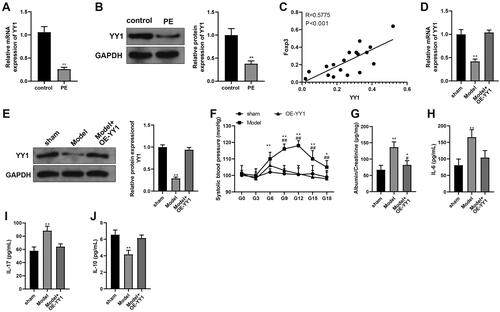
Rat model results
With the rat PE model, the findings revealed there was a reduction in YY1 expression in the PE model group relative to in tissues from the sham group. Further, expression of YY1 was elevated in the tissues of the PE hosts who also over-expressed YY1 (OE-YY1) vs. in samples from the PE model group (, p < 0.01), indicating success of the adenovirus infection.
To confirm the model was induced, PE-related indicators were measured for rats in each group. The results indicated that from the beginning of GD6, there were PE-associated elevations in blood pressure, urine protein/creatinine ratios, and levels of IL-6 and IL-17 in the peripheral blood, as well as reduced IL-10 levels relative to corresponding endpoints measured in the sham rats (, p < 0.01). Pup-related results are displayed in . Pup weights were decreased in the PE model group in comparison to sham group pups (p < 0.05). These results indicate the PE rat model was successfully established.
Table 6. Pregnancy-related indicators in rat hosts.
Next, the relevant indicators of rats in the Model + OE-YY1 group were determined. The findings indicated reduced blood pressure, urine protein/creatinine ratios, and levels of IL-6 and IL-17 in the peripheral blood, as well as elevated IL-10 levels and increased pup body weights in the Model + OE-YY1 group relative to in the model group (, , p < 0.05). Flow cytometry used to assess ratios of TH17 and Treg cells in peripheral blood showed there was reduced levels of Treg cells, elevated levels of TH17 cells, and accordingly decreased ratios of Treg/TH17 in the PE rats in comparison to in the sham rats. Interestingly, there were increased Treg cell levels, decreased TH17 cell levels, and accordingly elevated Treg/TH17 cell ratios in the OE-YY1 rats relative to each endpoint in the PE model rats (, p < 0.01).
Figure 6. Over-expression of YY1 inhibits the PE process. Levels of (A) TH17 and (B) Treg cells (flow cytometry). Foxp3 and RORc (C) mRNA and (D) protein expression (RT-qPCR and Western blot analyses). *p < 0.05, **p < 0.01 vs. sham or control group. N = 6/group.
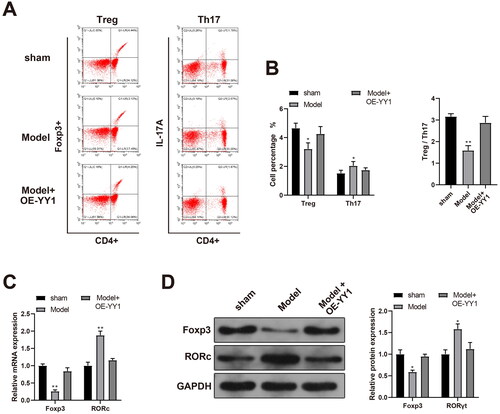
The RT-qPCR and Western blot analyses revealed there was reduced Foxp3 expression and elevated RORc expression in the placental samples from the PE model rats in contrast to in those from the sham set. These analyses also indicated there was enhanced Foxp3 expression and reduced RORc expression in the samples from the OE-YY1 rats relative to in those of PE rats (, p < 0.05). These results suggested to us that YY1 might be able to affect the PE process, in part, by regulating the number of Treg and TH17 cells in circulation.
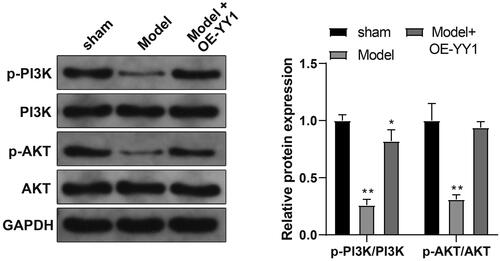
YY1 effects on the PI3K/AKT pathway in situ
As noted above, PI3K/AKT pathways in PE are activated; this could lead to unfavorable outcomes for placenta formation in part, by promotion of trophoblast proliferation, migration, and invasion, and by inhibition of oxidative stress (Li et al. Citation2021). With an aim here to determine if YY1 regulated the PI3K/AKT pathway in the PE rat, placental tissue expression of PI3K/AKT pathway-related proteins was evaluated. The results indicated a decreased ratio of p-PI3K/PI3K and p-AKT/AKT expression in PE model rat tissues compared with in tissues from sham rats. In comparison, the ratio of p-PI3K/PI3K and p-AKT/AKT was increased in tissues from the Model + OE-YY1 group vs. in those from the PE model group (, p < 0.01). These outcomes suggested to us that YY1 may function in PE by activating the PI3K/AKT pathway.
Figure 7. YY1 activates the PI3K/AKT pathway. Expression of PI3K/AKT pathway-related proteins in placental tissues (Western blot). *p < 0.05, **p < 0.01 vs. sham group. N = 6/group.
Discussion
PE is a leading reason of prematurity and secondary complications in all pregnancies (Li et al. Citation2021). To data, therapeutic options for PE are limited, and the only effective therapy for PE is the delivery of the fetus and placenta though anti-hypertensive drugs, and magnesium sulfate is useful in the prevention and treatment of preeclampsia (Eddy et al. Citation2018). Therefore, the prevention on the occurrence and development of PE toward complications could be the best way to diminish its dramatic outcomes. The findings here suggested to us that YY1 may regulate PE, in part, by affecting the balance among Treg and TH17 cells and activation of the PI3K/AKT pathway.
A variety of T-helper cell subsets (e.g. TH1, TH2, TH17, and Treg) have been implicated in the pathogenesis of PE, and there seems to be a predominance of TH1 and TH17 cytokine production associated with the syndrome (Darmochwal-Kolarz et al. Citation2012). Interestingly, both TH17, and Treg cells help to regulate TH1 and TH2 expression in situ. As the functions of Treg cells are determined by Foxp3 expression (master switch transcription factor), and functions of TH17 cells are determined by the transcription factor RORc, Foxp3 and RORc in effect are essential modulators of the TH1/TH2 balance (Jianjun et al. Citation2010). When the balance among TH1:TH2 cells is broken and a TH1-predominant state emerges, inflammatory cytokines including IL-2 as well as tumor necrosis factor (TNF)-α and -β are released by TH1 cells, resulting in a pro-inflam- matory state (Saito and Sakai Citation2003; Vargas-Rojas et al. Citation2016). Thus, it was not surprising that there were irregularities in the levels of TH17 and Treg cells the PE patients here. Specifically, the present study found that PE patients had decreased levels of Treg cells and increased TH17 cells in their blood, along with decreased FoxP3 expression and elevated RORc expression, aggravated inflammation (reflected by elevated IL-6 and IL-17 levels, and reduced IL-10 levels), and elevated cell apoptosis in their placental tissues. These PE patients also had suppressed trophoblast infiltration and reduced placental blood flow.
An earlier study demonstrated that a reduction in Treg cells and an elevation in TH17 cells were found in the peripheral blood of patients with PE, implying that an imbalance among TH17 and Treg cells could lead to the inflammatory response activation seen in this pathology (Santner-Nanan et al. Citation2009). Another study noted that women with PE exhibited an elevation in TH1/TH17 inflammatory cytokines and a reduction in TH2/Treg anti-inflammatory cytokines, as evidenced by increased expressions of T-bet and RORc and decreased expressions of GATA-3 and FoxP3 (Ribeiro et al. Citation2017).
Generally, Treg cells can enhance maternal-fetal tolerance and an imbalance of TH2/Treg cells may a regulator of host susceptibility to PE (Aluvihare et al. Citation2004). This unusual outcome may be explained by sample bias or other indefinable reasons. Regardless, the findings here highlight the complexity of immune cell involvement during pregnancy and encourage a further exploration of the possible interactions among immune cells during the onset/progression of PE.
Importantly, inhibition of YY1 has been found to suppress trophoblast invasion in an ex vivo explant culture model (Tian et al. Citation2016). In this study, the data suggested that YY1 was only expressed at low levels in PE patients. At the same time, rats in the Model + OE-YY1 group had increased circulating levels of Treg cells and decreased levels of TH17 cells. These same hosts also had elevated FoxP3 expression and reduced RORc expression in their placentas, decreased circulating levels of IL-6 and IL-17, as well as elevated IL-10 levels. Similar patterns of results were found in a study exploring mechanisms by which YY1 might regulate neuroinflammation and neuropathic pain (Sun et al. Citation2020). In that study, results demonstrated that YY1 suppressed signal transducer and activator of transcription 3 (STAT3)-mediated production of inflammatory factors in a dose-related manner. Moreover, with respect to T-cell subset differentiation, YY1 was shown to modulate expression of GATA3 (TH2 cell master regulator and also Treg cell-inducer Foxp3) and IL-12 (factor significant for TH1 cytokine production) (Kosasih and Bonavida Citation2019). When taken together, the current data and the results of the cited studies suggest to us that YY1 could potentially affect the PE process by impacting on various immune cells.
Many signals have been revealed to play a role in trophoblast growth and invasion (Fitzgerald et al. Citation2008; Prast et al. Citation2008; Gupta et al. Citation2016). Among these, the PI3K/AKT pathway is a vital pathway regulating the growth factor-dependent modulation of trophoblast growth and invasion (Knofler and Pollheimer Citation2012). YY1 is considered as a direct downstream effector of AKT (Zhang et al. Citation2018), and AKT down-regulation can reduce YY1 protein expression by ≈ 50% (Petrella and Brinckerhoff Citation2009). To elucidate whether YY1 regulated the PI3K/AKT pathway in the PE rat model here, expression of PI3K/AKT pathway-related proteins in the placental tissues was assessed. The results suggested that PE rats exhibited elevated ratio of p-PI3K/PI3K and p-AKT/AKT, and the levels of which were increased by over-expressed YY1, suggesting YY1 activates the PI3K/AKT pathway. Moreover, YY1 has been found to enhance the PI3K/AKT signaling activation, consequently promoting trophoblast invasion (Zhang et al. Citation2017). Thus, the PI3K/AKT/mTOR axis affects many tissue-dependent cellular functions; this is likely to be very significant with respect to various aspects of cell growth in both normal physiological and non-normal pathological conditions (Engelman et al. Citation2006).
Conclusions
The results from the present study suggest to us that YY1 may regulate the immune balance among Treg and TH17 cells and activate PI3K/AKT pathways, both of which together or independently might influence the onset/progression of PE. This knowledge may result in a better understanding of the adaptive immune system involvement in the pathophysiology of this particular gestational pathology. As such, treatment modalities might then be developed to help mitigate this problem for pregnant women.
Author contributions
LH and YM contributed to the conception of the study and performed the experiment. LH and DY contributed significantly to the data analysis and manuscript preparation. YM and DY performed the data analyses and wrote the manuscript. All authors approved the final version of the manuscript.
Disclosure statement
The authors declare no conflicts of interest. The authors alone are responsible for the content of this manuscript.
Additional information
Funding
References
- Ahmed A, Rezai H, Broadway-Stringer S. 2017. Evidence-based revised view of the patho- physiology of preeclampsia. Adv Exp Med Biol. 956:355–374.
- Aluvihare V, Kallikourdis M, Betz A. 2004. Regulatory T-cells mediate maternal tolerance to the fetus. Nat Immunol. 5(3):266–271. doi: 10.1038/ni1037.
- Castellano G, Torrisi E, Ligresti G, Malaponte G, Militello L, Russo A, McCubrey J, Canevari S, Libra M. 2009. Involvement of transcription factor Yin Yang 1 in cancer development and progression. Cell Cycle. 8(9):1367–1372. doi: 10.4161/cc.8.9.8314.
- Darmochwal-Kolarz D, Kludka-Sternik M, Tabarkiewicz J, Kolarz B, Rolinski J, Leszczynska- Gorzelak B, Oleszczuk J. 2012. The predominance of TH17 lymphocytes and decreased number and function of Treg cells in preeclampsia. J Reprod Immunol. 93(2):75–81. doi: 10.1016/j.jri.2012.01.006.
- Eddy A, Bidwell G, George E. 2018. Pro-angiogenic therapeutics for preeclampsia. Biol Sex Differ. 9(1):36–47. doi: 10.1186/s13293-018-0195-5.
- Eghbal-Fard S, Yousefi M, Heydarlou H, Ahmadi M, Taghavi S, Movasaghpour A, Jadidi- Niaragh F, Yousefi B, Dolati S, Hojjat-Farsangi M, et al. 2019. The imbalance of TH17/Treg axis involved in the pathogenesis of preeclampsia. J Cell Physiol. 234(4):5106–5116. doi: 10.1002/jcp.27315.
- Engelman J, Luo J, Cantley L. 2006. Evolution of phosphatidylinositol 3-kinases as regulators of growth and metabolism. Nat Rev Genet. 7(8):606–619. doi: 10.1038/nrg1879.
- Fitzgerald J, Poehlmann T, Schleussner E, Markert U. 2008. Trophoblast invasion: Role of intracellular cytokine signalling via signal transducer and activator of transcription 3 (STAT3). Human Reprod Update. 14(4):335–344. doi: 10.1093/humupd/dmn010.
- Garin M, Chu C, Golshayan D, Cernuda-Morollon E, Wait R, Lechler R. 2007. Galectin-1: A key effector of regulation mediated by CD4+CD25+ T-cells. Blood. 109(5):2058–2065. doi: 10.1182/blood-2006-04-016451.
- Gordon S, Akopyan G, Garban H, Bonavida B. 2006. Transcription factor YY1: Structure, function, and therapeutic implications in cancer biology. Oncogene. 25(8):1125–1142. doi: 10.1038/sj.onc.1209080.
- Gupta S, Malhotra S, Malik A, Verma S, Chaudhary P. 2016. Cell signaling pathways involved during invasion and syncytialization of trophoblast cells. Am J Reprod Immunol. 75(3):361–371. doi: 10.1111/aji.12436.
- Huang J, Zheng L, Wang F, Su Y, Kong H, Xin H. 2020. Mangiferin ameliorates placental oxidative stress and activates PI3K/Akt/mTOR pathway in mouse model of preeclampsia. Arch Pharm Res. 43(2):233–241. doi: 10.1007/s12272-020-01220-7.
- Hwang S, Jang S, Kim M, Kim L, Kim B, Kim H, Kim K, Lee W, Flavell R, Lee G. 2016. YY1 inhibits differentiation and function of regulatory T-cells by blocking Foxp3 expression and activity. Nat Commun. 7:10789. doi: 10.1038/ncomms10789.
- Jianjun Z, Yali H, Zhiqun W, Mingming Z, Xia Z. 2010. Imbalance of T-cell transcription factors contributes to the TH1 type immunity predominant in preeclampsia. Am J Reprod Immunol. 63(1):38–45. doi: 10.1111/j.1600-0897.2009.00763.x.
- Knofler M, Pollheimer J. 2012. IFPA Award in placentology lecture: Molecular regulation of human trophoblast invasion. Placenta. 33(S55):S55–S62. doi: 10.1016/j.placenta.2011.09.019.
- Kosasih F, Bonavida B. 2019. Involvement of Yin Yang 1 (YY1) expression in T-cell subsets differentiation and their functions: Implications in T-cell-mediated diseases. Crit Rev Immunol. 39(6):491–510. doi: 10.1615/CritRevImmunol.2020033272.
- Lague M, Detmar J, Paquet M, Boyer A, Richards J, Adamson S, Boerboom D. 2010. Decidual PTEN expression is required for trophoblast invasion in the mouse. Am J Physiol. E299:936–946.
- Li G, Ma L, Lin L, Wang Y, Yang H. 2018. Intervention effect of aspirin on a lipopolysaccharide- induced preeclampsia-like mouse model by inhibiting the NF-κB pathway. Biol Reprod. 99(2):422–432. doi: 10.1093/biolre/ioy025.
- Li T, Wei S, Fan C, Tang D, Luo D. 2021. Nesfatin-1 promotes proliferation, migration and invasion of HTR-8/SVneo trophoblast cells and inhibits oxidative stress via activation of PI3K/AKT/mTOR and AKT/GSK3β pathway. Reprod Sci. 28(2):550–561. doi: 10.1007/s43032-020-00324-1.
- Ota H, Igarashi S, Sasaki M, Tanaka T. 2001. Distribution of cyclooxygenase-2 in eutopic and ectopic endometrium in endometriosis and adenomyosis. Hum Reprod. 16(3):561–566. doi: 10.1093/humrep/16.3.561.
- Peng X, Wang Z, Liu Y, Peng X, Liu Y, Zhu S, Zhang Z, Qiu Y, Jin M, Wang R, et al. 2018. Oxyfadichalcone C inhibits melanoma A375 cell proliferation and metastasis via suppressing PI3K/Akt and MAPK/ERK pathways. Life Sci. 206:35–44. doi: 10.1016/j.lfs.2018.05.032.
- Petrella B, Brinckerhoff C. 2009. PTEN suppression of YY1 induces HIF-2 activity in von-Hippel-Lindau-null renal-cell carcinoma. Cancer Biol Ther. 8(14):1389–1401. doi: 10.4161/cbt.8.14.8880.
- Prast J, Saleh L, Husslein H, Sonderegger S, Helmer H, Knofler M. 2008. Human chorionic gonadotropin stimulates trophoblast invasion through extracellularly regulated kinase and AKT signaling. Endocrinology. 149(3):979–987. doi: 10.1210/en.2007-1282.
- Quan L, Xu Q, Zhang G, Wu L, Xu H. 2018. An analysis of the risk factors of preeclampsia and prediction based on combined biochemical indexes. Kaohsiung J Med Sci. 34(2):109–112. doi: 10.1016/j.kjms.2017.10.001.
- Quinn K, Lacoursiere D, Cui L, Bui J, Parast M. 2011. Unique pathophysiology of early-onset severe preeclampsia: Role of decidual T regulatory cells. J Reprod Immunol. 91(1-2):76–82. doi: 10.1016/j.jri.2011.05.006.
- Ribeiro V, Romao-Veiga M, Romagnoli G, Matias M, Nunes P, Borges V, Peracoli J, Peracoli M. 2017. Association between cytokine profile and transcription factors produced by T-cell subsets in early- and late-onset pre-eclampsia. Immunology. 152(1):163–173. doi: 10.1111/imm.12757.
- Saito S, Sakai M. 2003. TH1/TH2 balance in preeclampsia. J Reprod Immunol. 59(2):161–173. doi: 10.1016/s0165-0378(03)00045-7.
- Santner-Nanan B, Peek M, Khanam R, Richarts L, Zhu E, Fazekas de St Groth B, Nanan R. 2009. Systemic increase in the ratio between Foxp3+ and IL-17-producing CD4+ T-cells in healthy pregnancy but not in preeclampsia. J Immunol. 183(11):7023–7030. doi: 10.4049/jimmunol.0901154.
- Su B, Han H, Ji C, Hu W, Yao J, Yang J, Fan Y, Li J. 2020. MiR-21 promotes calcium oxalate- induced renal tubular cell injury by targeting PPARA. Am J Physiol. F319:202–214.
- Sun M, Sun Y, Ma J, Li K. 2020. YY1 promotes SOCS3 expression to inhibit STAT3‑mediated neuro- inflammation and neuropathic pain. Mol Med Rep. 23(2):103. doi: 10.3892/mmr.2020.11742.
- Tian F, Cheng Y, Li X, Wang F, Qin C, Ma X, Yang J, Lin Y. 2016. The YY1/MMP2 axis promotes trophoblast invasion at the maternal-fetal interface. J Pathol. 239(1):36–47. doi: 10.1002/path.4694.
- Tong C, Feng X, Chen J, Qi X, Zhou L, Shi S, Kc K, Stanley J, Baker P, Zhang H. 2016. G protein-coupled receptor 30 regulates trophoblast invasion and its deficiency is associated with preeclampsia. J Hypertens. 34(4):710–718. doi: 10.1097/HJH.0000000000000844.
- Vargas-Rojas M, Solleiro-Villavicencio H, Soto-Vega E. 2016. TH1, TH2, TH17 and Treg levels in umbilical cord blood in preeclampsia. J Matern Fetal Neonatal Med. 29(10):1642–1645. doi: 10.3109/14767058.2015.1057811.
- Wu Y, Zhang Y, Wang L, Diao Z, Liu W. 2015. The role of autophagy in kidney inflammatory injury via the NF-κB route induced by LPS. Int J Med Sci. 12(8):655–667. doi: 10.7150/ijms.12460.
- Xu Y, Sui L, Qiu B, Yin X, Liu J, Zhang X. 2019. ANXA4 promotes trophoblast invasion via the PI3K/Akt/eNOS pathway in preeclampsia. Am J Physiol. 316:481–491.
- Yin Y, Zhang J, Yu H, Liu M, Zheng X, Zhou R. 2021. Effect of lncRNA-ATB/miR-651-3p/Yin Yang 1 pathway on trophoblast-endothelial cell interaction networks. J Cell Mol Med. 25(12):5391–5403. doi: 10.1111/jcmm.16550.
- Zhang Y, He S, Mei R, Kang Y, Duan J, Wei R, Xiang C, Wu Y, Lu X, Cai Z, et al. 2018. miR29a suppresses IL-13-induced cell invasion by inhibiting YY1 in AKT pathway in lung adeno- carcinoma A549 cells. Oncol Rep. 39(6):2613–2623. doi: 10.3892/or.2018.6352.
- Zhang Y, Jin F, Li X, Shen F, Ma X, Wu F, Zhang S, Zeng W, Liu X, Fan J, et al. 2017. The YY1-HOTAIR-MMP2 signaling axis controls trophoblast invasion at the maternal-fetal interface. Mol Ther. 25(10):2394–2403. doi: 10.1016/j.ymthe.2017.06.028.
- Zhang Y, Liu Z, Tian M, Hu X, Wang L, Ji J, Liao A. 2018. The altered PD-1/PD-L1 pathway delivers the ‘one-two punch’ effects to promote the Treg/TH17 imbalance in pre-eclampsia. Cell Mol Immunol. 15(7):710–723. doi: 10.1038/cmi.2017.70.
- Zhou C, Zou Q, Li H, Wang R, Liu A, Magness R, Zheng J. 2017. Preeclampsia down-regulates micrornas in fetal endothelial cells: Roles of miR-29a/c-3p in endothelial function. J Clin Endocrinol Metab. 102(9):3470–3479. doi: 10.1210/jc.2017-00849.