
Abstract
Throughout the United States, urban food systems are in suboptimal states that are not operating efficiently or equitably and thus do not support food security for all. Creating transformation to a more sustainable and desirable state first requires acknowledging the different values of diverse groups within a city. Then these diverse values can be used to explore pluralistic pathways to futures that maximize benefits for multiple stakeholders. We demonstrate how integrating visioning and Q-methodology can achieve an inclusive understanding of values as priorities for such a food system. Applied in Flint, Michigan, a post-industrial Rust Belt city, this approach can shape the planning process for cities experiencing food insecurity. Qualitative analysis of data from a visioning workshop resulted in sixteen values as priorities for a sustainable and desirable food system. Values as priorities were then ranked in a Q-sort activity, from which three unique groups of ranking patterns emerged, each of which can be interpreted as a vision for a better future. The three visions were a food system with healthy foods that residents are willing to travel for; a food system with convenient, fresh food options for those who cannot travel; and a food system that maintains the community’s food traditions. Our novel mixed methods approach empowers communities by giving them a voice in the planning process but also allows decision makers to create transformation pathways that more accurately reflect the needs of the various subsets of community members who hold diverse visions and priorities.
Introduction
Many food systems across the United States are operating in a suboptimal state, associated with high rates of food insecurity (Coleman-Jensen et al. Citation2021; Ghosh-Dastidar et al. Citation2014). While top-down approaches like adding supermarkets have been suggested to improve food security (Zenk et al. Citation2005), recent literature shows this has not addressed the core structural issues that create food-access challenges, such as poverty and racism (Alkon et al. Citation2013; Brones Citation2018; Budzynska et al. Citation2013; Ghosh-Dastidar et al. Citation2017) and instead bottom-up change has been posited to be more effective at achieving food justice (Tornaghi Citation2017). Diverse knowledge and plural pathways are required to create effective change to more sustainable states, as well as acknowledging the essentially political nature of such change, as without these elements, top-down visions of change risk perpetuating current inequities (Scoones et al. Citation2020). Therefore, understanding diverse priorities from across the range of stakeholders with an emphasis on food-insecure communities is essential. These priorities should be used to create concrete vision statements to inform the planning of pluralistic pathways to sustainable and transformative outcomes, as recent research on grassroots change in food systems documents a limited impact on food-security outcomes without integration into the planning system (Corcoran Citation2021; Tornaghi and Certoma Citation2019).
We describe in this article a novel methodological approach, integrating visioning and Q-methodology, first to achieve an inclusive understanding of values as priorities for a desirable food system and second to understand how these values are prioritized by those with diverse perspectives. The understanding of both components allows us to translate shared values into concrete and actionable visions for food-system futures. Integrating such perspectives into food-system planning is more likely to achieve a desirable, equitable, and food-secure future while empowering participating community members.
Theoretical framing
There are two main elements to our theoretical framing: food systems and values as priorities. Food systems encompass the interactions within a social-ecological system that are associated with the production, processing, distribution, and consumption of food, with food security as the primary goal (Ericksen Citation2008). The United Nations Food and Agriculture Organization (FAO) declares, “food security exists when all people, at all times, have physical, social and economic access to sufficient, safe and nutritious food which meets their dietary needs and food preferences for an active and healthy life” (FAO Citation2002). If a food system is not in a desirable state and achieving food security, methods that acknowledge the systemic nature of food are necessary to identify problems, desired outcomes, and potential pathways forward. Values are one way of studying these elements.
Tadaki, Sinner, and Chan (Citation2017, 5) present values as priorities as values that influence decision making and can be used to understand the “patterns of priorities” among affected groups of people, usually in relation to environmental problems. There is relatively small literature analyzing values associated with food systems with most contributions addressing either the motivation and behavior relating to food producers (i.e., Lincoln and Ardoin Citation2016) or consumers (i.e., Ulvila Citation2018), and do not reference value theories specific to food systems but instead pull from two existing frameworks – social frames such as social value theory (Schwartz Citation2012) and environmental frames, often related to agricultural values (Dietz, Fitzgerald, and Shwom Citation2005). Tadaki, Sinner, and Chan (Citation2017) offer an inductive way of understanding values which is connected to the future – values as priorities are described as ideas in reference to a desirable end state. Therefore, they are well suited to consider how a set of food-system values may emerge from thinking about the future. Additionally, the inequities in urban food systems create a lack of trust – an inductive and participatory approach, rather than working from an existing set of values not specific to the context, is important to give residents the ability to identify their own values with respect to the food system.
Analytical framing
Visioning, a tool for exploring desirable futures, is one potential starting point for thinking about an optimal food system while providing opportunities for community engagement to elicit values as priorities. In recent years, visioning has become popular in academia, the public sector, and industry (Cornish Citation2004). In practice, visioning manifests as a semi-structured individual or group discussion on desirable futures, with in-depth conversations key to uncovering diverse perspectives (Cornish Citation2004). However, visioning is rarely applied to food-systems research (Mangnus et al. Citation2019), with no existing protocol for urban food systems. We contribute a protocol to fill this gap. The protocol elicits values as priorities, identified from inductive analysis as the visioning process encourages value statements to come directly from the community participants during data collection (Franco-Trigo et al. Citation2019; Soria-Lara and Banister Citation2017). This reveals one of the challenges of visioning – the process elicits a broad range of values reflective of the group of participants, without identifying the values most important to subgroups. We see this as a strength of the method when used to inform further analysis, therefore, we recommend visioning be used in conjunction with another method that will lead to prioritization within the results, such as Q-methodology.
Developed by William Stephenson, the goal of Q-methodology is to explore subjectivities within groups using factor analysis (Stephenson Citation1953). Q-methodology identifies a set of value statements and then engages individuals in ranking the statements from most to least important using a sorting template that prompts discussion, yielding qualitative data to contextualize ranking choices (Brodt, Klonsky, and Tourte Citation2006). The rankings are analyzed with statistical software and put into groups, or factors, representing unique perspectives via the average ranking of each value for a cluster of participants (Stephenson Citation1953). One of the key benefits of Q-methodology is that it can be used in diverse contexts to study a wide range of concepts such as values, opinions, viewpoints, goals, and perspectives (Sneegas et al. Citation2021) and while it has been used to study agriculture (i.e., Brodt, Klonsky, and Tourte Citation2006; Pereira et al. Citation2016) it has rarely been used to investigate urban food systems (cf. Piso et al. Citation2019). In our case, values as priorities from the visioning are presented as statements and factors are defined by clusters of participants that rank specific values as, especially high or low priorities. Since communities never have one distinct vision for their future, methods that identify and prioritize sets of values allow planners to consider innovations that address the needs of multiple groups.
Case-study overview
Located in Southeastern Michigan, Flint is home to about 100,000 people with a poverty rate of 38.8% (United States Census Bureau Citation2019). Due to city-wide demonstrated need, all of Flint’s school-age children are automatically enrolled in the Federal Free and Reduced School Lunch Program, which also provides breakfast daily (Flint Community Schools Citation2020). The closure of many major grocery chains within the city left few easily accessible healthy food options for residents, who have seen convenience stores proliferate in recent decades (Shaver et al. Citation2018). These examples indicate the food system is not in a desirable state and are illustrative of larger problems with food insecurity that plague many post-industrial Rust Belt cities in the United States and elsewhere. Flint gained national attention for the Flint Water Crisis, a human-caused disaster resulting from a switch from Detroit City water to the Flint River on April 25, 2014. Enacted by a non-elected Emergency Manager, water was no longer properly treated which resulted in the systematic poisoning of residents as they were exposed to high concentrations of lead and bacteria (Hanna-Attisha et al. Citation2016). As a result, Flint community members report low levels of trust in government and external agencies, and these experiences shape how residents think about the food system today.
Methods
This work supports a larger project to involve Flint community members in a study of the food system to identify leverage points for enacting positive change. As a community-engaged project, our research is guided by a Community Consultative Panel (CCP) made up of representatives from nonprofit organizations, community activists, and faith-based leaders working in the Flint food system. The CCP provides guidance to ensure the wider project benefits community members and that resulting data are available to support change. Multiple opportunities for community feedback were built into the research design.
Combining visioning with Q-methodology prevents key weaknesses from using each method in isolation. When used together, visioning and Q-methodology harness the benefits of qualitative and quantitative data analysis to produce a set of food-system visions that is representative of community needs and priorities.
We recommend a case study research design as while case-study research is not representative of the whole population, it allows for a more concrete understanding of values as priorities within stakeholder groups providing critical context for analyzing quantitative data. outlines our mixed methods approach. All methods and procedures outlined were approved by Michigan State University’s Institutional Review Board (IRB) and the Flint Community Ethics Review Board (CERB).Footnote1 Participants were asked to give written consent before every data-collection activity. Activities were audio-recorded, and each participant’s contributions were confidential. Focus group and interview data are confidential and given the sensitivity of these data and IRB requirements, raw data are not publicly available. The quantitative Q-sort data is available through Open Data Flint.Footnote2
Figure 1. The mixed method approach has four main phases – implementation and analysis for both the visioning and Q-methodology.
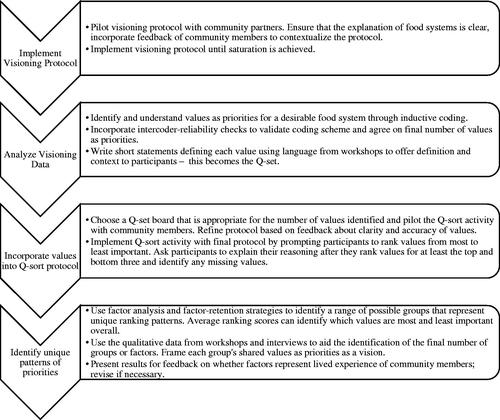
Implementation and analysis of visioning
The visioning protocol was implemented through a series of one-hour workshops with up to ten people. We developed a novel visioning protocol (see and Appendix 1) based on the structure of work applied in urban contexts, specifically those presented by the City of Portland, Oregon (City of Portland Citation2007) and Elkins, Bivins, and Holbrook (Citation2009). Our design uses FAO’s (Citation2002) definition of food security and is tailored for food-system research drawing on Ericksen’s (Citation2008) food-system activities – production, distribution, and consumption (we did not include processing given the lack of this activity in Flint). Our protocol was piloted with seven CCP members in February 2019 and revised based on their feedback to clarify language.
Table 1. Visioning protocol with sections related to the whole system and specifically related to production, distribution, and consumption activities.
To ensure a range of perspectives from within the Flint food system, the CCP identified important groups in line with our non-probabilistic, snowball-sampling strategy. The largest number of participants in our sample represented the consumption sector, given that in urban food systems most food is produced outside of the city (Goldstein et al. Citation2017). Important subgroups of consumers, according to the CCP, were parents, the Latinx community, seniors, and neighborhood leaders. For the parent workshops, participants were recruited through the same kindergarten-to-12th grade family program. Two workshops with parents were held to accommodate scheduling differences among participants. Participants from the senior groups were recruited through a local senior center. Neighborhood leaders were recruited from two city-wide neighborhood organizations. Participants across consumer subgroups represented a balance of Black and white participants that reflect the demographics of Flint. The Latinx community is traditionally underrepresented in research in Flint and so we specifically recruited at a local community center for a standalone workshop. Participants representing the distribution and production sectors were recruited from local nonprofits, churches, and food pantries. outlines the eight workshops held between May and September 2019: six workshops for participants representing consumption and two for production and distribution (jointly), with 44 participants in total. Saturation was achieved after conducting eight workshops (Bernard Citation2012).
Table 2. We held eight workshops, mostly representing consumer subgroups given the balance of food system activities in urban contexts.
The qualitative data were analyzed through inductive coding (Bernard Citation2012) in MAXQDA, with codes reflective of values as priorities assigned directly to the audio files. The inductive nature of the coding process is an important aspect of our overall approach to visioning and the grounded theory approach (Creswell and Miller Citation2000) allowed for the values as priorities to emerge directly from discussions among community members to create the concourse (as per nearly 60% of Q-methodology studies in environmental sustainability literature, although the inductive approach is less common (Sneegas et al. Citation2021)). Further iterative coding produced a list of 15 values as priorities and accompanying explanatory statements using the phrasing of community members to form the Q-set.
Implementing and analysis of the Q-methodology
The protocol for the Q-sort activity was piloted with five CCP members and adjusted based on their feedback. Q-sort refers to the specific sorting activity used in this context to explore values as priorities, while Q-methodology describes the study of perspectives or viewpoints, often using a sorting activity and factor analysis. After piloting the sorting exercise, participants split one value into two for clarity, adding the value of proximity to more accurately represent the nuanced concerns expressed originally as a convenience. This process led to 16 values as priorities and our use of a 16-tile Q-sort board for the main data collection.
Q-sort participants were recruited using convenience sampling from many of the same groups originally suggested by the CCP. However, there was no overlap between participants who engaged in the visioning workshop and Q-sort. While this is not the norm in Q-methodology, given the preferred research outcomes of our community partners (to explore food systems that will leverage community members out of food insecurity) and the large population size in Flint, we intentionally only recruited food-insecure consumers. Our approach allowed us to focus on ensuring we understood the nuanced prioritization of values as priorities among food-insecure households, to avoid (re)creating structures that perpetuate food insecurity in the resulting visions. Participants were recruited at two food- and water-distribution sites, a weekly community meal at a local church, and a farmers’ market.
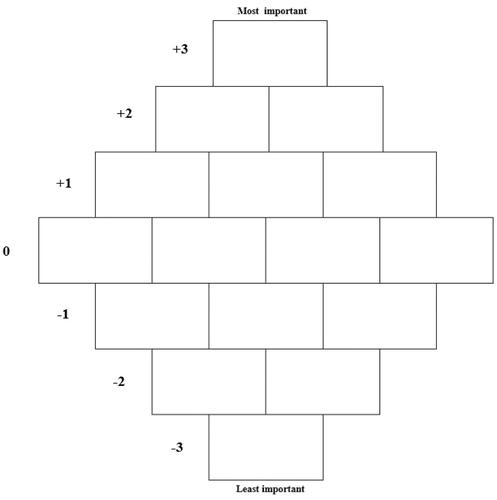
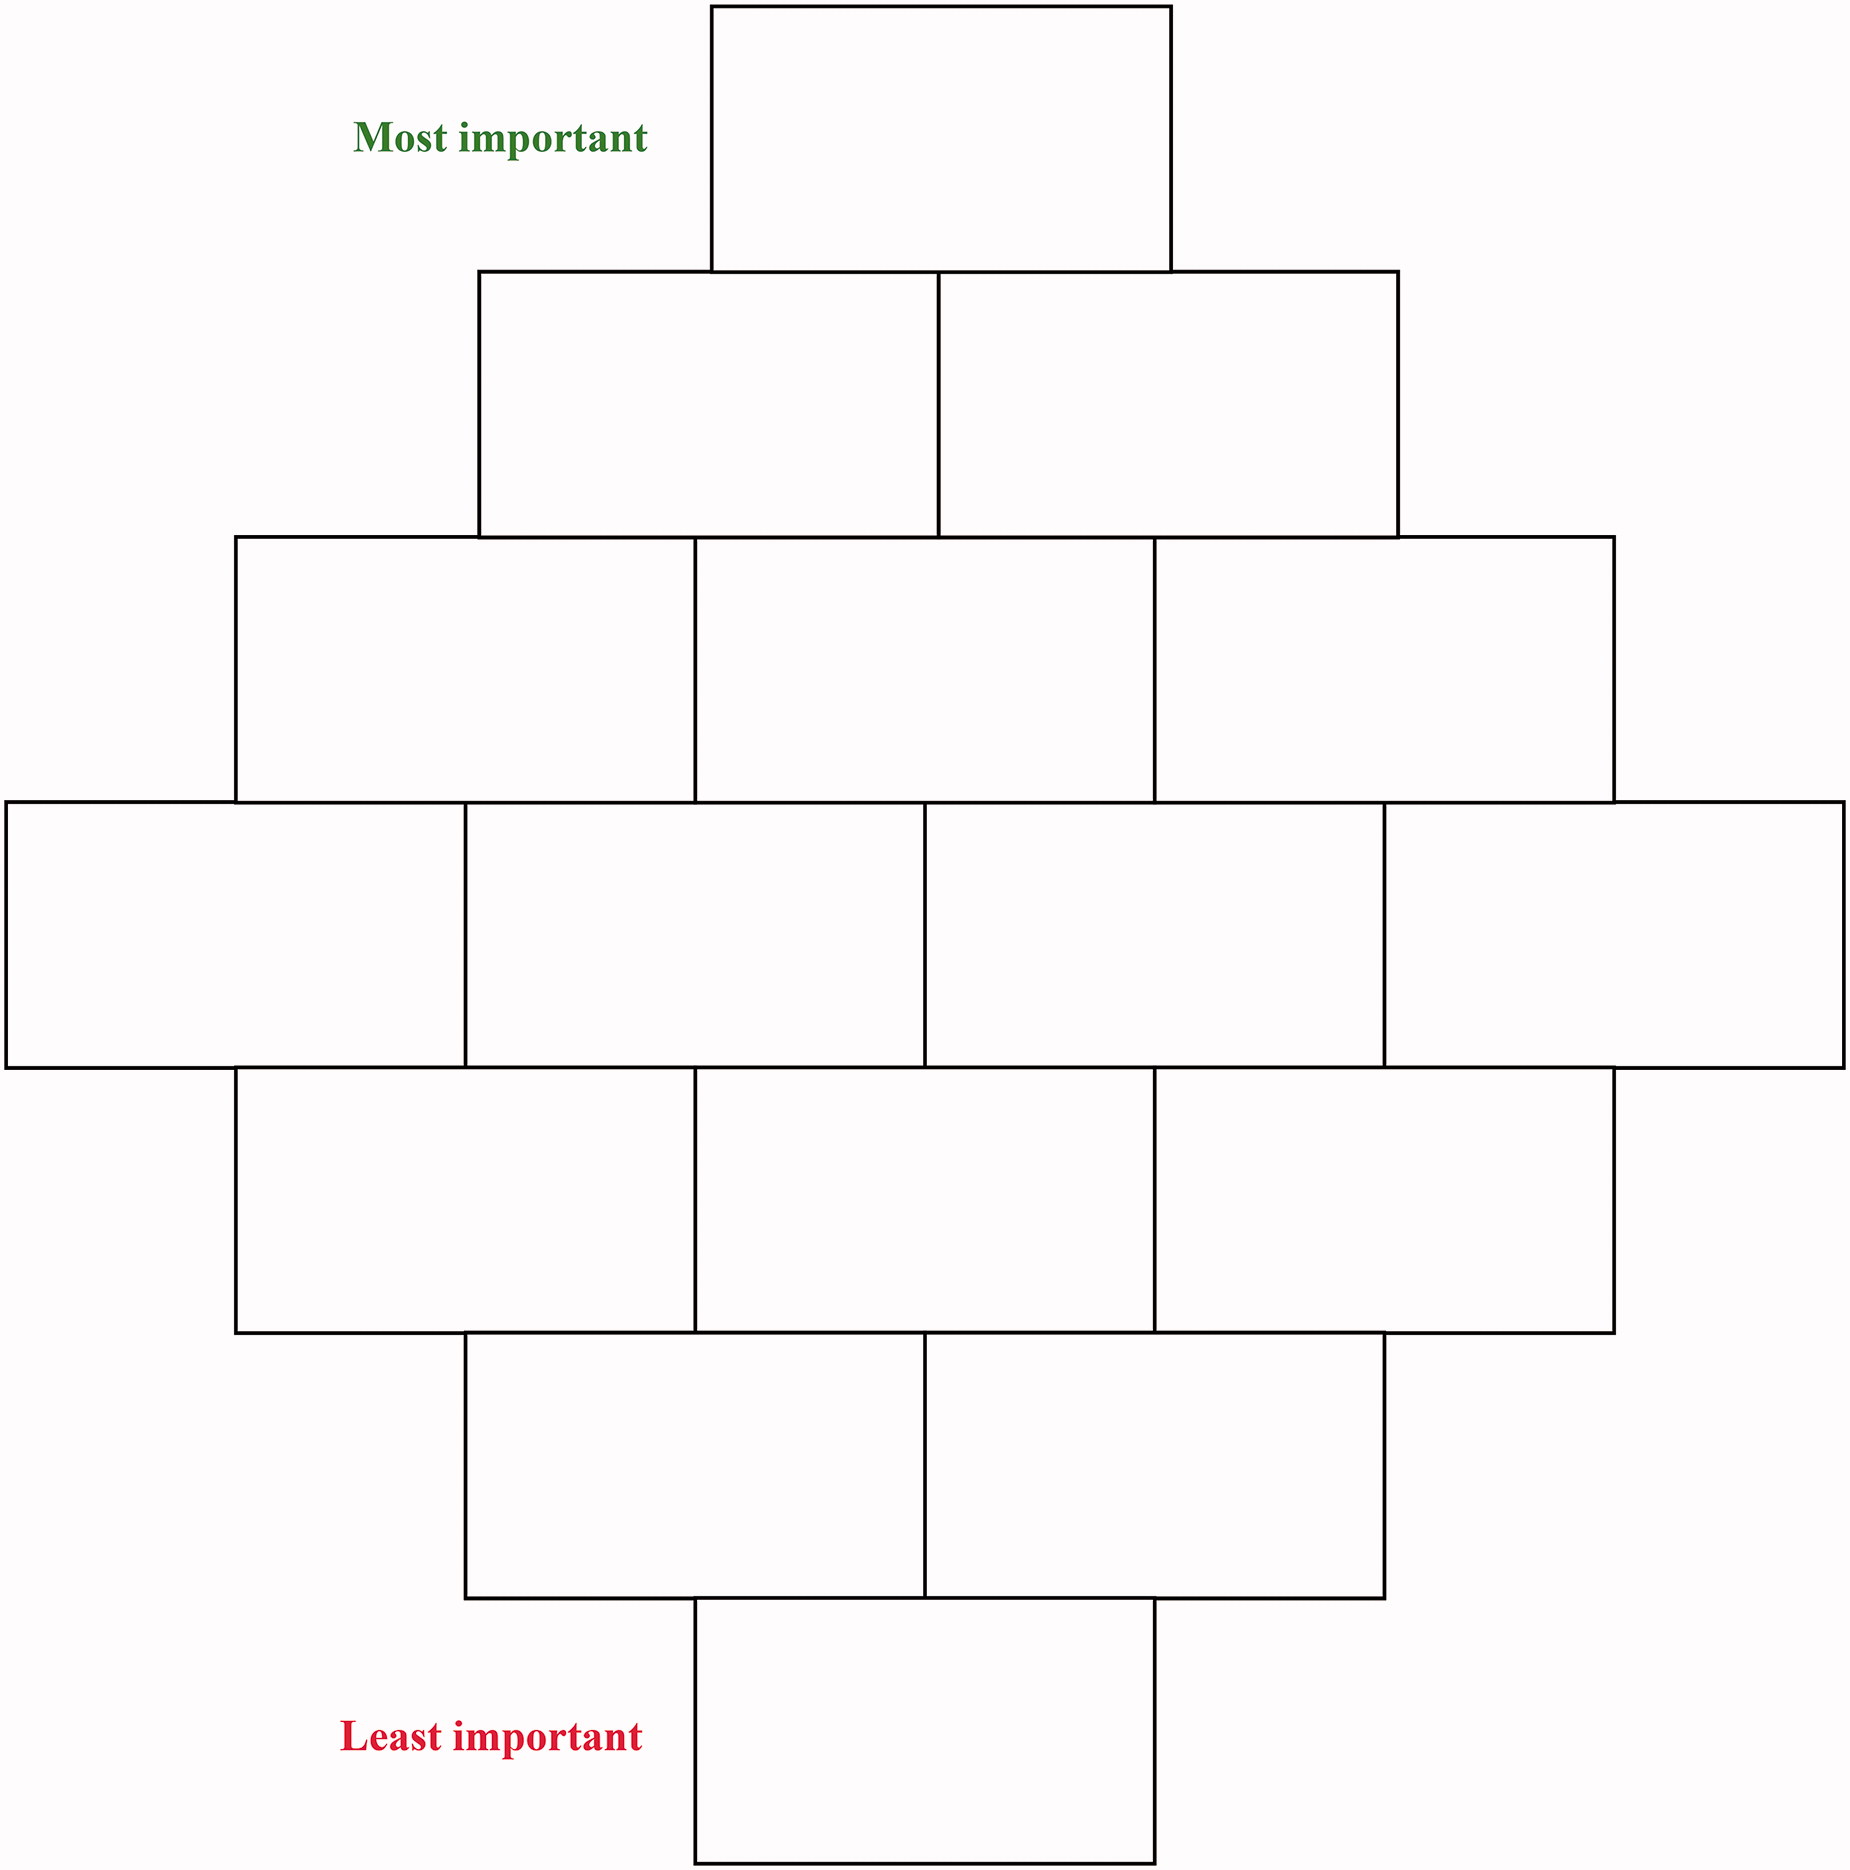
Participants first learned how we conceptualize food systems and values as priorities to establish baseline terminology, before being presented with the 16 values as priorities and accompanying statements on index cards. Next, they were asked to rank the values by arranging the index cards on a physical Q-set board, as shown in . Values that represented the highest priorities went on the top and were ranked in descending order according to importance, subjectively assigned by each participant. Each row was associated with a numerical score, labeled on the left side. Finally, 10–15 minute interviews were conducted where participants explained their rationale for choosing the three top- and bottom-ranked values as priorities. Participants were also asked to point out any values that were confusing, difficult to rank, or if they felt there were critical values not presented. Thus, each participant produced quantitative and qualitative data. Several aspects of this study reflect the setting of Flint. How the Water Crisis was created and mismanaged fostered mistrust within Flint, especially toward government organizations, outsiders, and researchers. This led to hesitation to be audio-recorded in semipublic spaces where Q-sort interviews took place. Overall, recruitment efforts were challenged by many residents’ hesitation to be a part of the research, which stemed from the larger problem of mistrust and the legacy of harm within the community. Data collection took place between January and March 2020 and included 25 participants, all representing the consumption sector.
Figure 2. The 16 tile Q-set board presented to participants.
Quantitatively, for every completed Q-sort, each ranked value was translated into a score ranging from +3 to −3 based on its position on the board. These scores were inputs for the statistical analysis and led to a range of outputs (means, z-scores, and factor loadings) for a designated number of factors. This study employed a Fortran-based software called PQMethod. The software extracts unrotated factors through principal component analysis and then factors were rotated using Varimax rotation, a common approach in Q-methodology to maximize explained variance (Sneegas et al. Citation2021). The qualitative data collected, primarily sets of handwritten notes and audio recordings, were analyzed in MAXQDA to provide context for the factors that emerged during quantitative analysis. These data were analyzed deductively for the 16 values as priorities using a codebook mimicking the structure of the Q-sort protocol. The coding occurred directly on the audio files and scanned images of notes. Additionally, we coded any confusion or questions about the meaning of values expressed by participants. The goal of this analysis was to identify patterns in why participants ranked certain values as high or low priorities. This context revealed how participants conceptualized key problems in the food system and how values related to each other.
Ultimately, three unique factors were extracted from the data, representing three groups of participants with similarly ranked priorities that we framed as a shared vision for a desirable food-system future. This determination was made from both quantitative and qualitative considerations as directed by Q-methodology literature (Brown Citation1996; Sneegas et al. Citation2021; Watts and Stenner Citation2005). Sneegas et al. (Citation2021) identify six commonly used factor-extraction criteria and recommend using multiple – we used five. An analysis of factor loadings based on a significance of 0.05 indicated that the minimum threshold of Q-sorts (at least two) loaded onto each factor until eight factors were analyzed, satisfying Humphrey’s Rule I (Sneegas et al. Citation2021; Watts and Stenner Citation2012). That is, the analysis yielded significant results in up to eight-factor groupings, based on the multipliers associated with each significance level (Van Exel and De Graaf Citation2005). We carried out a scree plot analysis and also examined the eigenvalues as per the Kaiser–Guttman criterion to identify those >1, the latter similarly supporting eight factors (eigenvalue for three factors was 3.2704). We then examined variance, looking for a solution that accounted for over 50% of the variance with each factor accounting for at least 10% of total variance – three factors represented 49% of the cumulative explained variance and four factors represented 58%. Finally, after considering the qualitative patterns and subjective meaning from the ranking interviews, we determined three factors best represented the data. Specifically, participants were able to discuss how and why each value was important to them and to explain how the values connect to each other in a way that aligned best with three factors. Although three factors did not quite reach the 50% threshold, each individual factor surpassed 10% (19%, 15%, and 15%) and while a lower explained variance indicates a large distinction in viewpoints it does not undermine the significance of the selected number of factors because Q-methodology is not solely concerned with how representative each factor is to the population in question.
The qualitative and quantitative factor-retention process, therefore, resulted in the identification of three unique factors. The analysis resulted in a factor matrix that illustrated which sorts significantly defined each factor group, as shown in , based on a pre-flagging algorithm within PQMethod to select only pure cases “where the factor explains at least half of the common variance and the correlation with the factor is significant at the .05 level” (Ramlo Citation2008, 2). The closer the value is to one, the more equivalent the Q-sort is to the factor. An X marks a Q-sort loading significantly on one factor.
Table 3. Factor matrix with the factor loadings, which indicate the degree to which each Q-sort correlates with each of the three emerging factors (X indicates significance).
Limitations
One limitation of this study was the lack of representation in the sample from the retail sector, a key component of Ericksen’s (Citation2008) food-system structure. We attempted several workshops with retailers but ultimately had just one attendee as corporate policy constrained some potential participants associated with large retail chains from engaging. Therefore, visions from the retail sector are not represented here and those representing the retail sector may have diverging values.
Data collection for the Q-sort activity was cut short at 25 participants due to the COVID-19 pandemic. The sample size for the Q-sort was originally targeted at 30–60 participants, as is typical for studies in Q-methodology (Van Exel and De Graaf Citation2005). To address any impacts on data quality, validity checks were used to confirm the results accurately represented community values, including intercoder reliability during inductive coding of workshop conversations and repeated feedback from CCP members. Furthermore, each dataset garnered in this process triangulates previous results.
Results
Visioning results
The final analysis of visioning workshop data resulted in 16 values and statements reflecting participants’ priorities for a desirable food system, described in .
Table 4. Sixteen final values were identified from the visioning workshops, presented here in alphabetical order with an accompanying statement.
Affordability directly refers to the price of food. Several participants mentioned that they drove outside the city to find cheaper prices in large grocery stores. Comfort and safety refer to experiences obtaining food and reflect the ability to engage in the food system without feeling vulnerable to racial discrimination, sexual harassment, or hate crimes. This value was especially important to women and Black and Latinx participants. Common good indexes a value that all people are deserving of sufficient, quality food regardless of income level. The value of convenience was especially important to parents who explained time constraints frame how they interact with the food system, necessitating convenient, often prepared, food options. Economic justice refers to development in Flint that benefits the community because of a just distribution of profits from growth within the food system. In contrast, economic opportunity reflects the desire for more job opportunities within the food system. Educational values emerged from participants’ interest in learning about food, specifically regarding nutritional literacy, and in learning cooking, gardening, and canning skills. The feeling of the community reflects participants’ desire for a sense of connectedness and community within the food system. Food diversity marks a desire for a wide variety of food options, particularly culturally significant food. Food waste describes participants’ priority for minimizing discarded food. The value of fresh and natural food represents a preference for food without additives, or whole foods, rather than heavily processed foods. Health indicates a desire for foods with high nutritional value and was often connected to the desire for lead-mitigating foods promoted by public health officials in the wake of the Water Crisis. Local food represents participants’ preference for food that comes from within or around Flint. Participants also considered Michigan-produced foods to be local. Tradition marks cultural, religious, or familial patterns of engagement with food and often includes food-centered celebrations. Finally, the priority of urban agriculture reflects participants’ interest in engaging in either personal or community gardens within Flint.
The distribution of values across workshops is understood by frequency of occurrence and percentage of the audio file coded by each value. Convenience and health were discussed in all eight workshops. Food diversity, education, and fresh and natural food were mentioned in seven workshops. Affordability, common good, and feeling of the community were mentioned in six workshops. Comfort and safety, economic justice, economic opportunity, food waste, local food, proximity, tradition, and urban agriculture were mentioned in five workshops. The variation is likely related to the size of the workshops. For example, two of the workshops (Neighborhood Leaders and Distribution – Food Assistance Programs) only had one participant representing a singular perspective on the food system. Larger groups with greater diversity may generate a more in-depth discussion about some of the topics included in the protocol. Overall, more detailed data were collected from larger workshops.
Q-methodology results
outlines the average scores for values in the ranking exercise and demonstrates that the highest-ranked values were health, fresh and natural food, and affordability. The qualitative data revealed that health, the highest-ranking value, was important to participants because it forms the foundation for a desirable food system. That is, other benefits of the food system require first achieving health. As one participant expressed, “You can’t do nothing without your health.” We expect participants’ values and ranking patterns to reflect the political and cultural context; participants’ concern with health may be motivated by public concerns related to the Water Crisis – residents consider a healthy diet an important tool in combating the effects of elevated blood-lead levels. This may also explain why fresh and natural food was highly ranked – participants view these alternatives as healthy options. Additionally, participants connected fresh and natural foods to food safety, indicating that food with fewer additives is safer to eat. Affordability was ranked highly due to the financial barriers cited by participants and was often ranked on the second level of importance and referred to in relation to another value. For example, participants were concerned about the affordability of healthy food options.
Table 5. Average scores for each of the values in the ranking exercise.
The lowest-ranked values were tradition, feeling of community, food waste, and the common good. Some participants felt that tradition could be used as a justification to carry on unhealthy food-related habits. One participant explained “I feel like we need to advance,” then described needing a willingness to abandon harmful habits even if they are seen as important traditions. The feeling of community was ranked low for several participants because they either felt that it had already been achieved in the food system or that a sense of community did not fit in a desirable future based on personal preferences. Food waste was ranked low because participants did not generally view it as a major concern in the Flint food system. One participant stated, “We don’t waste our food” reflecting a common sentiment that there is still not enough food for everyone in the Flint food system. Finally, some participants explained that the common good was a low priority simply because they held other priorities higher, while others considered the value as contradictory to other food-system priorities. For example, one participant felt that the common good was an unrealistic outcome when considering proximity and affordability, which they argued should be prioritized in the system.
Identifying factors that lead to visions
While our data suggest that participants from different backgrounds often have shared values, a diverse set of patterns in how the values were sorted reflects different combinations of priorities based on participants’ experience in the food system. Below, we characterize the three emerging visions, based on these three factors, which can then be used to inform planning processes to achieve these outcomes. Factor Q-sort values and z-scores are reported after each value and are all significant at p < .05, an asterisk (*) indicates significance at p < .01.
Vision 1: a food system with healthy foods that residents are educated about and willing to travel for
Participants in Vision 1 ranked health (3, 1.98*), fresh and natural food (2, 1.61*), and education (2, 0.78*) as high priorities while simultaneously ranking common good (–2, 0.92*) and proximity (–3, −2.14*) as low priorities. While participants in the overall sample also prioritized health and fresh and natural food, it is important to note why these two values appeared together for this factor grouping and are defining features of this vision due to their high z-scores. The qualitative data from this group indicate that both values are highly ranked because participants view them as interconnected concepts. One participant noted, “[Fresh and natural foods] actual cuts down on health risks.” Another participant expressed a similar viewpoint, “Natural foods and fresh foods [are] mostly the healthiest foods for us.” Therefore, health may be the motivating value behind a high ranking of fresh and natural food. Another characterizing feature of Vision 1 is a low ranking of proximity. While participants recognized the lack of grocery stores in Flint as a problem, they indicated that public transportation was an acceptable solution to overcoming these challenges. One participant explained the following sentiment in describing proximity ranking, “You do what you gotta do, I mean, there are buses.” This opinion stands in contrast to how other participants in Vision 2 described transportation challenges.
Vision 2: a food system with convenient, fresh food options for those who cannot travel
Participants that sorted into Vision 2 ranked proximity (3, 1.65*), fresh and natural food (1, 0.85*), and convenience (1, 0.54*) as top priorities and ranked education (–1, −0.97*) and food waste (–3, −1.55*) on the bottom. Interestingly, proximity is ranked as a low priority in Vision 1, while education and food waste are the lowest priorities in Vision 2 indicating that participants across these groups shared polarizing views regarding these values. In contrast to participants in Vision 1, the proximity of grocery stores posed a challenge for participants in Vision 2. One participant explained, “[There are] no grocery stores in Flint…a lot of the time I take public transportation for food and public transportation doesn’t go outside of the city.” Another participant remarked on the lack of public transportation, “[P]eople have no transportation [options].” Therefore, while some residents can overcome challenges associated with not having grocery stores within close proximity to their residences (Vision 1), others (Vision 2), are unable to easily or reliably travel outside of the city for food. Convenience refers to the ease of preparing food and may be motivated by having a lack of time and or resources to dedicate to making homemade meals. Many participants caring for families expressed the importance of convenient food options but that accessing convenient food based on fresh and natural food was difficult in the city. Participants who ranked food waste as a low priority cited that they felt that food scarcity was more of a problem than food waste.
Vision 3: a food system that maintains community’s food traditions
Vision 3 is characterized by a high ranking of food waste (3, 1.62*), proximity (2, 1.11*), and tradition (2, 0.75*) and a low ranking of economic justice (–3, −2.03*), economic opportunity (–2, −1.49), fresh and natural food (–1, −0.32*), and education (–1, 0.00*). While the sample overall ranked tradition as a low priority, a high prioritization of tradition was a defining quality of this factor group and indicates further polarization among participants. Participants who ranked tradition highly tended to associate it with family celebrations and gatherings that centered around food. They recalled memories of the foods they eat at family celebrations, and the importance of continuing these rituals. The visioning workshops provided context for the high value linking of tradition and food waste because practices surrounding food waste may be connected to cultural traditions. For example, participants in the Latinx workshop noted minimizing food waste is a feature of their cultural approach to using food. Therefore, a high ranking of tradition and food waste together further illustrates how our data and results triangulate. Participants with this vision shared similar sentiments about prioritizing proximity to those in Vision 2 but perhaps more specifically would like traditional foods to be accessible within proximity. The other unique feature of this vision is a low ranking of economic justice, economic opportunity, and education. Participants cited that these values were not unimportant but ranked as a low priority because of how important they felt every other value was in comparison.
Discussion
Differing priorities among consumers are especially apparent when considering the values of proximity, food waste, and tradition – each of which inspired polarizing responses from participants. Those who sorted tradition as the lowest priority were concerned that customary practices surrounding food can sometimes be harmful or unhealthy, while those who prioritized tradition recognized the importance of food-centered celebrations and rituals. Therefore, differing opinions on tradition in the food system are likely motivated by personal experiences (both positive and negative) surrounding food traditions and the concern that tradition might be practiced at the expense of another priority, most notably health. Polarizing views on food waste and proximity are tied to contradicting ideas about how to increase food security. Several participants ranked minimizing food waste as a bottom priority because they argued there is not enough food physically available in Flint. Our workshop data implied a contradictory situation as many food-assistance providers described an abundance of food going to waste at food-distribution sites.
Participants also reported differing views on whether proximity to stores is a significant problem in Flint. Popular discourse in the literature surrounding “food deserts” cites the absence of grocery stores as a major barrier to access to healthy food (e.g., Walker, Keane, and Burke Citation2010). This sentiment is further evidenced by participants in both visioning workshops and Q-sort interviews directly identifying Flint as a food desert. However, research by Alkon et al. (Citation2013) shows that supply-focused solutions to food access that rely on reintroducing large grocery stores to food-insecure areas are often ineffective. Their study demonstrated that proximity to grocery stores, while important, does not necessarily affect consumer behavior enough to significantly influence the accessibility or consumption of high-quality, healthy foods (Alkon et al. Citation2013). Our data, specifically polarization of the value of proximity, echoes Alkon et al.’s findings that consumer preferences for cheaper, fresher food are often more influential than the proximity of grocery stores, and that proximity is a more nuanced challenge than merely adding in major chain-store locations. The value of proximity also elicits a polarizing response based on whether participants utilize public transportation to access food. Additionally, there were unsuccessful examples of past attempts to introduce stores within the city, most notably the re-opening and closing of Hamady Brothers in 2017 and 2018, respectively.
Conclusion
Our methodological approach included both qualitative and quantitative methods to achieve a holistic understanding of desirable futures for the Flint food system. Methodologically, this is a novel protocol for visioning in urban food systems. Our case study in the city of Flint parallels many food-system challenges of other American cities experiencing deindustrialization, especially in the Rust Belt of the United States, therefore, the methods delineated in this article can be used by other scholars and practitioners interested in investigating desirable food systems in other cities without major adaptation. Additionally, the structure can be maintained but the content modified for rural communities or food systems in other countries. We also highlight how to account for the cultural nuance expected in participatory research. The deployment of participatory methods is especially beneficial for long-term projects by providing multiple opportunities for community engagement and empowerment and is essential for the successful adaptation of new interventions.
Our research offers a possible interpretation of why “silver bullet” approaches, such as adding a grocery store, can fail to achieve meaningful gains in food security. Through the identification of three distinct patterns of priorities in Flint, we reaffirm that there is not a single experience of food insecurity and thus not a singular vision for its desirable food system. Therefore, there can be no “silver bullet” solution because no one intervention will address the needs and values of all food-system actors – our approach recognizes the need for multiple points of intervention for decision makers to use to address food insecurity in cities and identifies multiple areas to target. To achieve more equitable outcomes in food security and nutritional outcomes in Flint, different groups will need different combinations of solutions such as proximate stores to access healthy food, greater education about nutrition, the shift in the degree of processing in “fast food,” and culturally appropriate foods within the neighborhood. Investing in these visions does not make any other group worse off – by providing a novel mixed-methods approach to understand how values as priorities from diverse groups within a food system align and differentiate, we can inform pluralistic pathways to desirable futures that address inequities in our food systems.
Acknowledgments
We especially thank members of the Flint community who shared their insights and time, and the members of the Community Consultative Panel who assisted in this research by participating in pilot exercises and offering feedback on data collection and results. We would also like to thank our broader research team colleagues, the members of the Flint Leverage Points Project. Finally, thanks to the two anonymous reviewers for their helpful critique.
Disclosure statement
No potential conflict of interest was reported by the author(s).
Additional information
Funding
Notes
1 Michigan State University Study ID STUDY00002899) on July 17, 2019 determining the project to be exempt under 45. CFR 46.101(b) and Michigan State University Study ID STUDY00003892) on January 23, 2020 determining the project to be exempt under 45 CFR 46.104(d) 2(ii).
2 ICPSR Project ID: odf -151421
Related Research Data
References
- Alkon, A., D. Block, K. Moore, C. Gillis, N. DiNuccio, and N. Chavez. 2013. “Foodways of the Urban Poor.” Geoforum 48: 126–135. doi:10.1016/j.geoforum.2013.04.021.
- Bernard, R. 2012. Social Research Methods: Qualitative and Quantitative Approaches. 2nd ed. Thousand Oaks, CA: Sage.
- Brodt, S., K. Klonsky, and L. Tourte. 2006. “Farmer Goals and Management Styles: Implications for Advancing Biologically Based Agriculture.” Agricultural Systems 89 (1): 90–105. doi:10.1016/j.agsy.2005.08.005.
- Brones, A. 2018. “Karen Washington: It’s Not a Food Desert, It’s Food Apartheid.” Guernica, May 7. https://www.guernicamag.com/karen-washington-its-not-a-food-desert-its-food-apartheid/
- Brown, S. 1996. “Q Methodology and Qualitative Research.” Qualitative Health Research 6 (4): 561–567. doi:10.1177/104973239600600408.
- Budzynska, K., P. West, R. Savoy-Moore, D. Lindsey, M. Winter, and P. Newby. 2013. “A Food Desert in Detroit: Associations with Food Shopping and Eating Behaviours, Dietary Intakes and Obesity.” Public Health Nutrition 16 (12): 2114–2123. doi:10.1017/S1368980013000967.
- City of Portland. 2007. Voices from the Community: The VisionPDX Community Input Summary (Abridged Version). Portland, OR: City of Portland. http://www.visionpdx.com/downloads/visionPDX%20CIS%20Abrdg%20Versi.pdf.
- Coleman-Jensen, A., M. P. Rabbitt, C. A. Gregory, and A. Singh. 2021. Household Food Security in the United States in 2020. USDA-ERS Economic Research Report (298).
- Corcoran, M. 2021. “Beyond ‘Food Apartheid’: Civil Society and the Politicization of Hunger in New Haven, Connecticut.” Urban Agriculture and Regional Food Systems 6: e20013 doi:10.1002/uar2.20013.
- Cornish, E. 2004. Futuring: The Exploration of the Future. Chicago: World Future Society.
- Creswell, J. W., and D. L. Miller. 2000. “Determining Validity in Qualitative Inquiry.” Theory into Practice 39 (3): 124–130. doi:10.1207/s15430421tip3903_2.
- Dietz, T., A. Fitzgerald, and R. Shwom. 2005. “Environmental Values.” Annual Review of Environment and Resources 30 (1): 335–372. doi:10.1146/annurev.energy.30.050504.144444.
- Elkins, L., D. Bivins, and L. Holbrook. 2009. “Community Visioning Process: A Tool for Successful Planning.” Journal of Higher Education Outreach and Engagement 13 (4): 75–84.
- Ericksen, P. 2008. “Conceptualizing Food Systems for Global Environmental Change Research.” Global Environmental Change 18 (1): 234–245. doi:10.1016/j.gloenvcha.2007.09.002.
- Flint Community Schools. 2020. District, About Us. Flint, MI: Flint Community Schools. https://www.flintschools.org/apps/pages/index.jsp?uREC_ID=448588&type=d&pREC_ID=967426
- Franco-Trigo, L., J. Tudball, D. Fam, S. Benrimoj, and D. Sabater-Hernández. 2019. “A Stakeholder Visioning Exercise to Enhance Chronic Care and the Integration of Community Pharmacy Services.” Research in Social and Administrative Pharmacy 15 (1): 31–44. doi:10.1016/j.sapharm.2018.02.007.
- Ghosh-Dastidar, B., D. Cohen, G. Hunter, S. Zenk, C. Huang, R. Beckman, and T. Dubowitz. 2014. “Distance to Store, Food Prices, and Obesity in Urban Food Deserts.” American Journal of Preventive Medicine 47 (5): 587–595. doi:10.1016/j.amepre.2014.07.005.
- Ghosh-Dastidar, M., G. Hunter, R. Collins, S. Zenk, S. Cummins, R. Beckman, A. Nugroho, J. Sloan, L. Wagner, and T. Dubowitz. 2017. “Does Opening a Supermarket in a Food Desert Change the Food Environment?” Health & Place 46: 249–256. doi:10.1016/j.healthplace.2017.06.002.
- Goldstein, B., M. Birkved, J. Fernandez, and M. Hauschild. 2017. “Surveying the Environmental Footprint of Urban Food Consumption.” Journal of Industrial Ecology 21 (1): 151–165. doi:10.1111/jiec.12384.
- Hanna-Attisha, M., J. LaChance, R. Sadler, and A. Champney Schnepp. 2016. “Elevated Blood Lead Levels in Children Associated with the Flint Drinking Water Crisis: A Spatial Analysis of Risk and Public Health Response.” American Journal of Public Health 106 (2): 283–290. doi:10.2105/AJPH.2015.303003.
- Lincoln, N., and N. Ardoin. 2016. “Cultivating Values: Environmental Values and Sense of Place as Correlates of Sustainable Agricultural Practices.” Agriculture and Human Values 33 (2): 389–401. doi:10.1007/s10460-015-9613-z.
- Mangnus, A., J. Vervoort, S. McGreevy, K. Ota, C. Rupprecht, M. Oga, and M. Kobayashi. 2019. “New Pathways for Governing Food System Transformations: A Pluralistic Practice-Based Futures Approach Using Visioning, Back-Casting, and Serious Gaming.” Ecology and Society 24 (4). doi:10.5751/ES-11014-240402.
- Pereira, M., J. Fairweather, K. Woodford, and P. Nuthall. 2016. “Assessing the Diversity of Values and Goals Amongst Brazilian Commercial-Scale Progressive Beef Farmers Using Q-Methodology.” Agricultural Systems 144: 1–8. doi:10.1016/j.agsy.2016.01.004.
- Piso, Z., L. Goralnik, J. Libarkin, and M. Lopez. 2019. “Types of Urban Agricultural Stakeholders and Their Understandings of Governance.” Ecology and Society 24 (2): 18. doi:10.5751/ES-10650-240218.
- Ramlo, S. 2008. “Determining the Various Perspectives and Consensus within a Classroom Using Q Methodology.” AIP Conference Proceedings 1064 (1): 179–182. doi:10.1063/1.3021248.
- Schwartz, S. 2012. “An Overview of the Schwartz Theory of Basic Values.” Online Readings in Psychology and Culture 2 (1): 1–20. doi:10.9707/2307-0919.1116.
- Scoones, I., A. Stirling, D. Abrol, J. Atela, L. Charli-Joseph, H. Eakin, A. Ely, et al. 2020. “Transformations to Sustainability: Combining Structural, Systemic and Enabling Approaches.” Current Opinion in Environmental Sustainability 42: 65–75. doi:10.1016/j.cosust.2019.12.004.
- Shaver, E., R. Sadler, A. Hill, K. Bell, M. Ray, J. Choy-Shin, J. Lerner, T. Soldner, and A. Jones. 2018. “The Flint Food Store Survey: Combining Spatial Analysis with a Modified Nutrition Environment Measures Survey in Stores (NEMS-S) to Measure the Community and Consumer Nutrition Environments.” Public Health Nutrition 21 (8): 1474–1485. doi:10.1017/S1368980017003950.
- Sneegas, G., S. Beckner, C. Brannstrom, W. Jepson, K. Lee, and L. Seghezzo. 2021. “Using Q-Methodology in Environmental Sustainability Research: A Bibliometric Analysis and Systematic Review.” Ecological Economics 180: 106864. doi:10.1016/j.ecolecon.2020.106864.
- Soria-Lara, J., and D. Banister. 2017. “Participatory Visioning in Transport Backcasting Studies: Methodological Lessons from Andalusia (Spain).” Journal of Transport Geography 58: 113–126. doi:10.1016/j.jtrangeo.2016.11.012.
- Stephenson, W. 1953. The Study of Behavior; Q-Technique and its Methodology. Chicago, IL: University of Chicago Press.
- Tadaki, M., J. Sinner, and K. Chan. 2017. “Making Sense of Environmental Values: A Typology of Concepts.” Ecology and Society 22 (1): 7. doi:10.5751/ES-08999-220107.
- Tornaghi, C. 2017. “Urban Agriculture in the Food‐Disabling City: (Re)Defining Urban Food Justice, Reimagining a Politics of Empowerment.” Antipode 49 (3): 781–801. doi:10.1111/anti.12291.
- Tornaghi, C., and C. Certoma, eds. 2019. Gardening as Politics. London: Routledge.
- Ulvila, K. 2018. “Good for Nature – Good for You’? Values and Sustainable Food Consumption – Promoting Sustainably Produced Food Products to Finnish Consumers.” Jyväskylä Studies in Business and Economics (188): 1–210. https://jyx.jyu.fi/handle/123456789/57882.
- United Nations Food and Agriculture Organization (FAO). 2002. The State of Food Insecurity in the World 2001. Rome: FAO.
- United States Census Bureau. 2019. U.S. Census Bureau QuickFacts: Flint City, Michigan. Washington, DC: United States Census Bureau. https://www.census.gov/quickfacts/fact/table/flintcitymichigan/IPE120218.
- Van Exel, J., and G. De Graaf. 2005. Q Methodology: A Sneak Preview. https://qmethodblog.files.wordpress.com/2016/01/qmethodologyasneakpreviewreferenceupdate.pdf.
- Walker, R., C. Keane, and J. Burke. 2010. “Disparities and Access to Healthy Food in the United States: A Review of Food Deserts Literature.” Health & Place 16 (5): 876–884. doi:10.1016/j.healthplace.2010.04.013.
- Watts, S., and P. Stenner. 2005. “Doing Q Methodology: Theory, Method and Interpretation.” Qualitative Research in Psychology 2 (1): 67–91. doi:10.1191/1478088705qp022oa.
- Watts, S., and P. Stenner. 2012. “Introducing Q Methodology: The Inverted Factor Technique: Doing Q Methodological Research: Theory.” Method and Interpretation. Thousand Oaks, CA: Sage.
- Zenk, S., A. Schulz, B. Israel, S. James, S. Bao, and M. Wilson. 2005. “Neighborhood Racial Composition, Neighborhood Poverty, and the Spatial Accessibility of Supermarkets in Metropolitan Detroit.” American Journal of Public Health 95 (4): 660–667. doi:10.2105/AJPH.2004.042150.
Appendix 1 – visioning protocol
15 minute|introduction
Our names are [insert names] and we are working on a project based in [insert university/organization] called the [insert project name]. We are working with the [insert community partner] to learn more about the [insert name of community] community’s relationship with food, including:
What does the flow of food look like in [insert name of community] today?
What are the problems with the flows of food in [insert name of community] today?
What would community members like the flows of food to look like in the future, making sure we talk with a diverse range of community members?
What actions can be taken to get to this future?
Thank you for coming today to help us with this work. Perhaps first we can go around and introduce ourselves?
<5 min>
Thank you very much! One way we think about food in [insert name of community]is as a system, thinking about those flows of food and how it connects with the community and people/businesses outside the city – this way it becomes a picture of a set of individual pieces (people and food) working together.
We would like to start with a question: do you tend to think about food as a system? If not, how do you think about food?
<end discussion with clarification of our framing>
Not everyone in this city thinks about food in the same way, as not everyone is involved with food in the same way:
Most of us are consumers – we buy food, either already prepared or from the store to cook with. Something we know about [insert name of community] is that a lot of people struggle with this and rely on food pantries, soup kitchens, etc. to get food.
However, that food has to get to the stores, restaurants, or nonprofits running food pantries etc. Therefore, we have to think about the people and organizations involved in the distribution of food – i.e., how it gets from the producer to you as a consumer.
Finally, we need to think about that production of food. Even in the city, we have people and organizations who are involved in growing produce – i.e., urban agriculture, which can be as a business profit or as an individual in your backyard, or in collective groups and not-for-profit, like community gardens.
The way that we are thinking about a food system is best explained in these three categories: splitting activities and organizations between production, distribution, and consumption. The first stage of our project involves identifying representatives of these three groups who have a role in or are affected by the flow of food in [insert name of community]. We call these people and organizations stakeholders – they all have a stake in the food system, opinions on whether it works at the moment and what the future should look like. We want to make sure we hear the diverse range of perspectives across the food system.
In order to learn more about the food system from your perspectives as representatives of the [insert sector of food system] category, we would like to talk about your vision for the future of the [insert name of community] food system during a visioning activity. We anticipate this will take approximately 1 hour.
The goal of this workshop is to generate discussion about the [insert name of community] food system and develop an understanding of what it looks like today and how it got here. We also want to clarify what a desirable future looks like to you, and what your priorities are for the future. The workshop has potential to connect you to new people in the food system and talk about new ideas and topics that you may have not considered before. The workshop may also increase your understanding of food in [insert name of community]as a system.
Are there any questions about what we are doing today?
We will be compensating each of you for your time today with [insert compensation amount]. I will hand this out at the end of the session. Directions to bathroom, feel free to grab water, snacks etc. at any time.
This form gives us consent to use the things that we talk about to today for research. We will only be sharing our notes and recordings with the research team and your identity will remain confidential to other participants and in any potential publications.
Is everyone ok with us audio recording the conversation?
45 minutes | visioning
5 minutes | evaluation
We would like to end for 5 minutes while you write down your feedback, so we can hone these activities for other groups in the future.
<collect evaluations>
Thank you again for joining us this afternoon. We really appreciate you giving up your time – if you sign this sheet for our accounting purposes, we’ll distribute the compensation for your time. My card is in the packet - please let us know if you have questions or comments!
How to cite this protocol: Belisle-Toler, R., and J. Hodbod. 2019. A Guide to Visioning and Q Methodology in Food Systems. East Lansing, MI: Michigan State University, Department of Community Sustainability. https://www.canr.msu.edu/resources/tool-1-a-guide-to-visioning-and-q-methodology-in-food-systems
Appendix 2 – Q-Sort protocol
Thank you very much for coming today. My name is [insert name] and I am working on a project based in [insert city] called [insert project name]. I am working with the [insert community partner] to learn more about the [insert city] community’s relationship with food. The goal of this interview is to understand how stakeholders in [insert city] prioritize values associated with the food system. The way we are understanding values in this case is as priorities for the food system. I am going to ask you to sort a list of [insert number of values emerging from visioning] values based on what you find the most and least important. I will also be asking you questions as you complete this activity. This process should take approximately 20 minutes.
Do you have any questions about what we are doing today?
This form gives us consent to use the things that we talk about to today for research. I will only be sharing my notes and recordings with the research team and your identity will remain confidential to other participants and in any potential publications.
<consent language>
Are you okay with us audio recording the conversation?
One way we think about food in [insert city] is as a system, thinking about those flows of food and how it connects with the community and people/businesses outside the city – this way it becomes a picture of a set of individual pieces (people and food) working together.
The way that we are thinking about a food system is best explained in these three categories: splitting activities and organizations between production, distribution, and consumption. The first stage of our project involves identifying representatives of these three groups who have a role in or are affected by the flow of food in [insert city]. We call these people and organizations stakeholders – they all have a stake in the food system, opinions on whether it works at the moment and what the future should look like. We want to make sure we hear the diverse range of perspectives across the food system.
Throughout [insert year], several members of our team and I conducted visioning workshops with a diverse array of stakeholders in the [insert city] food system, representing all three sectors. During these workshops, participants were asked to identify their priorities for a desirable future in the [insert city] food system.
Presort Question 1: Which sector of the food system do you identify most closely with?
Pre Sort Question 2, if production or distribution: What is your role in this sector?
While you may be involved in a specific organization that frequently deals with food system issues, please be prepared to sort the values from your own perspective, rather than on behalf of your organization. Of course, it’s expected that your experience will inform how you approach this exercise which is valuable for us to hear about.
Display list of values (let the participant read on their own)
Presort Question 3: Do you have any questions about how to understand any of these values?
Display Q-sort template.
Please rank the values in the order that you deem them most important to your vision for the XX food system. The most important go on the top and the least important go on the bottom.
If participants are struggling to begin the ranking exercise, suggest several strategies. Strategies include: Pick out three that immediately stand out to you as especially important and three that are not as important; Start by organizing values into piles based on their importance, start by eliminating values from consideration for most or least important.
Question 1: What do you consider to be the most important value or values, and why?
Question 2: What do you consider to be the least important value or values, and why?
Question 3: Did you have any difficulty ranking any of the values, and why?
Question 4: Were any of your ranking decisions influenced by the neighborhood you live in, or your awareness of any issues facing specific neighborhoods in [insert city]?
Thank you very much for taking the time to participate today. I would like to take a few minutes to get your feedback about this experience.
Distribute evaluation
I am also going to give you my card. Please feel free to contact me at any time if you have any additional questions.
How to cite this protocol: Belisle-Toler, R., and J. Hodbod. 2019. A Guide to Visioning and Q Methodology in Food Systems. East Lansing, MI: Michigan State University, Department of Community Sustainability. https://www.canr.msu.edu/resources/tool-1-a-guide-to-visioning-and-q-methodology-in-food-systems