
 ?Mathematical formulae have been encoded as MathML and are displayed in this HTML version using MathJax in order to improve their display. Uncheck the box to turn MathJax off. This feature requires Javascript. Click on a formula to zoom.
ABSTRACT
As the substrates of traditional Chinese painting and calligraphy, paper and silk are susceptible to optical radiation in museum illumination, resulting in mechanical damage, the origins of which are changes in microscopic molecular structure. However, there is no effective method of quantitatively evaluating the microscopic molecular structural changes caused by irradiation. In this study, Raman spectroscopy was introduced for illumination research on the paper and silk substrates in museums. Four narrow-emitting light sources with different peak wavelengths, red (650 nm), amber (583 nm), green (510 nm), and blue (450 nm), which together constitute the spectrum of a white light emitting diode (LED), were used as experimental light sources. As experimental specimens, paper and silk substrates were irradiated by the four light sources. The Raman spectra of the specimens were collected before and after the illumination. By analyzing the variations in characteristic Raman peak intensities, the relative damage coefficients of the four light sources on microscopic molecular structures in the specimens were studied. Then, we were able to design the white LED spectral irradiance distribution of the two substrates according to the corresponding damage coefficients. In conclusion, a research method for studying the microscopic molecular structural changes in the substrates of traditional Chinese painting and calligraphy based on Raman spectroscopy has been proposed, finding a solution to the long-standing challenge of how to quantitatively evaluate illumination-induced mechanical damage of substrates. These results are instructive for designing the spectral ratios of white LEDs suitable for illumination of traditional Chinese painting and calligraphy in museums.
1. Introduction
Traditional Chinese painting and calligraphy (TCPC) is globally recognized as one of the treasures of oriental art, with important cultural, artistic, and historical value. At present, there are about 645,000 pieces of TCPC collections in Chinese museums (Dang et al. Citation2013). However, according to the photochemical stability grading standards of museum exhibits formulated by the CIE (Citation2004), TCPC belongs to the class of the highest level of light sensitivity and is susceptible to light damage. The main reason for this problem is that plant fiber–containing paper and protein molecule–containing silk are used as the substrates of TCPC, both of which are natural organic substances with unstable properties (Proniewicz et al. Citation2001; Shao et al. Citation2005).
Fig. 1. The study protocol.
At present, the method of color difference is used to evaluate the effect of museum illumination on color fading and the discoloration of pigments in historical artifacts (Dang et al. Citation2018a, Citation2018b; Farke et al. Citation2016; Pinilla et al. Citation2016). As nonstaining organic substrates, illumination damage to paper and silk is mainly manifested in mechanical damage such as brittleness, chalking, deformation, and cracking, the origins of which are changes in microscopic molecular structure that cannot be evaluated by the method of color difference. Therefore, there is an urgent need for a method to study microscopic molecular structural changes in paper and silk substrates under illumination by museum light sources to evaluate the corresponding mechanical damage.
Raman spectroscopy is an analytical method based on the Raman scattering principle and is an effective method of quantitatively evaluating microscopic damage to substances. Like human fingerprints, each substance has characteristic Raman spectral bands or peaks that correspond to the major molecular functional groups within it. When the substance is irradiated by light with incident energy E (E = hν, where h is Planck’s constant and ν is the frequency of light), energy exchange between the substance and the incident light occurs via collisions of photons of the incident light with the molecules of the substance, which manifests as changes in photon frequency and characteristic peak intensities in the measured Raman spectrum. Alves et al. (Citation2016) reported that Raman peak intensities of cellulose were used to characterize the internal structures of fibers and their changes in different acid and alkali environments. Monti et al. (Citation2001) evaluated the amount of silk form in specimens by calculating the ratio of Raman intensities of the peaks at 1415 and 1455 cm−1. Therefore, by calculating the measured variations of the characteristic Raman peak intensities, changes in microscopic molecular structure within substances can be determined.
In addition, the current lighting code for museums (China National Standardization Administration Citation2009) requires low correlated color temperature (≤ 4000 K) and high color rendering index (Ra ≥ 90) for light sources used for illumination of TCPC in museums. The white light emitting diode (LED) spectrum currently capable of realizing these two requirements consists of four narrow-emitting light sources with different peaks at red, amber, green, and blue wavelengths. At present, the spectral power distributions (SPDs) of white LEDs have been developed based principally on the method of spectral mixing of the above mentioned four types of light (Jiang et al. Citation2017; Oh et al. Citation2012, Citation2014; Xu et al. Citation2017). By adjusting the intensity ratios of the four spectra, white LEDs with low color temperature and high color rendering index can be achieved (Dang et al. Citation2018a). Therefore, quantitatively determining the illumination damage generated by individual narrow-emitting light sources to paper and silk substrates is of great significance for obtaining new white LEDs that are suitable for the illumination of TCPC.
In this work, Raman spectroscopy, which is commonly used in the field of analytical chemistry, was introduced to the research on illumination damage to TCPC substrates in museums. The four narrow-emitting light sources were used as experimental light sources. The peak intensity of the Raman spectra was used as an evaluation criterion. Changes in microscopic molecular structure within the paper and silk specimens were characterized by variations in Raman peak intensities upon testing before and after illumination to evaluate the corresponding mechanical damage. Our study protocol is outlined in .
2. Experimental method and methodology
2.1. Experimental light sources
The four narrow-emitting light sources with different peak wavelengths in the red (650 nm), amber (583 nm), green (510 nm), and blue (450 nm) regions of the visible spectrum were prepared using a museum-specific tungsten halogen lamp (PHILIPS 6423FO) combined with an infrared filter and a 20-nm-wide narrowband filter, which was custom-made by the Institute of Optics, Fine Mechanics and Physics, Chinese Academy of Sciences. The SPDs of the four light sources were tested () using a spectrophotometer (Photo Research PR 670). Due to the long duration of the illumination experiment, in order to avoid effects of light source decay on the experiment results, we periodically tested the illuminance on the surface of the specimens, as well as the SPDs of the four light sources. When we detected attenuation of an existing light source or a change in SPD, the aging light source was replaced by a new one.
Fig. 2. The normalized SPDs of four narrow-emitting light sources.
2.2. Specimens
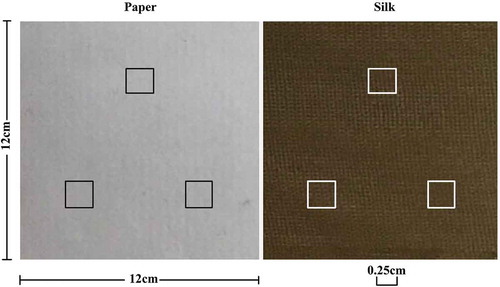
In accordance with traditional techniques, the paper and silk specimens used as TCPC substrates were prepared by the National Museum of China. Then the two types of specimens were cut into samples of the same size and combined together as a set with an overall size of 3 cm × 3 cm (). Four such sets were illuminated vertically, each one by one of the four different narrow-emitting light sources ().
Fig. 3. The paper and silk specimens.
2.3. Illumination environment
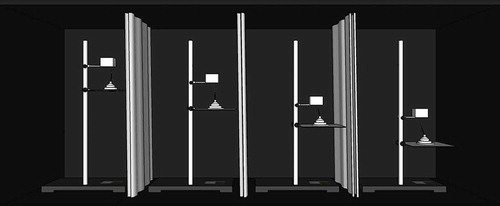
The illumination experiment was divided into four groups according to the peak wavelengths of the light sources and carried out in the all-dark optical laboratory of Tianjin University. shows the illumination experiment setup. Four experiment boxes with the same environmental parameters were created. The temperature, humidity, and air quality in the box were adjusted and kept constant during the experiment to meet the Code for Designing of Museum Building (The Ministry of Housing and Urban–Rural Development of the People’s Republic of China Citation2015), as shown in . Sunshades were used to separate the four experiment boxes into independent spaces, in order to ensure that the illumination experiments in each group did not interfere with each other. The surface irradiance of all specimens was equal and controlled at 1 W/m2 by adjusting the distance between the light source and specimens.
Table 1. Experimental parameters temperature, relative humidity, and air quality.
Fig. 4. The illumination experiment scene.
The entire experiment lasted a total of 1152 h. Raman spectra were acquired before and after the illumination experiment using a Raman spectrometer (Thermo Scientific DXR Microscope confocal Raman spectrometer). The spectral resolution was set at 1.496 cm−1. The paper and silk specimens were excited with the 780 nm line of a diode laser. All tests were carried out at room temperature. For the paper and silk specimens in each set, we collected three Raman spectra at different locations, as shown in the box in , and averaged these to generate the spectra for further analysis. In addition, we used standard errors to statistically describe the uncertainty in the measurements, which is represented as the error bars in and —that is, in the Raman spectra. The shorter the length of the error bar (marked in red), the more precisely the mean represents the true intensity of the Raman peak.
Fig. 5. Raman spectra of the paper specimens under irradiation of (a) 450 nm narrow-emitting light source, (b) 510 nm narrow-emitting light source, (c) 583 nm narrow-emitting light source, and (d) 650 nm narrow-emitting light source.
Fig. 6. Raman spectra of the silk specimens under irradiation of (a) 450 nm narrow-emitting light source, (b) 510 nm narrow-emitting light source, (c) 583 nm narrow-emitting light source, and (d) 650 nm narrow-emitting light source.
2.4. Experimental program
The analytical process was as follows. First, it was necessary to search the literature to obtain characteristic Raman peaks for functional groups found in the paper and silk specimens. Before the illumination experiment, the Raman peak shifts and intensities of the specimens were measured as the control group and were compared with data in the literature to ensure the rigor of our Raman measurements. After the specimens had been irradiated by the four light sources, the Raman peak shifts and intensities of the specimens were measured again as the experiment group. Based on the test data, the Raman spectra—that is, intensity versus Raman shift—were plotted. Origin software, based on the Savitzky-Golay convolution algorithm (Zhu et al. Citation2007), was used to smooth and denoise each Raman spectral line. From these processed Raman spectra, characteristic Raman peaks were manually selected for data analysis. Then, for these selected peaks, the Raman intensity value I0 before the illumination experiment and the Raman intensity value I1 after the illumination experiment were read by the Origin software. By using (1), the difference ΔI between the Raman peak intensities before and after the illumination experiment was obtained.
The smaller the value of ΔI, the lower the microscopic damage to the specimens. By comparing the degree of microscopic damage to the paper and silk specimens generated by the four light sources, the relative damage coefficients of the spectrally distinct light sources on the microscopic molecular structure of the paper and silk specimens were obtained.
3. Results and discussion
3.1. Paper
Paper consists mainly of bonded cellulose fibers that are linear polymers of glucose (β-d-glucopyranose) monomers linked by β-1,4 glycosidic bonds. The cellulose chains are held together by strong intramolecular hydrogen bonds that promote aggregation of single chains into a highly oriented structure. Up to 80% of these aggregates are ordered; that is, they are in crystalline form. The remaining 20% is disordered—that is, it is amorphous (Proniewicz et al. Citation2001). Under illumination, the paper is easily oxidized due to degradation of the main component cellulose molecules, which in turn leads to a reduction in cellulose fiber strength and may even lead to complete decomposition of the paper (Proniewicz et al. Citation2002). From this point of view, due to the effect of illumination environments in museums as well as its own characteristics, the microscopic molecular structure of paper can be easily damaged. Therefore, Raman spectroscopy was used to evaluate the illumination damage caused by different light sources.
Before the experiment, the Raman spectra of the paper were collected; then the paper specimens were irradiated by four light sources and the Raman spectra of the paper after the illumination experiment were collected again. shows the Raman spectra of the paper before and after irradiation by the four light sources; in , the error bar marked in red is used to statistically describe the uncertainty in the measurements.
In , the abscissa represents the Raman shift; that is, the frequency shift of the scattered light relative to the incident light caused by scattering off the substrate specimens. Raman shifts are typically measured in wavenumbers, and the unit most commonly chosen for expressing wavenumbers in Raman spectra is inverse centimeters (cm−1); the vertical axis represents the intensity of the Raman-scattered light. In the figure, the solid line represents the Raman spectrum before the illumination experiment and the dotted line represents the Raman spectrum after the experiment. Details of the plots in are analogous.
As shown in , the Raman spectra of the paper specimens show a Raman peak with moderate intensity at 895 cm−1. Proniewicz et al. (Citation2001) used Fourier transform Raman spectroscopy to study the Raman spectrum of pure cellulose. They found that the intensity of the 900 cm−1 band was very sensitive to the amount of crystalline versus amorphous structure in the cellulose. Wiley and Atalla (Citation1987) observed that the intensity of the Raman peak at 900 cm−1 was proportional to the amount of disorder in the cellulose. With the accelerated aging of cellulose, hydrolysis of glycoside bonds causes changes in the polymer structure, mainly by forcing rearrangements of hydrogen bonding and changes from the crystalline to the amorphous form. Therefore, the Raman peak intensity at 895 cm−1 was selected to characterize the illumination-induced damage to the microscopic molecular structure of the paper specimens by the four light sources. Furthermore, the characteristic peaks in the Raman spectra recorded after illumination (dotted line) were obtained by red-shifting of the spectral peaks in the spectrum recorded prior to illumination (solid line). Taking the Raman spectra of the paper specimens irradiated by the narrow-emitting light source at 510-nm as an example, the characteristic Raman peak at 895 cm−1 before illumination is red-shifted to 897 cm−1 after illumination.
The variations in Raman peak intensities of the paper specimens under irradiation by the four light sources were analyzed. In , the Raman spectra of the paper specimens irradiated by the 510 nm light source are used as an example. According to the data obtained before the illumination experiment (solid lines in ), the Raman peak intensity (cps) at 895 cm−1 was read by the Origin software (see Section 2.4 for details) as I0; according to the spectrum obtained after illumination (, dotted line), the Raman peak intensity (cps) at 897 cm−1 was read by the Origin software as I1. Using (1), the Raman peak intensity differences ΔI under irradiation of the four narrow-emitting light sources were obtained. By rescaling the values of ΔI, defining the ΔI value of the paper specimens under irradiation of the 450 nm light source (raw value 0.4278) as 1.0000, relative damage coefficients for the paper specimens of the four narrow-emitting light sources may be given as 1.0000, 0.9093, 0.3714, and 1.9780 for the 450 nm, 510 nm, 583 nm, and 650 nm light sources, respectively. The calculation results are shown in .
3.2. Silk
Fibroin in silk is a natural polymer fiber protein, containing 18 types of amino acids, of which glycine (Gly), alanine (Ala), and serine (Ser) account for more than 80% of the total composition (Shao et al. Citation2005). Due to these organic components, exposure to light will cause significant photochromic changes in silk, inducing a gradual loss of strength and flexibility.
The changes in the Raman spectra of the silk specimens before and after irradiation of the four light sources are shown in . The strongest Raman peak in the spectrum acquired before illumination (solid line) is 1230 cm−1, and a moderately strong Raman peak is located at 1082 cm−1. Shao et al. (Citation2005) found that the Raman peak intensities (cps) at 1232 and 1087 cm−1, corresponding to C–N bond vibrations, decreased after ultraviolet/ozone irradiation, indicating that ultraviolet/ozone irradiation caused peptide chain breakage and confirming that photodegradation occurred at the C–N bond. Therefore, we selected characteristic Raman peak intensities (cps) at 1082 and 1230 cm−1 to comprehensively characterize the radiation damage to the silk specimens resulting from irradiation of the four light sources. Furthermore, we observed a red shift in the characteristic peaks of the Raman spectrum obtained after illumination (dotted line). Taking the Raman spectra of the silk specimens irradiated by the light source at 510 nm as an example, the characteristic peaks at 1082 and 1230 cm−1 in spectrum obtained before illumination are red-shifted to 1105 and 1256 cm−1, respectively, in the spectrum measured after illumination.
The variations of the Raman peak intensities under irradiation of the four light sources were analyzed. In , the Raman spectrum of the silk specimen irradiated by the 510 nm light source is taken as an example: from the spectrum recorded before the illumination experiment, the Raman peak intensities (cps) at 1082 and 1230 cm−1 were read by the Origin software as I0 and I′0, respectively, and the Raman peaks at 1105 and 1256 cm−1 in the spectrum acquired after illumination were respectively read by the Origin software as I1 and I′1. Using (1), based on the two Raman peak intensities I0 and I1, the Raman peak intensity difference ΔI was calculated; based on the two Raman peak intensities I′0 and I′1, the Raman peak intensity difference ΔI′ was calculated. Then, ΔI″ was obtained as the average value of ΔI and ΔI′. Similar to the procedure for the paper specimen analysis, by defining the peak intensity difference value ΔI″ of the silk specimens obtained after irradiation of the narrow-emitting light source at 450 nm (raw value 10.8402) as 1.0000, rescaled values of ΔI″ were obtained as the relative damage coefficients for the silk specimens of the four narrow-emitting light sources as 1.0000, 0.7740, 1.1046, and 0.3846 for the 450 nm, 510 nm, 583 nm, and 650 nm light sources, respectively. The calculation results are shown in .
4. Conclusions
Our experimental results show that the optical radiation in the illumination experiment had significant effects on the paper and silk specimens, resulting in changes in the microscopic molecular structure. Moreover, different degrees of damage were observed for the four narrow-emitting light sources, as displayed in and .
Table 2. Differences in Raman peak intensities of paper specimens under illumination by four narrow-emitting light sources.
Table 3. Differences in Raman peak intensities of silk specimens under illumination by four narrow-emitting light sources.
Our wider research program consists of the study of illumination damage to TCPC in museums via two approaches. Substrates were studied by Raman spectroscopy and pigments have been studied by the method of color difference (Dang et al. Citation2018a, Citation2018b). According to these two methods, the relative damage coefficients were obtained for the substrate and the pigment, which is instructive for the spectral ratio design of white LEDs suitable for illumination of TCPC in museums.
The method proposed in this study to determine changes in microscopic molecular structure via Raman spectroscopy can be used to evaluate mechanical damage caused by illumination. Furthermore, the method can be applied to the study of illumination damage to other nonstained historical artifacts, such as lacquerware and wood products, at the microscopic level.
Disclosure statement
The authors have no financial interests to declare.
Additional information
Funding
References
- Alves APP, Oliveira LPZ, Castro AAN, Neumann R, Oliveira LFC, Edwards HGM, Sant’Ana AC. 2016. The structure of different cellulosic fibres characterized by Raman spectroscopy. Vib Spectrosc. 86:324–330.
- China National Standardization Administration. 2009. Code for Lighting Design of Museum (GB/T 23863-2009). Beijing (China): China Standard Press.
- Commission International de l’Éclairage (CIE). 2004. CIE 157: Control of damage to museum objects by optical radiation. Vienna (Austria): CIE Central Bureau.
- Dang R, Yuan Y, Liu G, Liu J. 2018b. Chromaticity changes of inorganic pigments in Chinese traditional paintings due to the illumination of frequently-used light sources in museum. Color Res Appl. 43(4):596–605.
- Dang R, Yuan Y, Liu G, Luo C, Liu J. 2018a. White LED spectrum for minimising damage to Chinese traditional heavy colour paintings. Lighting Res Technol. 50:911–920.
- Dang R, Zhang MY, Liu G, Yu J, Hou D. 2013. Research on the lighting of museum exhibition chen lighting based on cultural relics protection. China Illum Eng J. 24(3):18–23.
- Farke M, Binetti M, Hahn O. 2016. Light damage to selected organic materials in display cases: A study of different light sources. Stud Conserv. 61(Suppl 1):83–93.
- Jiang PQ, Peng Y, Mou Y, Cheng H, Chen MX, Liu S. 2017. Thermally stable multi-color phosphor-in-glass bonded on flip-chip UV-LEDs for chromaticity tunable WLEDs. Appl Optics. 56(28):7921–7926.
- The Ministry of Housing and Urban-Rural Development of the People’s Republic of China. 2015. Code for Designing of Museum Building (JGJ 66-2015). Beijing (China): China Architecture and Building Press.
- Monti P, Taddei P, Freddi G, Asakura T, Tsukada M. 2001. Raman spectroscopic characterization of bombyx mori silk fibroin: raman spectrum of silk I. J Raman Spectrosc. 32(2):103–107.
- Oh JH, Lee KN, Do YR 2012. Characterization of four-color multi-package white light-emitting diodes combined with various green monochromatic phosphor-converted light-emitting diodes. Proc. SPIE 8278, Light-Emitting Diodes: Materials, Devices, and Applications for Solid State Lighting XVI, San Francisco, California, United States, 82781I, 2012 Feb 6. doi: 10.1117/12.908157.
- Oh JH, Yang SJ, Do YR. 2014. Healthy, natural, efficient and tunable lighting: four-package white LEDs for optimizing the circadian effect, color quality and vision performance. Light: Sci Appl. 3:e141.
- Pinilla SM, Vazquez D, Fernandez-Balbuena AA, Muro C, Munoz J. 2016. Spectral damage model for lighted museum paintings: oil, acrylic and gouache. J Cult Herit. 22:931–139.
- Proniewicz LM, Paluszkiewicz C, Wesełucha-Birczynska A, Baranski A, Dutka D. 2002. FT-IR and FT-Raman study of hydrothermally degraded groundwood containing paper. J Mol Spectrosc. 614(1–3):345–353.
- Proniewicz LM, Paluszkiewicz C, Weselucha-Birczynska A, Majcherczyk H, Baranski A, Konieczna A. 2001. FT-IR and FT-Raman study of hydrothermally degradated cellulose. J Mol Spectrosc. 596(1–3):163–169.
- Shao JZ, Zheng JH, Liu JQ, Carr CM. 2005. Fourier transform Raman and Fourier transform infrared spectroscopy studies of silk fibroin. J Appl Polym Sci. 96(6):1999–2004.
- Wiley JH, Atalla RH. 1987. Band assignments in the Raman spectra of celluloses. Carbohyd Res. 160:113–129.
- Xu YQ, Bai TZ, Tang Y. 2017. Study on color rendering of light communication source based on multi-chromatic LED. Spectrosc Spectral Anal. 37(12):3693–3697.
- Zhu QY, Quivey Jr RG, Berger AJ. 2007. Raman spectroscopic measurement of relative concentrations in mixtures of oral bacteria. Appl Spectrosc. 61(11):1233–1237.