
 ?Mathematical formulae have been encoded as MathML and are displayed in this HTML version using MathJax in order to improve their display. Uncheck the box to turn MathJax off. This feature requires Javascript. Click on a formula to zoom.
ABSTRACT
Background
Reference values of body fat for competitive volleyball players are lacking, making it difficult to interpret measurement results. This review systematically summarized published data on the relative body fat of volleyball players and calculated potential differences between sex, measurement method, and competitive level.
Methods
The protocol followed the Preferred Reported Items for Systematic Reviews and Meta-Analysis guidelines. The literature search was conducted using five electronic databases to retrieve all relevant publications from January 1, 2010, to July 1, 2021. The 63 studies including 2607 players that met the inclusion criteria were analyzed using random-effects models. Data were reported as pooled mean body fat with 95% confidence intervals.
Results
Body fat for males and females was 12.8% (11.9–13.8%) and 22.8% (21.9–23.7%), respectively. Body fat was 18.3% (16.3–20.4%) measured via skinfolds, 18.4% (15.6–21.2%) via bioelectrical impedance analysis, 24.2% (20.4–28.0%) via dual-energy x-ray absorptiometry and 21.6% (17.4–25.8%) via densitometry. Regional, national, and international-level players had body fat values of 19.5% (17.8–21.2%), 20.3% (18.6–22.0%), and 17.9% (15.7–20.4%), respectively. When the meta-regression was adjusted for the variables sex, measurement method, and competitive level, a significant difference between sex (p < 0.001), dual-energy x-ray absorptiometry and skinfolds (p = 0.02), and national and international-level players (p = 0.02) was found. However, sensitivity analysis revealed that findings regarding measurement method and competitive level were not robust and should, therefore, be interpreted with caution.
Conclusions
Despite the limitations of published data, this meta-analysis provided pooled values for body fat of male and female volleyball players for different competitive levels and measurement methods.
1. Introduction
Volleyball has consistently been part of the Summer Olympics program since 1964 and is currently one of the most widely played team sports in the world. The sport is played by two teams on a playing court divided by a net (set at the height of 2.43 m for men and 2.24 m for women) and characterized by high-intensity and mainly explosive efforts, such as accelerations, decelerations, jumping, blocking, serving, ball-striking, and landing (from an average 3–9 s in 1991 to an average 6–9 s in 2008), interspersed with longer periods of recovery (from an average 10–20 s in 1991 to an average 20–27 s in 2008) [Citation1–3]. Recently, both researchers and practitioners have paid increasing attention to physical and physiological attributes of competitive volleyball athletes to better inform their decision-making [Citation4]. Jump performance, for example, has been identified to be highly indicative of athletes` performance level [Citation5–8]. Similarly, there is convincing evidence to suggest that elite players are taller than their non-elite counterparts [Citation5,Citation6,Citation9,Citation10]. The ideal body composition of competitive volley ballers, however, is unknown. Considering nonforce-producing nature of body fat (BF) which adds to body mass [Citation11], and therefore negatively influencing explosive performance [Citation12,Citation13]. Explosive actions, such as rapid acceleration and vertical jumps, make up a large part of the set for any volleyball team (during an average set, a team will have to perform approximately 160–190 jumps) [Citation3]. Considering that BF has a relatively high inverse association with vertical jump performance (BF alone seems to explained 57% of vertical jump variability, and 66% of variability when combined with sex or body weight) [Citation12], it is reasonable to expect that elite volleyball players would have lower BF values than their non-elite peers, similar to other team sports such as basketball where body composition has been found to discriminate between levels of competition [Citation14]. However, while some studies have confirmed this hypothesis [Citation5,Citation10,Citation15], others have reported no or unclear differences in BF between playing levels [Citation9,Citation16,Citation17]. Additionally, although BF is routinely assessed, volleyball-specific BF recommendations are lacking, making it difficult for researchers and practitioners to interpret measurement results.
Therefore, the main aims of this systematic review and meta-analysis were to: (a) review the existing literature on relative BF (percentage body fat) of competitive volleyball players; (b) provide reference values for relative BF of competitive volleyball players; and (c) calculate potential differences between sex, measurement method, and competitive level.
2. Methods
2.1. Search strategy
A systematic review and meta-analysis was conducted and reported in accordance with the guidelines outlined in the Preferred Reporting Items for Systematic Reviews and Meta-Analyses statement [Citation18]. We conducted a comprehensive computerized search, without language restrictions, of the electronic databases PubMed, Web of Science, SportDiscus, CINAHL, and Scopus. The search was limited to peer-review articles from January 2010 to July 2021. The following body composition-related search terms were combined with the term “volleyball” to source pertinent peer-reviewed articles: “body composition” OR “body fat*” OR “fat mass” OR “lean body mass” OR “fat free mass” OR “muscle mass” OR skinfold* OR anthropometr* OR “multi-component model” OR “bioelectrical impedance” OR bioimpedance OR “magnetic resonance imaging” OR “computed tomography” OR “dual-energy X-ray absorptiometry” OR “dual x-ray absorptiometry” OR densitometry OR “underwater weighing” OR “air displacement plethysmography” OR hydrometry OR ultrasound OR “3D photonic scanning.” The search was complemented by screening the reference lists and citations of all retrieved articles and additional key author searches. The literature search and study selection were independently conducted by two researchers (PB and PM). Disagreements were resolved by discussion.
2.1.1. Inclusion criteria
Studies meeting the following criteria were deemed eligible for inclusion: (a) participants were healthy volleyball players older than 18 years; (b) players were competing at regional, national, or international competitions; (c) the full-text of the article was published in a peer-reviewed journal in English, Spanish, Portuguese, or German language; and (d) outcome measures included and described at least one method of estimating relative BF.
2.1.2. Exclusion criteria
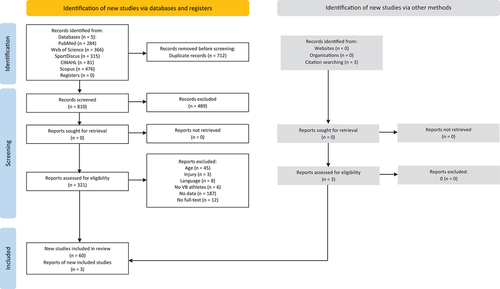
Studies were considered ineligible for this review if (a) they involved volleyball players with medical conditions or injuries impairing performance; (b) participants were training less than twice per week or had less than a year of volleyball experience; (c) relative BF values were not stated or not separately reported by sex or measurement method; (d) they presented duplicate data (e.g. same sample as in another article already included in the review). Studies excluded as per criteria (c) and (d) were labeled as “no data” in the flowchart of the review and selection processes shown in . Case studies, reviews, conference communications, opinion articles, presentations, theses, book chapters, or posters were not included.
Figure 1. Flowchart of study screening and selection. VB Volleyball.
2.2. Data extraction
Each included study was independently read by three investigators (PB, PM, and BM) for extraction of the following variables: (a) descriptive information including authors, year of publication and type of study; (b) participant information including sample size, sex, age, body height, body mass, and a sample description. Volleyball players were categorized to one of the three competitive levels: regional, national, and international, in line with a similar previous study, which used the same methodology [Citation14]. Players from third national leagues or lower, university athletes, or regional teams without further description were considered regional level. National level represents players from the first or second national leagues, including the National Collegiate Athletic Association divisions 1 and 2. Players were considered international level if the study clearly mentioned that participants were active members of national teams or club teams competing in international championships; (c) measurement information including type of measurement method, equipment, and computational procedures used to calculate relative BF; (d) relative BF as the main outcome measure. Additionally, lean compartment mass, including absolute (kg) or relative (%) muscle mass, fat-free mass, or lean body mass were extracted. For studies reporting multiple assessments (e.g. baseline, post-intervention, and follow-up) of BF, the pre-intervention data, or initial values were considered. Coding was cross-checked between authors, and differences were discussed until mutual agreement was reached. If pertinent data were absent or solely reported in figures or graphs, the corresponding authors were contacted to obtain numerical data. Relevant study information regarding authors and years of publication, study samples, methods, and outcomes are reported in appendices 1–4, respectively.
2.3. Statistical analyses
Statistical analysis was performed using R version 4.0.3, RStudio version 1.4.1103, and the package Metafor (version 3.0–2) [Citation19]. The outcome variable was relative BF, and moderator variables were as follows: I) sex (male; female); II) method of body composition assessment (skinfolds; bioelectrical impedance analysis [BIA]; dual-energy x-ray absorptiometry [DXA]; densitometry); and III) competitive level (international, national, and regional). Studies were inserted as random effects. Pooled mean estimates, and their corresponding 95% confidence intervals (CI) were reported for each performed analysis. Variance of the sample mean BF for each study was calculated (SD [Citation2]/sample size) and studies were weighted by the inverse of the variance in the meta-analysis models. The random-effects model took the residual heterogeneity of studies, which was assessed through Cochran’s test of heterogeneity (QE), into consideration. In addition, I [Citation2] statistics were calculated to determine the degree of statistical heterogeneity, with >75% considered as high statistical heterogeneity. A sensitivity analysis was implemented to investigate the influence of the removal of single studies on p-values and residual heterogeneity. Publication bias was visually inspected by examining the asymmetry of funnel plots containing pseudo-confidence interval regions (white (90%), light gray (95%), and dark gray (99%) areas). A forest plot was used to present pooled mean estimates with 95% confidence intervals of arbitrarily defined groups (e.g. male international players measured with DXA).
Each moderator variable was first considered independently (i.e. in a separate model including only one moderator). As analyses demonstrated statistically significant differences between groups in all moderator variables (i.e. between females and males, between international and national/regional, and between measurement methods), we subsequently used the moderator sex in combination with another moderator (measurement method or competitive level). Finally, we combined all three moderators in one model accordingly. Hence, the model equation for the final model was
where is the observed mean BF in study
and
is the mean BF in the arbitrarily chosen reference group of male international players measured with DXA. Further regression coefficients
to
represent the changes in mean BF due to female sex, measurement with BIA, skinfolds, or densitometry, and national or regional competitive level.
is a residuel term with a mean of 0 and the variance corresponding to the sampling variance of
within the study-specific population of study
.
is an additional random effect with mean 0 and variance corresponding to the heterogeneity between studies. Post-hoc Bonferroni correction was applied for p-values and CI when performing all pairwise comparisons between the four methods of body composition assessment or the three competitive levels.
3. Results
3.1. Study selection
The literature search revealed 1522 publications. After removing duplicates and reviewing titles and abstracts, 324 were selected for full-text analysis, after which 261 further articles were excluded for not meeting the selection criteria (the motives for exclusions are presented in ). The remaining 63 studies were included in the systematic review (see ). The study characteristics are summarized in appendices 1–4.
3.2. Study samples
In total, 2607 healthy competitive volleyball players with mean ages ranging from 18 to 28 years were involved in the 63 studies. Across studies, the mean sample size was 41 participants per study, ranging from 7 [Citation20] to 163 [Citation21]. Of the 2607 volleyball players, 976 were male (with an average weight and height of 69–93 kg and 176–199 cm, respectively) and 1631 were female. (The average body weight and height ranged from 50 to 76 kg and from 160 to 189 cm, respectively.) Three studies involved both female and male players [Citation22–24]. In total, there were 643 players categorized as “regional level” (220 male and 423 female), 1698 as “national level” (676 male and 1022 female) and 266 as “international” (80 male and 186 female), with five studies directly comparing two or more competitive levels [Citation9,Citation10,Citation15–17].
3.3. Relative body fat
For assessment of BF, 32 studies used skinfold measurements [Citation5,Citation10,Citation16,Citation17,Citation21–48], 15 studies used BIA [Citation9,Citation26,Citation49–61], 12 studies used DXA [Citation20,Citation62–72] and six studies used densitometry [Citation45,Citation73–77]. Vargas et al. [Citation45] and Buśko & Lipińska [Citation26] directly compared skinfold measurements to densitometry and BIA, respectively. The first model comparing sex revealed that male players had significantly lower BF than female players (12.8% [11.9–13.8%] and 22.8% [21.9–23.7%], respectively; p < 0.001). The second model comparing measurement methods revealed that BF values measured by DXA (24.2% [20.4–28.0%]) were significantly higher compared to skinfolds (18.3% [16.3–20.4%]) and BIA (18.4% [15.6–21.2%]) derived BF values (all p < 0.01). No significant differences for BF measured by densitometry (21.6% [17.4–25.8%]) were found compared to other methods (all p > 0.05). The third model comparing competitive levels revealed significantly higher BF values of national-level players compared to regional or international-level players (20.3% [18.6–22.0%], 19.5% [17.8–21.2%], and 17.9% [15.6–20.2%], respectively; all p < 0.05).
Finally, the meta-regression was adjusted for potential moderator variables (i.e. sex, measurement method, and competitive level) in the fourth model. The results showed that the difference between sexes was significant, independent of measurement method or competitive level (p = 0.001). When adjusted for sex and competitive level, only the difference between DXA and skinfold measurements derived from BF values was significant (p = 0.02). When adjusting for sex and measurement method, the fourth model revealed that only differences between national and international-level players were significant (p = 0.02). Sensitivity analysis and cumulative meta-analysis confirmed the stability of the results regarding sex-related differences, as exclusion of single studies did not change statistical significance between male and female players. However, further sensitivity analyses revealed that results regarding measurement method and competitive level were not robust. Exclusion of single studies changed significance levels. The forest plot of the analysis is presented in . Results of the meta-analysis according to subgroups adjusted for sex and measurement method are shown in .
Figure 2. Forest plot.
Table 1. Results of meta-analysis according to sex and measurement method.
No indication of publication bias was found, with most points falling symmetrically within the funnel plot (see ). The heterogeneity of the dataset was estimated using the Cochrane test of heterogeneity (QE = 2621, p < 0.0001) and I2 statistics (I2 > 75%). Cochrane’s test of heterogeneity revealed highly stable outcomes (i.e. no changes in p-values after stepwise exclusion of single studies).
Figure 3. Funnel plot.
4. Discussion
This study used a meta-analysis approach to summarize BF values of competitive volleyball players and examine the effects of sex, measurement method, and competitive level on the respective values of BF. The one major finding was that male players had significantly lower BF compared to their female counterparts. Although this finding was to be expected, considering the biological and hormonal differences between male and female athletes that result in differing BF, it further reinforced the need for sex-specific research and reference values.
In line with the findings of the systematic review on inequalities in the assessment of male and female athletes in sports medicine research, the data set in this study was also unbalanced in terms of gender, with female volleyball players being studied more frequently than their male counterparts [Citation78].
Only about one-third of the participants included in this meta-analysis were males. Male players were especially underrepresented in studies using laboratory methods, such as DXA (51 males vs. 229 females) or densitometry (0 males vs. 128 females). Future high-quality research on BF of male volleyball athletes, especially with laboratory methods, is, therefore, warranted.
Another main finding was that, even after adjusting for sex and competitive level, DXA-derived BF values were significantly higher than those measured via skinfolds or BIA. To the best of the authors’ knowledge, there is no study that has directly compared DXA with skinfold or BIA-derived BF values of volleyball athletes to corroborate these findings. However, similar results were observed in a previous similar study using the same methodology in basketball players [Citation14]. This also confirms the results observed in other studies where athletes’ BF measured by DXA was significantly higher compared to BIA and skinfolds when compared directly. [Citation79,Citation80]
No differences between the three measurement methods, skinfolds, BIA, and densitometry, were found in our analysis. This result partly supports findings by Vargas et al. [Citation45], who measured the BF of 14 female collegiate volleyball players with a skinfold caliper and densitometry (i.e. Bod Pod®). Although they did not statistically compare the BF measured by the two systems, differences were minimal (i.e. 21.2 ± 4.5% and 22.8 ± 6.3% measured via skinfolds and densitometry, respectively). However, Buśko & Lipińska [Citation26] found significant differences between skinfold and BIA derived BF values in a sample of female Polish second division players (i.e. 25.6 ± 1.9 and 28.7 ± 4.8 measured via skinfolds and BIA, respectively).
Further data collection is required to establish differences or similarities of volleyball players’ BF measured by different methods. Meanwhile, these provide further support for the idea that it is best to compare BF values directly to measurement technique-specific reference values [Citation11,Citation81]. Additionally, although not the primary aim of this study, we found substantial heterogeneity in measurement devices and the computational procedures used. This was especially true for most applied BIA and skinfold measurements. This is important since evidence suggests that BF estimates derived by BIA and skinfolds are greatly influenced by the device and computational procedures used [Citation82–85]. In a large study of 2458 active adult participants, for example, Vaquero-Christobal et al. [Citation85] found significant differences between BF values calculated using from the same skinfold measurements but using various equations, with results ranging from 10.7 ± 2.5 to 28.4 ± 6.0%. Similarly, Golja et al. [Citation82] compared an extensive list of skinfold regressions applied on skinfolds of healthy young participants and found large differences ranging from 6% to 29% for males and 8–29% for females.
Differences in BF values obtained using different measurement methods could potentially result from various factors such as measurement preparation, protocol standardization (subject hydration status, dietary intake, physical activity, temperature, and menstrual cycle), type of measuring device, and the calculation procedures and equations used to estimate BF. In the present study, even when using the same method for estimating BF, a large heterogeneity was found according to the device. Comparison of BF estimated using different technologies and software (usually with unknown calculation procedures and equations used) could lead to biased results. This potential bias should also be considered as a potential confounder in the forest plot of the present analysis shown in . Therefore, the use of the same device and computational procedure is indispensable to facilitate comparison of results.
Finally, we provided novel data on BF differences between competitive levels of volleyball players. Our results revealed no significant differences between international and national-level players. In addition, unclear BF differences were found when regional-level players were compared to their international and national-level peers. Although a trend toward lower BF values in international-level players was observed, the results were unstable and affected by single studies in this review. Therefore, the findings of this meta-analysis did not confirm differences in BF between players of different competitive levels and may reflect changes in fitness when compared longitudinally within athletes. However, categorization of competitive levels might have biased our results. It is possible that the classification of international, national, or regional level did not reflect the players’ actual proficiency level, especially when considering that results from different geographical regions and nations were pooled. Competitive level might be higher in countries where volleyball is particularly popular (e.g. Italy, Russia, Brazil, Poland, and Serbia). The higher BF values observed in national players compared to their regional counterparts may be related to the considerable heterogeneity in the methods used to assess body composition in these groups. The DXA method, which appears to provide higher values of BF than other methods, has been used more frequently in studies of athletes at national level than in those of players at regional level, which could potentially affect the results. Future studies should attempt to identify potential differences or similarities of BF across various competitive levels.
5. Conclusions
In summary, this is the first systematic review with meta-analysis focusing on BF of competitive volleyball players. We have provided reference values which may be useful for researchers and practitioners when interpreting their results. The results of our meta-analysis indicate that male players have significantly lower BF than female players. Therefore, it is recommended that sex-specific calibration equations and reference values are used when measuring and interpreting relative BF. As unclear differences were found when comparing different methods to measure relative BF, the interchangeable use of different measurement methods to determine BF is discouraged. Ideally, professionals should use the same measurement device, computational procedure, and measurement preparation – especially when comparing values within the same group of athletes. We found unclear differences in relative BF between competitive levels. Although a trend could be observed, relative BF did not seem to be highly indicative of athletes’ performance level.
Supplemental Material
Download Zip (76.4 KB)Acknowledgments
We would like to thank all the authors who provided us with original data from their articles and answered our queries and Dr Robin Ristl for his precious assistance.
Disclosure statement
No potential conflict of interest was reported by the authors.
Data availability statement
All data generated or analyzed during this study are included in this published article and its supplementary information files.
Supplementary material
Supplemental data for this article can be accessed online at https://doi.org/10.1080/15502783.2023.2246414
Additional information
Funding
References
- Polglaze, T, Dawson, B. The physiological requirements of the positions in state league volleyball. Sport Coach. 1992;15:32.
- Sheppard, J, Gabbett, T, Claudio Reeberg Stanganelli, L, et al. An analysis of playing positions in elite international mens’ volleyball: considerations for competition demands and physiological characteristics. J Strength Cond Res. 2010;24(1):1. doi: 10.1097/01.JSC.0000367211.02914.93
- de Alcaraz, AG, Valadés, D, Palao, JM. Evolution of game demands from young to elite players in men’s volleyball. Int J Sports Physiol Perform. 2017;12(6):788–722. doi: 10.1123/ijspp.2016-0027
- Villarejo-García, DH, Moreno-Villanueva, A, Soler-López, A, et al. Use, validity and reliability of inertial movement units in volleyball: systematic review of the scientific literature. Sensors. 2023;23(8):3960. doi: 10.3390/s23083960
- Carvalho, A, Roriz, P, Duarte, D. Comparison of morphological profiles and performance variables between female volleyball players of the first and second division in Portugal. J Hum Kinet. 2020;71(1):109–117. doi: 10.2478/hukin-2019-0076
- Lidor, R, Ziv, G. Physical and physiological attributes of female volleyball players-areview. J Strength Cond Res. 2010;24(7):1963–1973. doi: 10.1519/JSC.0b013e3181ddf835
- Smith, DJ, Roberts, D, Watson, B. Physical, physiological and performance differences between Canadian national team and universiade volleyball players. J Sports Sci. 1992;10(2):131–138. doi: 10.1080/02640419208729915
- Ziv, G, Lidor, R. Vertical jump in female and male volleyball players: a review of observational and experimental studies. Scand J Med Sci Sports. 2010;20(4):556–567. doi: 10.1111/j.1600-0838.2009.01083.x
- Campa, F, Toselli, S. Bioimpedance vector analysis of elite, subelite, and low-level male volleyball players. Int J Sport Physiol Perform. 2018;13(9):1250–1253. doi: 10.1123/ijspp.2018-0039
- Nikolaidis, PT, Afonso, J, Busko, K. Differences in anthropometry, somatotype, body composition and physiological characteristics of female volleyball players by competition level. Sport Sci Health. 2015;11(1):29–35. doi: 10.1007/s11332-014-0196-7
- Ackland, TR, Lohman, TG, Sundgot-Borgen, J, et al. Current status of body composition assessment in sport. Sport Med. 2012;42(3):227–249. doi: 10.2165/11597140-000000000-00000
- Caia, J, Weiss, LW, Chiu, LZF, et al. Do lower-body dimensions and body composition explain vertical jump ability. J Strength Cond Res. 2016;30(11):3073–3083. doi: 10.1519/JSC.0000000000001406
- Daugherty, HJ, Weiss, LW, Paquette, MR, et al. Potential predictors of vertical jump performance: lower extremity dimensions and alignment, relative body fat, and kinetic variables. J Strength Cond Res. 2021;35(3):616–625. doi: 10.1519/JSC.0000000000003962
- Sansone, P, Makivic, B, Csapo, R, et al. Body fat of basketball players: a systematic review and meta-analysis. Sport Med - Open. 2022;8(1):26. doi: 10.1186/s40798-022-00418-x
- Kutáč, P, Sigmund, M. Assessment of body composition of female volleyball players of various performance levels. J Phys Educ Sport. 2017;17:556–562.
- D’Anastasio, R, Milivojevic, A, Cilli, J, et al. Anthropometric profiles and somatotypes of female volleyball and beach volleyball players. Int J Morphol. 2019;37(4):1480–1485. doi: 10.4067/S0717-95022019000401480
- Dopsaj, M, Nešić, G, Ćopić, N. The multicentroid position of the anthropomorphological profile of female volleyball players at different competitive levels. Facta Univ Phys Educ Sport. 2010;8:47–57.
- Page, MJ, McKenzie, JE, Bossuyt, PM, et al. The PRISMA 2020 statement: an updated guideline for reporting systematic reviews. BMJ. 2021;372:n71. doi: 10.1136/bmj.n71
- Viechtbauer, W. Conducting meta-analyses in R with the metafor package. J Stat Softw. 2010;36(3):1–48. doi: 10.18637/jss.v036.i03
- Carbuhn, AF, Fernandez, TE, Bragg, AF, et al. Sport and training influence bone and body composition in women collegiate athletes. J Strength Cond Res. 2010;24(7):1710–1717. doi: 10.1519/JSC.0b013e3181d09eb3
- Malousaris, GG, Bergeles, NK, Barzouka, KG, et al. Somatotype, size and body composition of competitive female volleyball players. J Sci Med Sport. 2008;11(3):337–344. doi: 10.1016/j.jsams.2006.11.008
- Khanna, A, Koley, S. Comparison of anthropometric profile and handgrip strength between inter-university volleyball players and a reference group. Biomed Hum Kinet. 2020;12(1):82–90. doi: 10.2478/bhk-2020-0011
- Koley, S, Singh, J, Sandhu, JS. Anthropometric and physiological characteristics on Indian inter-university volleyball players. J Hum Sport Exerc. 2010;5(3):389–399. doi: 10.4100/jhse.2010.53.09
- Sattler, T, Hadžic, V, Derviševic, E, et al. Vertical jump performance of professional male and female volleyball players: effects of playing position and competition level. J Strength Cond Res. 2015;29(6):1486–1493. doi: 10.1519/JSC.0000000000000781
- Bazyler, CD, Mizuguchi, S, Sole, CJ, et al. Jumping performance is preserved but not muscle thickness in collegiate volleyball players after a taper. J Strength Cond Res. 2018;32(4):1020–1028. doi: 10.1519/JSC.0000000000001912
- Buśko, K, Lipińska, M. A comparative analysis of the anthropometric method and bioelectrical impedance analysis on changes in body composition of female volleyball players during the 2010/2011 season. Hum Mov. 2012;13(2):127–131. doi: 10.2478/v10038-012-0013-6
- Campa, F, Piras, A, Raffi, M, et al. Functional movement patterns and body composition of high-level volleyball, soccer, and rugby players. J Sport Rehabil. 2019;28(7):740–745. doi: 10.1123/jsr.2018-0087
- Carvajal Veitia, W, Betancourt H, León S, et al. Kinanthropometric profile of Cuban women Olympic volleyball champions. MEDICC Rev. 2012;14:16–22.
- Di Pierro, F, Togni, S, Franceschi, F, et al. Effects of standardized ginkgo biloba extract complexed with phosphatidylserine (virtiva®) on physiological response to prolonged, intense physical activity. Minerva Ortop Traumatol. 2016;67:119–123.
- Di Vincenzo, O, Marra, M, Sammarco, R, et al. Body composition, segmental bioimpedance phase angle and muscular strength in professional volleyball players compared to a control group. J Sports Med Phys Fitness. 2020;60(6):870–874. doi: 10.23736/S0022-4707.20.10548-6
- dos Santos, PGMD, de Melo, TTS, de Amorim Oliveira, GT, et al. Somatótipo, composição corporal e capacidades físicas em atletas de voleibol e handebol. Rev Mackenzie Educ Física E Esporte. 2014;13:2.
- Gaurav, V. A comparative study of somatic traits and body composition between volleyball players and controls. Indian J Sci Technol. 2011;4(2):116–118. doi: 10.17485/ijst/2011/v4i2.11
- Giannopoulos, N, Vagenas, G, Noutsos, K, et al. Somatotype, level of competition, and performance in attack in elite male volleyball. J Hum Kinet. 2017;58(1):131–140.doi: 10.1515/hukin-2017-0082
- Martín-Matillas, M, Valadés, D, Hernández-Hernández, E, et al. Anthropometric, body composition and somatotype characteristics of elite female volleyball players from the highest Spanish league. J Sports Sci. 2014;32(2):137–148. doi: 10.1080/02640414.2013.809472
- Masanovic, B, Gardasevic, J, Bjelica, D. Comparative study of Anthropometric measurement and body composition between elite handball and volleyball players from the Serbian national league. Int J Morphol. 2021;39(1):287–293. doi: 10.4067/S0717-95022021000100287
- Medeiros, TH, Domingues, MR, Rombaldi, AJ. Efeitos de contraceptivo hormonal oral sobre o Grau de força e Composição Corporal de Jogadoras de Vôlei: um Estudo Piloto. Rev Bras Ciência E Mov. 2013;21(3):51–60. doi: 10.18511/0103-1716/rbcm.v21n3p51-60
- Mielgo-Ayuso, J, Zourdos, MC, Calleja-González, J, et al. Dietary intake habits and controlled training on body composition and strength in elite female volleyball players during the season. Appl Physiol Nutr Metab. 2015;40(8):827–834. doi: 10.1139/apnm-2015-0100
- Nikolaidis, PT. Body mass index and body fat percentage are associated with decreased physical fitness in adolescent and adult female volleyball players. J Res Med Sci. 2013;18(1):22–26.
- Nikolaidis, PT, Afonso, J, Clemente-Suarez, V, et al. Vertical jumping tests versus Wingate anaerobic test in female volleyball players: the role of age. Sport (Basel, Switzerland). 2016;4(1):9. doi: 10.3390/sports4010009
- NiKolainis, PT, Ziv, G, Arnon, M, et al. Physical characteristics and physiological attributes of female volleyball players—the need for individual data. J Strength Cond Res. 2012;26(9):2547–2557. doi: 10.1519/JSC.0b013e31823f8c06
- de Oliveira, JJ, Silva AS, Baganha RJ, et al. Effect of different post-activation potentiation intensities on vertical jump performance in university volleyball players. J Exerc Physiol Online. 2018;21:90–99.
- Peña, J, Moreno-Doutres, D, Coma, J, et al. Anthropometric and fitness profile of high-level basketball, handball and volleyball players./Perfil antropométrico y de aptitud física de jugadores de alto nivel de baloncesto, balonmano y voleibol. Rev Andaluza Med Del Deport. 2018;11(1):30–35. doi: 10.1016/j.ramd.2016.03.002
- Popovic, S, Bjelica, D, Jaksic, D, et al. Comparative study of anthropometric measurement and body composition between elite soccer and volleyball players [estudio comparativo de medidas antropométricas y composición corporal entre jugadores élite de fútbol y voleibol]. Int J Morphol. 2014;32(1):267–274. doi: 10.4067/S0717-95022014000100044
- Toselli, S, Campa, F. Anthropometry and functional movement patterns in elite male volleyball players of different competitive levels. J Strength Cond Res (Lippincott Williams Wilkins). 2018;32(9):2601–2611. doi: 10.1519/JSC.0000000000002368
- Vargas, SL, Kerr-Pritchett, K, Papadopoulous, C, et al. Dietary habits, menstrual Health, body composition, and eating disorder risk among collegiate volleyball players: a descriptive study. Int J Exerc Sci. 2013;6:52–62.
- Vieira, MM, Locatelli, J. Parâmetros antropométricos, da força explosiva e da agilidade em atletas de voleibol do sexo feminino. Rev Bras Prescrição E Fisiol Do Exerc. 2018;12:743–749.
- Balasas, D, Vamvakoudis E, Christoulas K, et al. The effect of beach volleyball training on running economy and VO2max of indoor volleyball players. J Phys Educ Sport. 2013;13:33–38.
- Barajas-Pineda, LT, Del-Río-Valdivia, JE, Flores-Moreno, PJ, et al. Perfil antropométrico y composición corporal de la selección mexicana varonil mayor de voleibol. Int J Morphol. 2021;39(1):90–94. doi: 10.4067/S0717-95022021000100090
- Malý, T, Malá, L, Zahálka, F, et al. Comparison of body composition between two elite women’s volleyball teams [srovnání tělesného složení dvou špičkových ženských volejbalových týmů]. Acta Univ Palacki Olomuc Gymnica. 2011;41(1):15–22. doi: 10.5507/ag.2011.002
- de Melo, AM, Siqueira, D, Martins, JA, et al. Avaliação do estado nutricional e consumo alimentar de jogadores de voleibol masculino da categoria adulta em uma cidade no interior do estado de São Paulo. RBNE-Revista Bras Nutr Esportiva. 2017;11:593–602.
- Pietraszewska, J, Burdukiewicz, A, Stachoń, A, et al. Anthropometric characteristics and lower limb power of professional female volleyball players. South African J Res Sport Phys Educ Recreat. 2015;37:99–111.
- Salgueiro, DFS, Barroso, R, Barbosa, AC, et al. Anthropometric parameters of cadets among different military sports [parámetros antropométricos de cadetes entre los diferentes deportes militares]. Int J Morphol. 2015;33(3):831–834. doi: 10.4067/S0717-95022015000300004
- Stojanović, T, Bešić, Đ, Stojanović, D, et al. The effects of short-term preseason combined training on body composition in elite female volleyball players. Anthropol Notebooks. 2018;24:85–95.
- Kutác, P, Sigmund, M. Assessment of body composition of female volleyball players of various performance levels. J Phys Educ Sport. 2017;17:556.
- Bankovic, V, Dopsaj, M, Terzic, Z, et al. Descriptive body composition profile in female Olympic volleyball medalists defined using multichannel bioimpedance measurement: rio 2016 team case study [perfil descriptivo de la composición corporal en medallistas femeninos de voleibol olímpico definido. Int J Morphol. 2018;36(2):699–708. doi: 10.4067/S0717-95022018000200699
- Bojanic, D, Ljubojevic, M, Krivokapic, D, et al. Morphological characteristics and body composition of elite volleyball players: three Montenegrin clubs with most trophies participating in European competitions. Int J Morphol. 2020;38(4):903–908. doi: 10.4067/S0717-95022020000400903
- Campa, F, Silva, AM, Talluri, J, et al. Somatotype and bioimpedance vector analysis: a new target zone for male athletes. Sustainability. 2020;12(11):4365. doi: 10.3390/su12114365
- Challoumas, D, Artemiou, A. Predictors of attack performance in high-level male volleyball players. Int J Sport Physiol Perform. 2018;13(9):1230–1236. doi: 10.1123/ijspp.2018-0125
- Copic, N, Dopsaj, M, IvanoviĆ, J, et al. Body composition and muscle strength predictors of jumping performance: differences between elite female volleyball competitors and nontrained individuals. J Strength Cond Res. 2014;28(10):2709–2716. doi: 10.1519/JSC.0000000000000468
- Malá, L, Malý, T, Záhalka, F, et al. The profile and comparison of body composition of elite female volleyball players. Kinesiol. 2010;42:90–97.
- Mala, L, Maly, T, Zahalka, F, et al. Body composition of elite female players in five different sports games. J Hum Kinet. 2015;45(1):207–215. doi: 10.1515/hukin-2015-0021
- Bisch, KL, Bosch, TA, Carbuhn, A, et al. Positional body composition of female division I collegiate volleyball players. J Strength Cond Res. 2020;34(11):3055–3061. doi: 10.1519/JSC.0000000000003808
- Stanforth, PR, Crim, BN, Stanforth, D, et al. Body composition changes among female NCAA division 1 athletes across the competitive season and over a multiyear time frame. J Strength Cond Res. 2014;28(2):300–307. doi: 10.1519/JSC.0b013e3182a20f06
- Weidauer, LA, Eilers, MM, Binkley, TL, et al. Effect of different collegiate sports on cortical bone in the tibia. J Musculoskelet Neuron Inter. 2012;12(2):68–73.
- Dobrosielski, DA, Leppert, KM, Knuth, ND, et al. Body composition values of NCAA division 1 female athletes derived from dual-energy X-Ray absorptiometry. J Strength Cond Res. 2021;35(10):2886–2893. doi: 10.1519/JSC.0000000000003213
- Esteban-García, P, Rubio-Arias, JÁ, Abián-Vicen, J, et al. Core stability and electromyographic activity of the trunk musculature in different woman’s sports. Sustainability. 2020;12(23):9880. doi: 10.3390/su12239880
- Fernández-Campos, C, Dengo, AL, Moncada-Jiménez, J. Acute consumption of an energy drink does not improve physical performance of female volleyball players. Int J Sport Nutr Exerc Metab. 2015;25(3):271–277. doi: 10.1123/ijsnem.2014-0101
- Fields, JB, Gallo, S, Worswick, JM, et al. 25-hydroxyvitamin D, Vitamin D binding protein, bioavailable 25-hydroxyvitamin D, and body composition in a diverse sample of women collegiate indoor athletes. J Funct Morphol Kinesiol. 2020;5(2):32. doi: 10.3390/jfmk5020032
- Muniz, YG, Cossio-Bolaños M, Gómez-Campos R, et al. Estimate of body fat percentage in male volleyball players: assessment based on skinfolds. J Exerc Physiol Online. 2017;20:14–24.
- Rauch, JT, Loturco, I, Cheesman, N, et al. Similar strength and power adaptations between two different velocity-based training regimens in collegiate female volleyball players. Sport (Basel, Switzerland). 2018;6(4):163. doi: 10.3390/sports6040163
- Sanfilippo, J, Krueger, D, Heiderscheit, B, et al. Dual-energy X-ray absorptiometry body composition in NCAA division I athletes: exploration of mass distribution. Sports Health. 2019;11(5):453–460. doi: 10.1177/1941738119861572
- Sesbreno, E, Dziedzic, CE, Sygo, J, et al. Elite male volleyball players are at risk of insufficient energy and carbohydrate intake. Nutri. 2021;13(5):1435. doi: 10.3390/nu13051435
- DE, A. The impact of feedback on dietary intake and body composition of college women volleyball players over a competitive season. J Strength Cond Res. 2010;24(8):2220–2226. doi: 10.1519/JSC.0b013e3181def6b9
- Balasas, D, Vamvakoudis, E, Christoulas, K, et al. Strength and body composition of amateur female volleyball players and untrained women. Phys Train. 2013;2:1307.
- Fields, JB, Merrigan, JJ, White, JB, et al. Body composition variables by sport and sport-position in elite collegiate athletes. J Strength Cond Res. 2018;32(11):3153–3159. doi: 10.1519/JSC.0000000000002865
- Valliant, MW, Emplaincourt, HP, Wenzel, RK, et al. Nutrition education by a registered dietitian improves dietary intake and nutrition knowledge of a NCAA female volleyball team. Nutrients. 2012;4(6):506–516. doi: 10.3390/nu4060506
- Woodruff, SJ, Meloche, RD. Energy availability of female varsity volleyball players. Int J Sport Nutr Exerc Metab. 2013;23(1):24–30. doi: 10.1123/ijsnem.23.1.24
- Paul, RW, Sonnier, JH, Johnson, EE, et al. Inequalities in the evaluation of male versus female athletes in sports medicine research: a systematic review. Am J Sports Med. 2022;3635465221131281:036354652211312. doi: 10.1177/03635465221131281
- McLester, CN, Nickerson, BS, Kliszczewicz, BM, et al. Reliability and agreement of various InBody body composition analyzers as compared to dual-energy X-ray absorptiometry in healthy men and women. J Clin Densitom. 2020;23(3):443–450. doi: 10.1016/j.jocd.2018.10.008
- Suarez-Arrones, L, Petri, C, Maldonado, RA, et al. Body fat assessment in elite soccer players: cross-validation of different field methods. Sci Med Footb. 2018;2(3):203–208. doi: 10.1080/24733938.2018.1445871
- Kasper, AM, Langan-Evans, C, Hudson, JF, et al. Come back skinfolds, all is forgiven: a narrative review of the efficacy of common body composition methods in applied sports practice. Nutrients. 2021;13(4):1075. doi: 10.3390/nu13041075
- Golja, P, Robič Pikel, T, Zdešar Kotnik, K, et al. Direct comparison of (anthropometric) methods for the assessment of body composition. Ann Nutr Metab. 2020;76(3):183–192. doi: 10.1159/000508514
- Graybeal, AJ, Moore, ML, Cruz, MR, et al. Body composition assessment in male and female bodybuilders: a 4-compartment model comparison of dual-energy X-ray absorptiometry and impedance-based devices. J Strength Cond Res. 2020;34(6):1676–1689. doi: 10.1519/JSC.0000000000002831
- Silva, AM, Matias, CN, Nunes, CL, et al. Lack of agreement of in vivo raw bioimpedance measurements obtained from two single and multi-frequency bioelectrical impedance devices. Eur J Clin Nutr. 2019;73(7):1077–1083. doi: 10.1038/s41430-018-0355-z
- Vaquero-Cristóbal, R, Albaladejo-Saura, M, Luna-Badachi, AE, et al. Differences in fat mass estimation formulas in physically active adult population and relationship with sums of skinfolds. Int J Environ Res Public Health. 2020;17(21):7777. doi: 10.3390/ijerph17217777