
Abstract
Objective: This study aims to characterize the molecular signatures of sacrococcygeal teratomas (SCTs). Methods: Three SCTs were analyzed with whole genome genotyping. RNA sequencing of 10 SCTs dominated by mature, immature and neuroglial elements was analyzed. Expression in SCT-samples with different elements were compared to each other and to a reference group of malignant pediatric tumors. Macrophages, T- and B-lymphocytes were detected by immunohistochemistry. Results: No chromosomal imbalances were detected. SCTs showed overexpression of genes involved in neurosignaling, DNA-binding molecules and pathways of early germ cells. Genes associated with immune effector processes were overexpressed in mature compared to immature SCTs, and immune cell infiltration was found predominantly around mature epithelial elements. Conclusion: The broad repertoire of histological elements in SCTs reflects differences in transcriptional regulation rather than differences in gene copy numbers. A paucity of immune response in immature SCTs may be a factor contributing to their uninhibited growth.
Introduction
Sacrococcygeal teratomas (SCTs) are congenital germ cell tumors with an estimated birth prevalence of 1:10.000-1:40.000 [Citation1–4]. Most tumors are diagnosed prenatally or in early childhood, but adult SCTs have been described [Citation5]. The tumors are macroscopically diverse with interspersed solid and cystic areas. SCTs are generally considered benign and are classified as having mature or immature histopathology. Immature teratomas have been found to have higher prenatal growth rates, increasing the risk of morbidity and mortality due to premature birth [Citation6]. SCTs may contain elements of malignant neoplasms, in particular yolk sac tumor or embryonal carcinoma, and incomplete surgical excision may require adjunctive chemotherapy [Citation7]. In nonmalignant cases, treatment consists of complete surgical resection, including the coccyx. Lack of coccygeal resection has been associated with a higher risk of recurrence [Citation8], which has led to a theory that SCTs originate from blastemal cells near the caudal bud of the fetus [Citation9]. Others have proposed that SCTs derive from primordial germ cells with aberrant migration during early embryological stages [Citation7].
Little is known about the molecular features of SCT, and their pathogenesis remains unclear. Studies have predominantly shown normal karyotypes in pediatric SCTs [Citation10,Citation11], although a few cases have shown chromosomal abnormalities [Citation12–15]. Expression of a subset of stem cells markers (NANOG, OCT4, SSEA-4 and nestin) has been found in SCT [Citation9]. However, no study has previously studied the global gene expression of these tumors. With the present study, we aimed to analyze the genomic stability of SCTs, to compare gene expression signatures of SCTs to malignant pediatric tumors, and to identify differences in gene expression among different histological SCT elements.
Material and methods
Patient and tumor material
Formalin fixed paraffin embedded (FFPE) tumor sections of 10 SCTs were subjected to hematoxylin-eosin staining and histopathological review by two pathologists (I.K. and D.G.). Grading of immaturity was performed on a three-tiered scale (G1-G3) based on the quantity of immature neuroepithelium [Citation16]. From this series, 10 tumors with well demarcated areas containing at least two of the three following components were selected for molecular analysis: mature mixed epithelial/mesenchymal (M), mature neuroglial (N), and immature neuroectodermal (I) elements. All tumors were resected during early infancy. Clinical information is summarized in . Two to four areas from each SCT were selected and microdissected to yield 3 × 3 - 5 × 5 mm2 regions comprising homogeneous mature, immature and neuroglial elements, respectively. These areas were subject to DNA and RNA extractions resulting in 31 samples. A total of 23 samples were extracted from immature SCTs (mature and immature components) and eight samples were extracted from mature SCTs. The samples were divided into three different groups based on their most prominent (>80% section area) histological component, resulting in 15 samples dominated by M-type histology, 8 with N-type and 8 with I-type histology. A cohort of malignant pediatric primary tumors [Citation17] was used as a reference group for gene expression analysis, including six samples from three neuroblastomas (NB; 1-3 samples/tumor), 14 samples from three Wilms tumors (WT; 1-9 samples/tumor) and 11 samples from two rhabdomyosarcoma (RMS; 3 and 8 samples/tumor). These malignant tumors were chosen because they have previously been extensively characterized with respect to gene expression and are more cellularly homogeneous than would be samples of most normal tissues, thus providing a stable set of reference points. DNA and RNA were extracted from the selected areas of paraffin embedded formalin fixed SCTs with the AllPrep DNA/RNA FFPE kit (Qiagen) according to the manufacturer’s recommendations.
Table 1. Patient and tumor characteristics. Samples taken from mature mesynchymal/epithelial (M), mature neuroglial (N) and immature neuroectodermal (I) areas.
Whole genome genotyping with single nucleotide polymorphism (SNP) array
Four samples each from patients 1, 2 and 3 () were analyzed with SNP array using the OncoScan array platform (Affymetrix Inc., Santa Clara, CA) at the Swegene Center for Integrative Biology (SCIBLU) at Lund University, Sweden. The OncoScan Console software, version 1.3.0.39 (Affymetrix Inc.) was used to convert the obtained CEL-files to OSCHP-TuScan files using the OncoScan.FFPE.n33.r1.REF_MODEL reference file. The OSCHP-TuScan files were examined to detect possible aberrations with the Nexus Express software for OncoScan, version 3.1. Investigation of the SNP-array data used the built- in functions in the software and by visual inspection of the copy number and allele frequency plots.
Gene expression analyses
RNA was analyzed with AmpliSeq human transcriptome sequencing (Thermo Fisher Scientific) and processed with the Torrent suit server (Ion Torrent) using the AmpliSeqRNA tool at SciLife Uppsala, Sweden. Data from normalized reads for protein coding genes (18,581) were analyzed and visualized with the Qlucore Omics Explorer Software version 3.3 (Qlucore AB). The expression values were log2-transformed, and noise was removed based on variance/maximal variance-ratio. Principal component analysis (PCA) was based on the 5000 most variable genes (variance/maximal variance= 0.38), while all other global gene expression analyses were based on 15,650 variables (variance/maximal variance= 0.1). Hierarchical clustering analyses with Euclidean metric and the average linkage criteria as well as PCA were performed on data scaled by setting the mean to 0 and variance to 1. The global gene expression profile of the SCTs was compared to the reference tumors (RMS, WT and NB) by performing a multigroup comparison (F-test; p-value =3.0 × 10⁻¹², q-value = 7.3 × 10⁻¹¹) and the result was visualized as a heat map in Qlucore. Lists of genes with similar expression profile in any of the four different tumor types were extracted and analyzed for correlation with signaling pathways with the gene functional annotation tool in the Database for Annotation, Visualization and Integrated Discovery (https://david.ncifcrf.gov/). Pathways with an enrichment score above two were displayed in the figure.
Gene set enrichment analysis (GSEA) was performed to investigate the correlation to specific pathways of differentially expressed genes when comparing immature and mature SCTs. The analysis was performed with the c5.bp.v6.2.symbols.gmt file (http://www.broad.mit.edu/gsea/msigdb) according to the manufacturer’s instructions [Citation18]. A list of 29 genes with importance for the germ cell differentiation processes was obtained from Irie et al. [Citation19]. The expression of these genes was investigated in SCTs and the reference tumors by performing an unsupervised clustering analysis. A t-test elucidated the genes with the highest and lowest expression in SCTs compared to the reference tumors.
Immunohistochemistry
Immunohistochemistry was performed by standard protocol. Tissue sections were incubated for 60 min with following primary antibodies: CD3 1:300 (SP7, ab16669, Abcam), CD20 1:200 [L26, ab9475, Abcam], and CD68 1:400 (Clone KPI, M0814, DAKO) diluted in PBS containing 5% normal goat serum (005-000-001, Jackson Immuno Research). The tissue staining for CD3 was visualized using BrightVision Poly-HRP-Anti rabbit RTU (DPVR55HRP, AH Diagnostics) for 30 min, and for CD20 and CD68 using BrightVision Poly-HRP-Anti mouse RTU (DPVMR55HRP, AH Diagnostics). The sections were analyzed in 10x low power field (LPF) and the staining was considered positive if ≥ 30 cells with circumferential membranous/cytoplasmic staining were present per LPF.
Results
No allelic imbalances were detected in SCTs
DNA from four different areas, with distinct histology, from three SCTs were analyzed with high resolution SNP-array to investigate their whole genome copy number state and the possible presence of copy number neutral imbalances. However, no deviance from the normal diploid state was detected in any of the 12 samples despite detailed analyses of the data ().
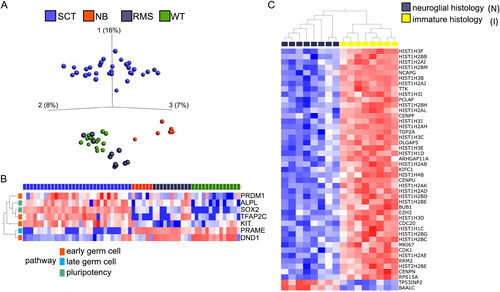
Figure 1. A, Principal component analyses (PCA) based on the 5000 most variable genes after global gene expression analysis on 31 samples from 10 cases of SCT (blue), six samples from 3 NBs (red), 11 samples from 2 RMSs (grey) and 14 samples from 3 WTs (green). B, Targeted analysis of genes involved in germ cell differentiation. Heat map illustrating the genes in with most deviant expression in SCTs compared to the reference tumors (t-test, p = 0.0001, q = 0.0003). C, Heat map displaying the 45 genes showing the most significant difference in expression, when comparing SCT samples with neuroglial and immature histology (p-value = 1.06x10⁻⁵, q-value = 0.003). B and C, genes with high expression are depicted in red while genes with low expression are depicted in blue. See online version for color images.
SCTs present a distinct global gene expression pattern
The gene expression of 31 samples from 10 SCTs was compared to a reference group consisting of samples from the three of the most common malignant solid extracranial pediatric tumors: WT, NB and RMS. As expected, the global gene expression of the SCTs deviated significantly from the reference tumors (). SCTs displayed an enrichment of genes primarily involved in DNA-binding and transcriptional regulation, such as genes encoding zinc finger proteins. Although the gene expression signature of the SCTs was globally different compared to the reference tumors, some enriched signaling pathways were shared between SCTs and the reference tumors (). SCTs, WTs and RMSs all demonstrated upregulation of genes enriched in Hippo/WNT-signaling pathways. SCTs and NBs both displayed high expression of genes correlated to neuronal pathways and microtubule organization. SCTs, NBs and WTs displayed low expression of genes involved in myogenesis, when compared to RMSs. We conclude that SCTs deviated in gene expression from the reference group in accordance with expectations from previous studies of the biology of the reference tumors, validating the quality of our SCT gene expression dataset.
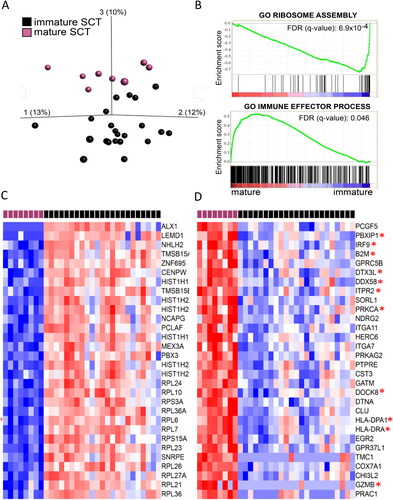
Figure 2. A, Principal component analyses of 31 samples from SCT (8 from mature SCTs in purple and 23 from immature SCTs in black) based on 15650 genes (variance/maximal variance= 0.1). B, Examples of enrichment plots generated from gene set enrichment analysis comparing mature SCTs with immature SCTs. C and D, Heat maps based on supervised hierarchal cluster analysis, displaying the 30 most differentially expressed genes when comparing mature and immature SCTs. The variables are listed according to fold change. * indicates genes correlating with immune effector processes. C, Genes with high expression in immature SCTs (t-test, p-value = 1.5x10⁻⁷, q = 8.7x10⁻⁵). D, Genes with high expression in mature SCTs (t-test, p-value= 2.5x10⁻⁶, q = 0.0014). See online version for color images.
To investigate the stage of development and origin of SCTs, a targeted analysis was performed of 29 genes with importance for germ line differentiation categorized into early and late germ line differentiation, maintenance of pluripotency, spermatogenesis and meiosis, respectively [Citation19]. From the perspective of these categories, there was no clear difference in gene expression on comparison between the SCTs and the malignant reference tumors. However, from the perspective of individual genes, the SCTs primarily displayed high expression of genes involved in early germ cell differentiation (PRDM1, TFAP2C and KIT) and in maintenance of pluripotency (ALPL and SOX2) (). Interestingly, the only other analyzed gene involved in early germ cell processes (DND1) presented a significantly lower expression in the SCTs compared to the reference tumors.
Gene expression across histological subtypes
The global gene expression patterns of SCT-samples with predominantly mature mesenchymal/epithelial (M), mature neuroglial (N) or immature (I) histology were then compared to each other. The only significant difference was seen when comparing the most differentially expressed genes in the I and N histological groups (45 genes; p = 1.06*10−5, q = 0.003; ). Immature areas displayed a striking overexpression of genes encoding different histone subunits (26 of 43 overexpressed genes in group I). In addition, EZH2, another gene involved in chromatin modification, was up-regulated in the immature areas.
Comparison of gene expression in mature and immature SCTs
The global gene expression of mature and immature teratomas differed significantly (). Immature teratomas showed a differential enrichment pattern in genes encoding ribosomes, histones, cytoskeleton and transcriptional regulators (). Samples from mature SCTs exhibited a significantly higher activation of immune effector processes than did samples from immature SCTs, including both the innate and adaptive immune systems ( and ). Of the 30 most enriched genes in mature compared to immature teratomas, 14 genes were involved in immune processes ().
Table 2. Enriched signaling pathways in SCTs with mature histology compared to immature samples. The ten gene ontology pathways with the highest normalized enrichment scores (NES) are shown in the table (false discovery rate q-value < 0.05, nominal p-value <0.01).
Detection of immune cells across subtypes and histological elements
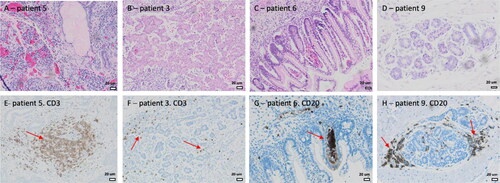
To address the finding that mature SCTs exhibited an enrichment of genes related to various immune effector processes, we stained immature and mature SCTs with antibodies recognizing CD68+ macrophages (), CD3+ T-lymphocytes and CD20+ B-lymphocytes (). CD68 positive cells were present in all SCTs. A total of 8/10 SCTs had areas with > 30 cells/LPF positive for CD3, while 5/10 tumors had areas positive for CD20 positive cells according to the same definition. There were no detectable differences between mature and immature SCTs regarding the overall number of dispersed/single immune cells per sample, evaluated by different attempts of scoring cells per high-power field (data not shown). CD68+ cells were very unevenly distributed but showed the highest concentration of cells in open spaces between the neuroglial tissue elements (), while positive areas of CD3+ and CD20+ cells were primarily found surrounding the epithelium of cystic structures and glandular elements (). In conclusion, clusters of CD68/CD3/CD20 positive cells were generally confined to mature areas of SCTs, but this applied equally to mature and immature SCTs.
Figure 3. CD68 immunohistochemical staining. A, Clustered CD68 positive cells in mature area of immature teratoma (Patient 4). Scale bar 200 µm. B, Typical clustering of CD68 positive cells in clefts between neuroglial cells, 10x low power field, scale bar 60 µm.
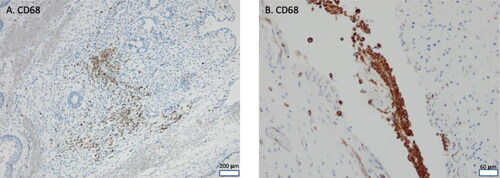
Figure 4. Immunohistochemical identification of lymphocytes in and around glandular and acinar epithelial elements in SCTs. A-D, Hematoxylin-eosin (HE) staining. E-H, Immunohistochemical staining for CD3+ T-lymphocytes (E and F) and CD20+ B-lymphocytes (G and H) show clusters in and around epithelial glandular and tubular structures (red arrows).
Discussion
It has been suggested that SCTs derive from primordial germ cells (PGCs), which are thought to arise in the fetal epiblast during the second week of gestation [Citation7,Citation20]. From week 3-4 of gestation, PGCs have been observed in the yolk sac wall, and from here they migrate through the hindgut to the genital ridges, which marks the end of the PGC stage [Citation20]. In line with previous studies [Citation9], our results show a high expression of certain genes involved in early germ cell differentiation and pluripotency. The transcription profile was found across all histological subtypes. Compared to the reference group of tumors, SCTs showed a high expression of SOX2, which encodes a protein required for stem-cell maintenance in central nervous tissue. This protein combines with OCT4 to form a transcription factor that controls a number of genes required for embryological development [Citation21]. We also found increased expression of genes normally active in early germ cell development, i.e. PRMD1, TFAP2C, and KIT [Citation19]. SOX2 regulates KIT-expression in PGCs and is essential for survival and continued proliferation [Citation22]. The transcriptional regulator PRMD1 (BLIMP1) is a signature gene for germ cell-commitment in active migratory and gonadal PGCs [Citation20]. It induces TFAP2C, which further regulates germ cell specific genes and inhibits somatic differentiation [Citation23]. PRDM1, TFAP2C and KIT are regulators of hematopoietic stem cells, antibody secreting plasma cells and formation of the placenta, and may therefore be expressed throughout fetal development [Citation24–26]. However, the combined expression is generally considered to reflect a germ cell profile and the expression decreases during the initial primordial germ cell stage [Citation19,Citation27].
Notably, we found a decreased expression of DND1 in SCTs compared to the reference tumors. The DND1 protein is an instrumental component of micro-RNA (miRNA) regulation, by protecting mRNAs from miRNA-mediated suppression [Citation28]. DND1 is crucial for normal germ cell development, and mutation in this gene has been linked to gonadal teratoma formation in certain mice strains [Citation29]. Our findings thus support the theory that SCTs derive from very early germ cells formed at the primitive streak during gastrulation and indicates that miRNA dysregulation could be a key element in SCT pathogenesis.
The molecular signature in immature areas of sacrococcygeal teratomas showed a remarkably high expression of histone genes when compared to mature neuroglial areas. Particularly, genes encoding parts of the H2 subunit were highly enriched. Histones constitute the main core of nucleosomes, which form the repeating units of chromatin. The chromatin is condensed during the metaphase of the cell-cycle, and the high histone expression may reflect an increased cell turn-over in immature areas [Citation30]. However, even when compared to the control group consisting of fast-growing, malignant pediatric tumors, genes encoding histones and other DNA-binding proteins were relatively overexpressed in immature areas of sacrococcygeal teratomas. A histone family signature with pathways related to cell cycle and DNA replication has previously been correlated with increased survival in cervical cancer patients [Citation31]. The authors proposed a DNA-protecting role of the increased histone expression and found a correlation between high histone expression and reduced DNA damage. In SCTs, DNA-protection may explain the occasional occurence of malignancy and the paucity of chromosomal abnormalities found in this and other studies in spite of the high cell turn-over in immature areas [Citation10]. The general overexpression of DNA-binding proteins and transcription factors compared to other pediatric tumors may also reflect the broad repertoire of histological elements in SCTs.
Mature SCTs showed a remarkable enrichment of genes involved in immune signaling when compared to immature SCTs. Among the 30 most differentially expressed genes in mature vs. immature SCTs, 14 were involved in immune processes. The immune system develops gradually during childhood, starting during gestation and becoming fully developed at school age. Already before mid-gestation, lymphocytes and monocytes are present and to some extent functional, whereas neutrophils are not fully functional until after gestational week 31 [Citation32]. In the present study, all children with immature SCTs were born prematurely (GA 28-34), whereas all children with mature SCTs were born at term (GA 37-40). Hence, the contrast in immune signaling between mature and immature SCTs may reflect the different gestational ages in the groups. It is possible, however, that the gradual maturation of the immune system plays a role in the maturation process of SCTs. It could explain why immature SCTs are less common in children born at term than in prematurely born children [Citation6]. In order to further assess this hypothesis, it would be of interest to collect a larger patient cohort to compare the immune response in children born at different gestational ages within the groups of mature and immature SCTs.
Both mature and immature SCTs contained CD68+ cells (macrophages), CD3+ cells (T-lymphocytes) and CD20+ cells (B-lymphocytes). While the frequency of dispersed immune cells did not differ between mature and immature SCTs or different elements, we found an increased infiltration with patches of lymphocytes around mature structures, in particular glandular and ductal elements, in both mature and immature SCTs. The difference in expression of genes involved in immune effector processes may be explained by an overall higher prevalence of such mature structures in mature compared to immature SCTs. Thus, the enrichment of immune signaling in mature SCTs could be due to SCTs recapitulating the recruitment of resident immune cells to normal postnatal tissues, consistent with the concentration of T (CD3+) and B (CD20+) cells near epithelial elements. However, we cannot rule out the possibility that immune cells associated with immature/mature SCTs are functionally different and thereby might either prevent or promote SCT growth and malignant conversion. Indeed, depending on the tumor microenvironment immune cells can, simplified, have either a pro-inflammatory or anti-inflammatory phenotype [Citation33,Citation34]. Future studies are warranted to determine the exact phenotype and role of the infiltrating macrophages and other immune cells in SCTs. Finally, we do not know the relative contribution of infiltrating immune cells versus neoplastic tumor cells to the differences observed in immune effecter gene expression.
Summary
In conclusion, we found SCTs to be genetically stable tumors with a differential molecular profile compared to other pediatric solid tumors. We found expression in SCTs of genes involved in transcriptional regulation, coding for DNA binding proteins as well as proteins regulating miRNA activity of importance for early germ cell development. Comparative analysis of mature and immature teratomas showed high expression of genes involved in immune processes in mature teratomas. The study is limited by the low patient number, and further studies should include mature and immature SCTs of comparable gestational ages. Molecular profiling of SCTs has not been reported previously and the study is strengthened by the number of specimens per tumor, and the multimodal approach of analysis.
Disclosure stattement
The authors declare no conflicts of interests
Availability of data
The data that support the findings of this study are available from the corresponding author upon reasonable request.
References
- Derikx JPM, De Backer A, van de Schoot L, Aronson DC, de Langen ZJ, van den Hoonaard TL, Bax NMA, van der Staak F, van Heurn LWE. Long-term functional sequelae of sacrococcygeal teratoma: a national study in The Netherlands. J Pediatr Surg. 2007;42(6):1122–6. doi:https://doi.org/10.1016/j.jpedsurg.2007.01.050.
- Forrester MB, Merz RD. Descriptive epidemiology of teratoma in infants, Hawaii, 1986-2001. Paediatr Perinat Epidemiol. 2006;20(1):54–8. doi:https://doi.org/10.1111/j.1365-3016.2006.00678.
- Hambraeus M, Arnbjornsson E, Borjesson A, Salvesen K, Hagander L. Sacrococcygeal teratoma: A population-based study of incidence and prenatal prognostic factors. J Pediatr Surg. 2016;51(3):481–5. doi:https://doi.org/10.1016/j.jpedsurg.2015.09.007.
- Pauniaho S-L, Heikinheimo O, Vettenranta K, Salonen J, Stefanovic V, Ritvanen A, Rintala R, Heikinheimo M. High prevalence of sacrococcygeal teratoma in Finland - a nationwide population-based study. Acta Paediatr. 2013;102(6):e251–e256. doi:https://doi.org/10.1111/apa.12211.
- Audet IM, Goldhahn RT, Jr., Dent TL. Adult sacrococcygeal teratomas. Am Surg. 2000;66(1):61–5.
- Yoneda A, Usui N, Taguchi T, Kitano Y, Sago H, Kanamori Y, Nakamura T, Nosaka S, Oba MS. Impact of the histological type on the prognosis of patients with prenatally diagnosed sacrococcygeal teratomas: the results of a nationwide Japanese survey. Pediatr Surg Int. 2013;29(11):1119–25. doi:https://doi.org/10.1007/s00383-013-3384-7.
- Huddart SN, Mann JR, Robinson K, Raafat F, Imeson J, Gornall P, Sokal M, Gray E, McKeever P, Oakhill A, Children's Cancer Study Group, et al. Sacrococcygeal teratomas: the UK children's cancer study group's experience. I. Neonatal. Pediatr Surg Int. 2003;19(1-2):47–51. doi:https://doi.org/10.1007/s00383-002-0884-2.
- De Backer A, Madern GC, Hakvoort-Cammel FG, Haentjens P, Oosterhuis JW, Hazebroek FW. Study of the factors associated with recurrence in children with sacrococcygeal teratoma. J Pediatr Surg. 2006;41(1):173–81. discussion 173-181. doi:https://doi.org/10.1016/j.jpedsurg.2005.10.022.
- Busch C, Oppitz M, Wehrmann M, Schweizer P, Drews U. Immunohistochemical localization of nanog and Oct4 in stem cell compartments of human sacrococcygeal teratomas. Histopathology. 2008;52(6):717–30. doi:https://doi.org/10.1111/j.1365-2559.2008.03017.x.
- Bussey KJ, Lawce HJ, Olson SB, Arthur DC, Kalousek DK, Krailo M, Giller R, Heifetz S, Womer R, Magenis RE, et al. Chromosome abnormalities of eighty-one pediatric germ cell tumors: sex-, age-, site-, and histopathology-related differences–a Children's Cancer Group study. Genes Chromosom Cancer. 1999;25(2):134–46. doi:https://doi.org/10.1002/(SICI)1098-2264(199906)25:2<134::AID-GCC9>3.0.CO;2-Y.
- Hoffner L, Deka R, Chakravarti A, Surti U. Cytogenetics and origins of pediatric germ cell tumors. Cancer Genet Cytogenet. 1994;74(1):54–8. doi:https://doi.org/10.1016/0165-4608(94)90029-9.
- Banait N, Fenton A, Splitt M. Cornelia de Lange syndrome due to mosaic NIPBL mutation: antenatal presentation with sacrococcygeal teratoma. BMJ Case Rep. 2015;2015:bcr2015211006. Published 2015 Aug 14. doi:https://doi.org/10.1136/bcr-2015-211006.
- Batukan C, Ozgun MT, Basbug M, Caglayan O, Dundar M, Murat N. Sacrococcygeal teratoma in a fetus with prenatally diagnosed partial trisomy 10q (10q24.3->qter) and partial monosomy 17p (p13.3->pter). Prenat Diagn. 2007;27(4):365–8. doi:https://doi.org/10.1002/pd.1653.
- Chen C-P, Cheng P-J, Chang S-D, Lee Y-X, Shih J-C, Chern S-R, Wu P-S, Su J-W, Chen Y-T, Hsieh AH-M, et al. Ring chromosome 21 presenting with sacrococcygeal teratoma: prenatal diagnosis, molecular cytogenetic characterization and literature review. Gene. 2013;522(1):111–6. doi:https://doi.org/10.1016/j.gene.2013.03.064.
- Le Caignec C, Winer N, Boceno M, Delnatte C, Podevin G, Liet JM, Quere MP, Joubert M, Rival JM. Prenatal diagnosis of sacrococcygeal teratoma with constitutional partial monosomy 7q/trisomy 2p. Prenat Diagn. 2003;23(12):981–4. doi:https://doi.org/10.1002/pd.742.
- Gonzalez-Crussi F, Winkler RF, Mirkin DL. Sacrococcygeal teratomas in infants and children: relationship of histology and prognosis in 40 cases. Arch Pathol Lab Med. 1978;102(8):420–5.
- Karlsson J, Valind A, Holmquist Mengelbier L, Bredin S, Cornmark L, Jansson C, Wali A, Staaf J, Viklund B, Øra I, et al. Four evolutionary trajectories underlie genetic intratumoral variation in childhood cancer. Nat Genet. 2018;50(7):944–50. doi:https://doi.org/10.1038/s41588-018-0131-y.
- Subramanian A, Tamayo P, Mootha VK, Mukherjee S, Ebert BL, Gillette MA, Paulovich A, Pomeroy SL, Golub TR, Lander ES, et al. Gene set enrichment analysis: a knowledge-based approach for interpreting genome-wide expression profiles. Proc Natl Acad Sci USA. 2005;102(43):15545–50. doi:https://doi.org/10.1073/pnas.0506580102.
- Irie N, Weinberger L, Tang WWC, Kobayashi T, Viukov S, Manor YS, Dietmann S, Hanna JH, Surani MA. SOX17 is a critical specifier of human primordial germ cell fate. Cell. 2015;160(1-2):253–68. doi:https://doi.org/10.1016/j.cell.2014.12.013.
- Tan H, Tee WW. Committing the primordial germ cell: An updated molecular perspective. WIREs Syst Biol Med. 2019;11(1):e1436. doi:https://doi.org/10.1002/wsbm.1436.
- Zhang S, Cui W. Sox2, a key factor in the regulation of pluripotency and neural differentiation. World J Stem Cells. 2014;6(3):305–11. doi:https://doi.org/10.4252/wjsc.v6.i3.305.
- Campolo F, Gori M, Favaro R, Nicolis S, Pellegrini M, Botti F, Rossi P, Jannini EA, Dolci S. Essential role of Sox2 for the establishment and maintenance of the germ cell line. Stem Cells. 2013;31(7):1408–21. doi:https://doi.org/10.1002/stem.1392.
- Schafer S, Anschlag J, Nettersheim D, Haas N, Pawig L, Schorle H. The role of BLIMP1 and its putative downstream target TFAP2C in germ cell development and germ cell tumours. Int J Androl. 2011;34(4 Pt 2):e152discussion e158-159. doi:https://doi.org/10.1111/j.1365-2605.2011.01167.x.
- Fu SH, Yeh LT, Chu CC, Yen BL, Sytwu HK. New insights into Blimp-1 in T lymphocytes: a divergent regulator of cell destiny and effector function. J Biomed Sci. 2017;24(1):49 doi:https://doi.org/10.1186/s12929-017-0354-8.
- Kuckenberg P, Kubaczka C, Schorle H. The role of transcription factor Tcfap2c/TFAP2C in trophectoderm development. Reprod Biomed Online. 2012;25(1):12–20. doi:https://doi.org/10.1016/j.rbmo.2012.02.015.
- Thorén LA, Liuba K, Bryder D, Nygren JM, Jensen CT, Qian H, Antonchuk J, Jacobsen S-EW. Kit regulates maintenance of quiescent hematopoietic stem cells. J Immunol. 2008;180(4):2045–53. doi:https://doi.org/10.4049/jimmunol.180.4.2045.
- Sugawa F, Araúzo-Bravo MJ, Yoon J, Kim K-P, Aramaki S, Wu G, Stehling M, Psathaki OE, Hübner K, Schöler HR, et al. Human primordial germ cell commitment in vitro associates with a unique PRDM14 expression profile. Embo J. 2015;34(8):1009–24. doi:https://doi.org/10.15252/embj.201488049.
- Kedde M, Strasser MJ, Boldajipour B, Oude Vrielink JAF, Slanchev K, Le Sage C, Nagel R, Voorhoeve PM, van Duijse J, Ørom UA, et al. RNA-binding protein Dnd1 inhibits microRNA access to target mRNA. Cell. 2007;131(7):1273–86. doi:https://doi.org/10.1016/j.cell.2007.11.034.
- Gu W, Mochizuki K, Otsuka K, Hamada R, Takehara A, Matsui Y. Dnd1-mediated epigenetic control of teratoma formation in mouse. Biol Open. 2018;7(1) doi:https://doi.org/10.1242/bio.032318.
- Marino-Ramirez L, Kann MG, Shoemaker BA, Landsman D. Histone structure and nucleosome stability. Expert Rev Proteomics. 2005;2(5):719–29. doi:https://doi.org/10.1586/14789450.2.5.719.
- Li X, Tian R, Gao H, Yang Y, Williams BRG, Gantier MP, McMillan NAJ, Xu D, Hu Y, Gao Y, et al. Identification of a histone family gene signature for predicting the prognosis of cervical cancer patients. Sci Rep. 2017;7(1):16495 doi:https://doi.org/10.1038/s41598-017-16472-5.
- Ygberg S, Nilsson A. The developing immune system - from foetus to toddler. Acta Paediatr. 2012;101(2):120–7. doi:https://doi.org/10.1111/j.1651-2227.2011.02494.x.
- Hagerling C, Casbon AJ, Werb Z. Balancing the innate immune system in tumor development. Trends Cell Biol. 2015;25(4):214–20. doi:https://doi.org/10.1016/j.tcb.2014.11.001.
- Elinav E, Nowarski R, Thaiss CA, Hu B, Jin C, Flavell RA. Inflammation-induced cancer: crosstalk between tumours, immune cells and microorganisms. Nat Rev Cancer. 2013;13(11):759–71. doi:https://doi.org/10.1038/nrc3611.