ABSTRACT
This paper analyzes the management influence of apple growers to reduce income risk under homogenous production and market conditions. Statistical moments including mean, standard deviation, and skewness were employed to study the differences between farms referring to income variables based on full cost principle. The empirical results of 12 farms based on four-year period data of 445 orchard records suggest that farm management had a vital influence on all three statistical moments. On successful farms an increase of mean values was correlated with less negative asymmetry and significantly reduced variance of returns. High investment in preharvest labor hours was relevant for success in this perennial production system.
INTRODUCTION
Fruit growing in industrialized countries is extremely capital and labor intensive. There is a strong need to improve the level of entrepreneurship (CitationSmit, 2004; CitationLauwere, 2005). Most farms are facing an increasing risk of failing to achieve economic viability in the long run, despite the fact that the average size per farm is increasing constantly. This is indicated by a growing portion of farms not bringing returns enough to replace depreciable assets (CitationGroot, 2000). Labor income on most farms is far below that of comparable small and medium enterprises in nonagricultural industries (CitationPerillat et al., 2004). This situation is challenging farmers to implement an effective income risk management.
Not all farms are struggling economically. Empirical studies, based on annual accountancy of fruit farms in Germany (CitationGörgens, 2001) and the United States (CitationWhite et al., 1999), found a wide variability of labor income between comparable farms. Differences between fruit farms in terms of production costs and returns are reported by CitationMeli (1991) for Switzerland and by CitationLang et al. (1998) and CitationSamonati (1999) for Italy. However, there is a rather poor understanding concerning which management practices at the farm level are related to successful labor income. Some explanation can be taken from studies that demonstrate how sensitive a single orchard reacts to variation of cultivation practices. For the case of fruit thinning CitationHester and Cacho (2003) demonstrated with a bio-economic model that small variation of manual practice influences the amount and quality of fruits significantly. This has a relevant economic impact, since small changes in average amount and quality of harvested apples affect the cash flow over the life span of a modern apple orchard very significantly, as CitationMouron and Carint (2001) have shown using a full cost model. Several crop simulations also underline the narrow pathway to economic success for apple growers (CitationWinter, 1976; CitationEhinger, 1989; CitationHinman et al. 1992; CitationO'Rourke, 1994; CitationHinman et al., 1998; CitationGlover et al., 2002).
Although the sensitivity of a single orchard lends support to the observed differences between farms and the risk of this business in general, a farm manager needs rules to manage the whole set of orchards belonging to the farm. Therefore, successful income risk management at the farm level might be linked to an understanding of risk, represented by the distribution of income among the orchards. As argued by CitationKeating and McCown (2001), in practice, the individual field is the main managerial unit. Analyzing data of all individual orchards may contain the key to the variability in the overall farm income (G.B. White from Cornell University in Ithaca NY, personnel communication, 2005). Statistical moment-based approaches including the analysis of how mean values (M) are correlated with second and third statistical moments (i.e., standard deviation and skewness), initialized by the Nobel laureate Harry CitationMarkowitz (1952), has been a popular methodology in the academic and practical world to optimize financial risk. For farm management purposes, recent research used statistical moment-based approaches to investigate the effect of technological change on lower income risk. For example in the case of genetically improved crop varieties several authors found evidence that technological change contributes to increase expected profit (M) while reducing the risk exposure indicated by lowering the variance (CitationAntle and Chrissman, 1990; CitationTraxler et al. 1995; CitationKim and Chavas, 2003). The same effects are reported for adoption of a new cover crop fallow system (CitationLangyintuo et al., 2005).
This study examines the management influence to reduce income risk for fruit growers. Therefore we analyzed the labor income of all productive apple orchards of a homogenous group of fruit farms over a four-year period. The farms were producing within the same growing and market conditions and were using the same production technologies. Thus, the differences between the farms can be considered to be due to differences in their management influence. A statistical moment profile, including mean, standard deviation, and skewness, represents the income risk structure at farm level. The data analysis focuses on the following research questions: (a) What does the income risk structure of successful farms look like? (b) Which income variables of the production process contribute significantly to the observed income risk structure? (c) What does the statistical moment profile of these key variables look like?
The paper is structured as follows: The next section defines the variables of income analysis based on full cost principle and introduces the measures of income risk based on statistical moments. The empirical results then follow. The results are discussed referring to management influence on mean, standard deviation, and skewness of returns at the farm level. Conclusions for practical income risk management are presented in the final section.
METHODS
Assessing Management Influence on Income Risk
Assuming homogenous boundary conditions, as described in the next subsection, the differences between farms, regarding their income, can be considered to be due to differences in their farm management. We define farm management as the farmer's decisions regarding inputs (e.g., fertilizer, pesticides, labor) and cultivar mix (i.e., choice of apple cultivars). In this study, farm management refers to costs of preharvest, harvest, and postharvest activities, which in turn has an influence on the labor income. Details about the recorded activities can be taken from Appendix A.
Since the recorded data are based on individual orchards we were able to analyze not only the mean but also the second and third statistical moment (i.e., standard deviation and skewness) of the income variables per farm. Thus, for each farm a statistical moment profile was computed. These profiles were used to represent the income risk structure of the farms. Regarding the labor income we interpreted the three statistical moments as expected, unknown, and dread risk, according to recent risk research (CitationGigerenzer and Fiedler, 2006, unpublished data). This risk definition is based on the following assumptions:
-
Mean (M) as risk measure: M (i.e., arithmetic average) is a measure of the central tendency referring to the average income among all orchards of a farm over the observed period. The percentage of farms not reaching a minimum income target was taken to represent the risk of failing in economic viability. This interpretation of M as expected risk refers to the safety first criterion formulated first by CitationRoy (1952).
-
Standard deviation (s) as risk measure: The s shows the variation level of the single data. Increase in s raises the probability that the labor income from a certain orchard in a certain year is relatively far from the expected M of the total apple production on a farm. The higher the variation level, the less is known. Thus, s represents the unknown risk. High income variability means that a farm is exposed to the risk not to be solvent sufficiently in a certain year. If s was bigger than 15 CHF/h, we considered the unknown risk on a farm as serious.
-
Skewness as risk measure: If labor income is not normally distributed, a negative skewness informs us about an asymmetrical distribution to the undesired side. In this case, labor incomes below the median show higher deviations from the median than incomes above the median. It indicates that on a farm the management was not able to limit the damage on certain orchards in certain years. Some extreme bad cases occurred and thus the farm was exposed to dread risk.
Selecting Farms of Homogenous Boundary Conditions
Twelve fruit farms producing fresh apples (Malus x domestica Borkh.) under highly homogenous boundary conditions were selected out of 25 fruit farms belonging to the economic data panel of the Swiss Federal Research Station for Fruit-Growing, Viticulture and Horticulture in Wädenswil, Switzerland. The boundary conditions concern location, production constraints, farm structure, education, and data recording. The farms were located in the flatter regions of Eastern and Central Switzerland. All apple orchards were planted on good sites for fruit growing according to the land assessment system for fruit crops in Switzerland (CitationFAW, 1998). The production constraints include two criteria. First, the farms had to be certified for integrated fruit production (IFP) according to the Swiss environmental program (CitationIP-Suisse, 2003). IFP limits pesticide and fertilizer inputs and sets several production rules. Second, the farms were selling their apples to regional wholesalers who mainly deliver to Swiss supermarkets. Thus the farms were subject to the same market demand of apple cultivars and had the same quality-price conditions. All farms are specialized fulltime family operations where the main farm income is fruit production. Fresh apple was the major fruit type covering on average 80% (M = 7.2 ha/farm) of the total area planted with fruit orchards. presents the farm-structure parameters of the selected farms. Even though the farms differ in the number of orchards and other structure parameters (), a comparison of the farms is reasonable, since only ‘Apple cultivar mix index’, which is part of the farm management under study, is correlated with income variables as demonstrated for the same set of farms in CitationMouron et al. (2006b: 567).
TABLE 1. Farm-structure parameters of the 12 fruit farms under study, based on the year 2000
All fruit growers have degrees in farming and were already well acquainted with IFP before our study commenced. The data recording was organized in cooperation with the Swiss Federal Research Station for Fruit-Growing, Viticulture and Horticulture in Wädenswil, Switzerland (CitationZürcher et al., 2003). The fruit farmers were instructed to keep a diary about all activities in all individual fruit orchards, using a commercial software package (CitationASA-Agrar ©, 2003). The data recording was set up for income analysis based on full-cost principle. Each year the completeness of the recorded data was checked on each farm. Over all, the selected farms were having access to the same production techniques and were delivering the same market. Some more details concerning the sample can be found in Appendix A.
Data Selection
The total income from apple production on the farm level is the sum of incomes generated by the farm's set of orchards. Orchards are the units where managerial decisions are taken. Since an apple orchard is a perennial crop, managerial decisions of farmers in a certain year have to take into account impacts on the trees from past years as well as purposes for future years. Thus for a statistical analysis of the impact of managerial decisions, it is not reasonable to compare farms on the basis of single years. Consequently, for the following comparisons of fruit farms, we considered a four-year period as one observation. Such a multiyear period also supports the aim of homogenous boundary conditions, by balancing impacts that occur with a certain probability per year. For example, even though the farms are located in areas with the same probability of hail, hail damage does not necessarily occur on all farms in the same year. The same holds true for pests and diseases with local character (Appendix A). Also, the yield of an orchard often alternates between high- and low-yielding years, but not all orchards are synchronous in this respect.
In order to make the farm data as comparable as possible, we selected only orchards in the productive phase (i.e., 4 to 15 years old), with a normal density of tress (i.e., 1500 to 4000 trees per hectare) and a minimum area per orchard of 0.1 hectare. An orchard is defined as a block of apple trees of the same cultivar, planted in the same year and trained in the same way.
The data used in this study are from the four-year period of 1997 to 2000. A total of 445 annual orchard results are included, representing the entire set of productive orchards of the 12 farms. There are no missing data. These 445 annual orchards are treated as one sample to compare the farms according to their statistical moment profile including mean, standard deviation, and skewness of income variables.
Definition of Income Variables
“Net income per labor hour” was taken as the main economic parameter, representing the average wage earned per hour including family labor as well as hired laborers. “Income per hour” is a key parameter for fruit growers because of its very practical aspects. It tells a farmer if the achieved return on labor covers the average costs of the hired seasonal workers, which is at 15 CHF/hour for our sample. This amount of labor return is also needed for the farm family in Switzerland to cover their living costs at a low standard. Thus, an average labor income of 15 CHF/h represents the minimum economic goal of the farms in our sample. Earning less than this minimum means not being able to amortize the investments in the orchards, machinery, and farm buildings in a proper way and thus to jeopardize the viability of the farm operation in the long run. Further, “income per hour” allows a direct comparison with opportune income through nonagricultural activities or wages in nonagricultural SME's (small and medium enterprises) of the region. presents the income variables and calculation scheme for “net income per labor hour” based on the full-cost principle. The formula is as follows:
TABLE 2. Income variables and calculation scheme of “Net income per labor hour (V 0).”
where V 0 is the net income per labor hour, V 1,1 is the total receipts per hectare, V 1,2 is the nonlabor production cost per hectare, and V 2 is the total labor hours per hectare. The following budget assumptions were made to calculate the income variables for one orchard in one year:
-
V 1,1 Total receipts: Includes sales of fresh apples and processed fruits, hail insurance proceeds, and direct payments for ecological compensation of 1200 CHF/ha through participating in the Swiss program of integrated fruit production (IFP).
-
V 1,2 Nonlabor production costs: Is the sum of the variables from V 1,2,1 to V 1,2,6 defined as follows:
-
V 1,2,1 Depreciation on orchard: The difference between the establishment costs of the orchard and the accumulated total receipts of the first three years was taken as the basis for depreciation costs. The depreciation per year was calculated using a straight schedule with a residual of zero over the 12 years of the orchard's productive phase. The establishment costs of the orchard include the full costs of planting as well as the accumulated total costs during the first three years. This depreciation cost was taken from FAW (1998) and adjusted according to the number of trees per orchard.
-
V 1,2,2 Total machinery costs: Includes fixed plus variable costs of machinery and equipment. The fixed costs also include the costs for the buildings required for the machines. Machinery and buildings are valued as new. The costs per hour for the different machines and equipment used by the farms were taken from CitationFAT (1999).
-
V 1,2,3 Pesticides and V 1,2,4 Fertilizer costs: The costs per unit for each different product used by farmers were taken from an official price list according to CitationLBL (2000).
-
V 1,2,5 Deductions: Include the sorting costs of the regional wholesaler according to the delivered percentage of first class apple as well as the annual membership fee for the Swiss fruit farm association.
-
V 1,2,6 All other production costs: Includes premiums for hail insurance, depreciation for hail protection, irrigation installation, and buildings for storing materials, as well as the calculated interest on owner's equity for establishment costs of orchard, hail protection, and irrigation installation. The interest rate was set at 4%. The calculative rent on land was fixed at 600 CHF/ha.
-
-
V 2 Labor hours: The figures for labor hours cover the total time of an activity including preparing and finishing a job. Individual labor force performance was adjusted to a full labor force. The farm manager estimated this proportion for each labor force.
-
Currency: The data were recorded in Swiss Francs (CHF). In converting to US Dollars ($) an exchange rate of CHF 1.50 = US$1.00 can be assumed as the average exchange rate during the period of investigation.
The income variables as presented in are classified from general to more detailed variables. Vi variables can be used to calculate the dependent variable “income per hour (V 0)” directly. Vi,j variables are used to calculate Vi variables, and Vi,j,k variables are used to calculate Vi,j variables. This grouping is used to analyze which income variables are influencing the variance of the dependent variable significantly. The output side of the production process is represented by the variables V 1,1 V 1,1,1, and V 1,1,2; all the other variables belong to the input side.
EMPIRICAL RESULTS
Management Influence on Income Risk
reports the first three statistical moments of “income per hour (V 0)” for each farm representing the structure of income risk. For each statistical moment the corresponding risk aspect was identified as follows.
TABLE 3. Statistical moments for “Net income per labor hour (V 0)” of 12 fruit farms with homogeneous boundary conditions based on annual data sets of 445 individual apple orchards, Switzerland, 1997–2000
Expected Risk: Analysis of the First Statistical Moment
Only farm No. 1 and No. 2 obtained a mean “income per hour” above the minimum target of 15 CHF/h with M = 26.3 CHF/h and M = 19.2 CHF/h, respectively (). The other 10 farms failed to reach an income above the critical level. It indicates that the economic viability of 83% of the farms was at risk. This large proportion characterizes a high expected risk farms were facing, when producing fresh apples within the given boundary conditions.
The management influences on the expected income can be judged by the range between the farm with the highest (No. 1) and lowest (No. 12) mean income. With 64 CHF/h this range is surprisingly large (). It is four times higher than the level of the minimum income (15 CHF/h). Therefore, the management influence on the expected income can be considered to be a vital issue for fruit farmers, since the farms were producing under comparable boundary conditions using the same production techniques and delivering the same markets.
Unknown Risk: Analysis of the Second Statistical Moment
The divergence of possible incomes on a farm, measured by the standard deviation (s) represents the unknown risk. shows that the average s per farm was at 27.9 CHF/h. Compared with the minimum income (M = 15 CHF/h), the average standard deviation was twice as high. On 10 farms the s was bigger than 15 CHF/h indicating that 83% of the farms did not manage to keep their labor income within the recommended variability and were exposed to unknown risk in a serious manner. Those farmers were faced with a very unstable income, not knowing much about their solvency at a certain time within the observed period. But this unknown risk differed considerably between the farms, indicating a serious influence of the farm management on the income variability. While on the farms with the most stable income the s was around 15 CHF/h (farm No. 1 and No. 2), on six farms the standard deviation was 20–30 CHF/h (i.e., No. 3, 4, 5, 7, 9, and 11) and on four farms the standard deviation exceeded 30 CHF/h (i.e., 6, 8, 10, and 12). Therefore farm management has the potential to at least halve the unknown risk.
Insights into the characteristics of the management influence to stabilize the income can be gained by studying the level of the minimum and maximum income on successful farms. Farms No. 1 and No.2 realized their relative high mean “income per hour” not by having a large share of annual orchard results with very high incomes but rather by avoiding high losses. This is indicated by the example of the annual orchard result with the minimum and the one with the maximum income per hour during the observed four-year period. The best two farms achieved minimum values of 6.0 CHF/h and −15.0 CHF/h, respectively, which is far above the minimum values of the other farms (). On the other hand, their maximum values of 51.3 CHF/h and 56.1 CHF/h, respectively, were also reached or even exceeded by other farms (i.e., farm No. 3, 4, 6).
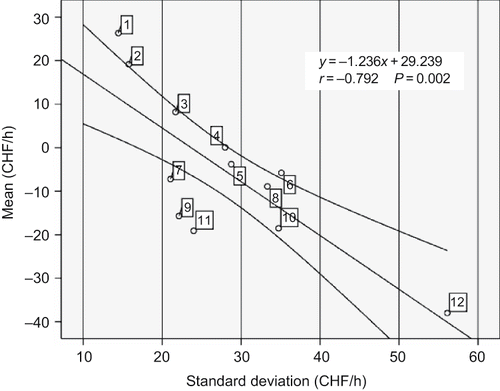
Further, we tested the correlation of mean (M) and standard deviation (s) to examine if the expected and unknown income risks are related. Such a correlation exists, as Figure1 illustrates. The negative and significant correlation (r = 0.79; P < 0.01) demonstrates the trend, that the lower the variability of income among the orchards, the higher the mean of the farm will be. It seems that an average high income in a farm can only be reached if the variance of the individual orchards is controlled to a certain extend. On the other hand, a low variance is no guarantee of achieving a high mean as farms No. 7, 9, and 11 show. Because farm No. 12 had by far the lowest M and highest s of the whole group (), the correlation of M and s was also tested excluding this farm, but the correlation remained significant at 95% confidence level. Therefore the performance of farm No. 12 confirms the observed trend of the group. Variance control can therefore be considered to be necessary but not sufficient for economic success on a fruit farm.
FIGURE 1. Linear correlation of mean and standard deviation of “Net income per labor hour (V 0)” of apple production on 12 fruit farms, Switzerland, 1997–2000. N = 12; r is the Pearson correlation coefficient; P the significance level (two-tailed); 95% confidence interval marked by curved lines; farm numbers sorted by the mean value.
Dread Risk: Analysis of the Third Statistical Moment
The skewness of four farms was significantly negative, indicating an asymmetrical income distribution to the undesired side (i.e., left-tailed distribution), according to the Kolmogorov-Smirnov test of normal distribution (). Therefore 33% of the farms were exposed to dread risk. On those farms relatively few but very low income cases decreased their mean income significantly, indicating that those farms were not able to limit catastrophic cases. Most of those catastrophic cases were so far below the median, that for compensation, incomes would have been required at a level physically unattainable even for the best apple orchards of the group. In contrast, the other eight farms, including the two best farms (i.e., No. 1, 2), managed to compensate low-income cases by high-income ones, indicated by a normally distributed “income per hour.” The best two farms even showed a positive skewness, which means that they performed an asymmetrical income distribution to the desired side (i.e., right-tailed distribution). But this tendency was not strong enough to be significantly different from normal distribution ().
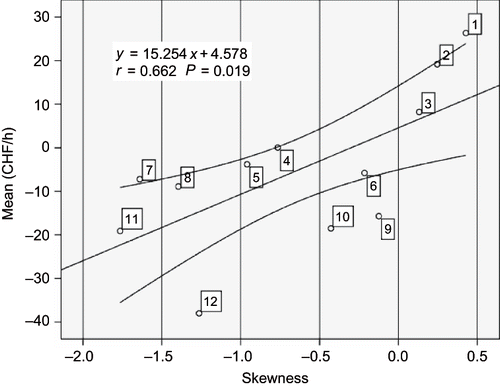
Management influence on the skewness is significantly correlated with the mean “income per hour” on a farm as visualizes. The positive and significant correlation (r = 0.66; P < 0.02) demonstrates, that higher mean income on a farm parallels higher indices of skewness. There are some farms that do not follow this rule. Farms No. 9 and 10 demonstrate the possibility that normal distribution can be achieved while the mean income remains at a low level. Avoiding negative skewness of income distribution can therefore be considered to be necessary but not sufficient for successful income on a fruit farm.
FIGURE 2. Linear correlation of mean and skewness of “Net income per labor hour (V 0)” of apple production on 12 fruit farms, Switzerland, 1997–2000. N = 12; r is the Pearson correlation coefficient; P the significance level (two-tailed); 95% confidence interval marked by curved lines; farm numbers sorted by the mean value.
Contribution of Income Variables to the Observed Income Risk Structure
In order to find explanations for the observed income risk structure on successful farms, we analyzed the economic variables from which the “income per hour” was calculated. In a first step we detected the variables that significantly correlate with “income per hour.” In a second step we analyzed the statistical moment profile of significant income variables on successful farms.
Significant Income Variables
presents the income variables that are significantly correlated with the dependent variable “income per hour (V 0).” For both independent variables “income per hectare (V 1)” and “total labor hours (V 2)” the correlation with V 0 is positive, significant, and strong (r = 0.93 for V 1 and r = 0.73 for V 2). It indicates that high income per hour parallels high income per hectare as well as high input of labor hours. On which income variables the significant impact of V 1 and V 2 is based can be taken from the corresponding first and second indicators.
TABLE 4. Linear correlation and statistical moments of income variables of apple production on 12 fruit farms with homogeneous boundary conditions, Switzerland, 1997–2000
Firstly, the independent variable “income per hectare (V 1)” is based on high “receipts per hectare (V 1,1)” that itself depends on high yields (V 1,1,1). In contrast, the “production costs (V 1,2)” and thus all corresponding income variables (i.e., V 1,2,1, V 1,2,2, V 1,2,3, V 1,2,4, and V 1,2,6) are not of significant influence on “income per hour (V 0).”Footnote 1 This result is in line with the fact that all these cost-related income variables did not differ much among the farms, as can be taken from the relatively small standard deviations compared to the mean values ().
Secondly, the significance of the independent variable “total labor hours (V 2)” is based on both of its corresponding first indicators, given through the significant and positive correlation of preharvest hours (V 2,1) and harvest hours (V 2,2) with V 0 (). Meaningful for farm management is the positive correlation of preharvest hours (V 2,1). It indicates that farms with a high income per hour invested more labor hours on cultivating the orchards than the other farms did. Furthermore, successful farms were able to transform these labor hours into high yields with good quality since the receipts of those farms were also highly correlated with their labor income (V 0). Surprisingly not even a high harvest performance (V 2,2,1), which means saving labor costs, was significantly correlated with V 0. Thus, regardless of the fact that apple production is input intensive in terms of area-related capital and labor hours, successful income depends not on lowering the cost side but rather by transforming required inputs into as high as possible outputs of good quality.
Statistical Moment Profile of Significant Income Variables
also provides the statistical moments of the income variables significantly correlate with ‘income per hour (V 0). Concerning the two significant output variables “receipts (V 1,1)” and “yield (V 1,1,1),” a very high proportion of the farms (92%, 83%) demonstrated normally distributed values. For both output variables the standard deviation is about half of the expected mean value. provides a closer look at the standard deviation per farm for “receipts (V 1,1).” It shows that the standard deviation was very similar on all farms. In contrast, the coefficient of variance (i.e., standard deviation/mean) is smaller on farms with higher mean receipts. We found a negative, significant correlation of CV with the mean value (r = 0.773, P = 0.003) indicating that successful farms were able to raise the mean receipt without losing control of variance. The same result was found for the other output variable (V 1,1,1).
TABLE 5. Statistical moments for “Total receipts per hectare (V 1.1)” of 12 fruit farms based on annual data sets of 445 individual apple orchards, Switzerland, 1997–2000
Concerning the two significant input variables “preharvest hours (V 2,1)” and “harvest hours (V 2,2)” in , it is remarkable that V 2,2 was normally distributed on 83% of the farms, while V 2,1 was normally distributed only on 42% of the farms. provides a closer look at the statistical moments per farm for “preharvest hours (V 2,1).” It shows that the farms with better incomes (i.e., farms with low farm No.) invested their preharvest hours normally distributed on their orchards, while most other farms did not. Successful farms were able to avoid unbalanced high preharvest labor hours. Therefore, a normal distribution for the preharvest labor input can be considered to be a necessary prerequisite for successful income, but it is not a sufficient one, since some farms with low incomes also showed normally distributed preharvest labor hours (i.e., Farms No. 12, 10).
Looking at the mean input of preharvest hours per farm () a further prerequisite for successful fruit growing can be ascertained. Farm No. 1 with the highest income of the group, invested 249 h/ha, which is by far the highest input of preharvest activities of the whole group, almost 100 h/ha above the group average. Farms No. 2 and 3 also invested more preharvest hours than the average did. On the other hand, some farms with low income (i.e., Farms No. 7, 9) spent preharvest hours much above the average as well. Therefore, high investment in preharvest activities can be considered to be necessary but not sufficient for successful income.
TABLE 6. Statistical moments for “Preharvest labor hours per hectare (V 2.1)” of 12 fruit farms based on annual data sets of 445 individual apple orchards, Switzerland, 1997–2000
DISCUSSION
From Negative to Positive Skewed Income
The empirical study demonstrates that successful fruit farms showed a normally distributed income or even a tendency to a positive skewed income distribution among their apple orchards. Such an income distribution indicates a strong management influence, because by its nature, the income distribution in apple production can be expected to be negatively skewed. Such an asymmetrical distribution to the undesired side can be considered to be natural, because negative incomes are nearly unlimited while positive incomes are limited. The limitation of positive incomes is given through the bio-physical limits of the fruit trees to maximize yields of a required fruit quality. In contrast, the losses in a certain year in a certain orchard can be extremely high; given the case that no yield can be expected because of damage through frost, hail, drought, diseases, or pest, the high establishment costs still have to be amortized and, in addition, the inputs for pest management, fertilization, and other cultivating activities are still required, as these inputs build the base for potentially good yields in the next year. This natural tendency to a negatively skewed income distribution is reflected by the fact, that the lowest income on an orchard was −204 CHF/h, while the highest income on an orchard was 90 CHF/h. The expected return distribution of apple production is therefore contrary to that of stocks or bonds, which potentially yield unlimited gains and limited losses and therefore tend to be positive skewed, as CitationGrootveld and Hallerbach (1999) report. In the case of apple production, two-thirds of the farms were able to turn the apple production system from a system with unlimited losses to one with limited losses, by avoiding very low-income cases. That most farms were able to avoid negative skewness of returns is probably due to the high state of knowledge of integrated fruit production (IFP) of this group, knowing how to use production techniques like hail net, hail insurance, pesticides, fertilizers, and planting approved apple cultivars on suitable rootstocks. Examples of how fruit farmers can avoid high losses are given in the management pyramid in CitationMouron et al. (2006b, pp. 572–574).
From Uncontrolled to Controlled Income
While most fruit farms were able to achieve normally distributed incomes, only a small portion of farms (17%) sufficiently mastered control of the variance of income. The study suggests that a controlled income is based on generous investments in preharvest activities such as pruning and crop load regulation. Qualified manual work prepares the trees for regular and high yields, that which cannot be enforced through increased inputs of pesticides or fertilizers. Inputs of material and machinery were for all farms under comparable conditions not much different, as is reported also in other studies like CitationGlover et al. (2002) and CitationGörgens (2001). This relationship between input and output side has not only an impact on economic success but also influences the ecological efficiency, as shown by CitationMouron et al. (2006a) through life cycle analysis of apple production.
Interaction Between Statistical Moments
For the case of apple production this empirical study showed that successful income parallels less negative asymmetry and significantly reduced variance of income. This kind of interaction between statistical moments for the return distribution is in line with several studies of other agricultural products, when farm management was improved by new technologies, for example as CitationKim and Chavas (2003) report for corn production, CitationCalatrava and Garrido (2005) report for several annual crops when water supply was improved, and CitationLangyintuo et al. (2005) observed for rice production when nitrogen fertilizer was optimized. Similar principles of risk management are also described in CitationScholz et al. (1994) for managing sewage plants.
CONCLUSIONS
This study examined the influence of management on the first three statistical moments (i.e., mean, standard deviation, and skewness) of labor income on Swiss fruit farms. The empirical results suggest that differences in management practice have a vital influence on all three statistical moments. We conclude that farm management has a high potential to reduce income risk, since the observed differences between farms occurred within a given set of production techniques and boundary conditions. Successful farms (i.e., farms with a mean income above a critical level) showed a normally distributed income with a low standard deviation. The best farms demonstrated the possibility to halve the standard deviation and to avoid negative skewness. Variance control and limitation of damage shaped this risk structure of success. Our study suggests that this advantage was achieved mainly by high investment in preharvest hours. Manual labor force cultivating the trees to establish and to maintain a regular and high yield potential over years seems to be a most important factor. Cost reduction on the other hand plays a minor role.
The high impact of amount and quality of preharvest labor hours may have implications by introducing new technologies to reduce income risk. The value of a new technology can probably be significantly improved by understanding the role of manual labor work in a perennial production system. We suggest not only to focus on new production technologies to lower income risk but also to train the management ability to influence the statistical moments of income variables since this has a vital impact.
Limitations are given through the fact that farm data based on a single orchard level were only available for one four-year period. Further studies considering several four-year periods (shifting average) are recommended.
Acknowledgments
The authors would like to thank their colleagues Lukas Bertschinger and Francies Fiesford from the Swiss Federal Research Station for Fruit Growing, Viticulture and Horticulture in Wädenswil for their support and especially Dante Carint for his efforts during the data collection period and for programming the data base. The study was financially supported by the Swiss Association of Fruit Growers, Zug, the Swiss Federal Office for Agriculture, Bern; and ‘Agridea’ the Swiss Center for Agricultural Extension, Lindau and Lausanne.
Notes
1. The only exception is the income variable “deductions (V 1,2,5),” which is significantly correlated with “income per hour (V 0),” since deductions include sorting costs and membership fee that is calculated by the yield (V 1,1,1), a variable that is itself highly correlated with "income per hour (V 0).”
LITERATURE CITED
- Antle , J.M. and Crissman , C.C. 1990 . Risk, efficiency, and the adoption of modern crop varieties – Evidence from the Philippines . Economic Development and Cultural Change , 38 ( 3 ) : 517 – 537 .
- ASA-Agrar ©. 2003. Software for cost accounting of perennial crops, at http://www.asaagrar.com
- Calatrava , J. and Garrido , A. 2005 . Spot water markets and risk in water supply . Agr. Economics , 33 : 131 – 143 .
- Ehinger , E. 1989 . Ein methodischer Ansatz zur Analyse der Wirtschaftlichkeit von Apfelanbaubetrieben . Dissertation, Universität Hohenheim , : 133
- FAT, 1999. Maschinenkosten 2000. FAT-Bericht Nr. 539. Eidgenössische Forschungsanstalt für Agrarwirtschaft und Landtechnik, Tänikon Switzerland, at http://www.fat.ch
- FAW, 1998. Die Bewertung der Obstkultur, Nr. 61. Swiss Federal Research Station for Fruit-Growing, Viticulture and Horticulture, Wädenswil, 21 pp. http://www.faw.ch
- Gigerenzer, G. and K. Fiedler. 2006. The first three moments: Statistical structure as a window to the mind. Max Plank Institute for Human Development, Berlin. Unpublished, available at [email protected]
- Glover , J. , Hinman , H. , Reganold , J. and Andrews , P. 2002 . A cost of production analysis of conventional vs. integrated vs. organic apple production systems , Washington State University .
- Görgens , M. 2001 . Kritische Erfolgsfaktoren im Obstbau aus betriebswirtschaftlicher Sicht . Schweiz. Z. , : 300 – 302 . Obst-Weinbau No.11
- Groot , M.J. 2000 . “ Economics of apple production systems with minimal input of chemicals ” . In ISHS , Acta Hort.:536 .
- Grootveld , H. and Hallerbach , W. 1999 . Variance vs downside risk: Is there really that much difference . European J. Operational Res. , 114 : 304 – 319 .
- Hester , S.M. and Cacho , O. 2003 . Modelling apple orchard systems . Agr. Systems , 77 : 137 – 154 .
- Hinman , H.R. , Smith , T.J. and Witney , G.W. 1998 . “ Cost of producing pears in the Wenatchee District of Central Washington ” . In Farm Business Management Reports, Washington State University
- Hinman , H.R. , Tvergyak , P. , Peterson , B. and Clements , M. 1992 . “ Estimated cost of producing Red Delicious apples in Central Washington ” . In Farm Business Management Reports, Washington State University
- IP-Suisse, 2003. Gesamtbetriebliche Anforderungen. Schweizerische Vereinigung integriert produzierender Bauern, at http://www.ipsuisse.ch
- Keating , B.A. and McCown , R.L. 2001 . Advances in farming systems analysis and intervention . Agr. Systems , 70 : 555 – 579 .
- Kim , K. and Chavas , J.P. 2003 . Technological change and risk management: An application to the economics of corn production . Agr. Economics , 29 : 125 – 142 .
- Lang , M. , Thomann , M. and Hafner , H. 1998 . Produktionskosten im Südtiroler Obst- und Weinbau . Südtiroler Beratungsring, Lana, Italy , : 65
- Langyintuo , A.S. , Yiridoe , E.K. , Dogbe , W. and Lowenberg-Deboer , J. 2005 . Yield and income risk-efficiency analysis of alternative systems for rice production in the Guinea Savannah of Northern Ghana . Agricultural Economics , 32 : 141 – 150 .
- Lauwere , C.C. de . 2005 . The role of agricultural entrepreneurship in Dutch agriculture of today . Agr. Economics , 33 : 229 – 238 .
- LBL, 2000. Preiskatalog Ausgabe 2000. Landwirtschaftliche Beratungszentrale, Lindau Switzerland, at http://www.lbl.ch
- Markowitz , H.M. 1952 . Portfolio selection . J. Finance , 7 ( 1 ) : 77 – 91 .
- Meli , T. 1991 . Kosten und Erträge in Tafelapfelanlagen . Swiss Federal Research Station for Fruit-Growing, Viticulture and Horticulture, Wädenswil , : 28
- Mouron , P. and Carint , D. 2001 . Rendite-Risikoprofil von Tafelobstanlagen [Profile of return on capital-risk of table fruit orchards]. . Obst- und Weinbau , 137 ( 5 ) : 106 – 110 .
- Mouron , P. , T. Nemecek , R. , Scholz , W. and Weber , O. 2006a . Management influence on environmental impacts in an apple production system on Swiss fruit farms: Combining life cycle assessment with statistical risk assessment . Agr. Ecosystems and Environ. , 114 : 311 – 322 .
- Mouron , P. , Scholz , R.W. , Nemecek , T. and Weber , O. 2006b . Life cycle management on Swiss fruit farms: Relating environmental and income indicators for fruit growing . Ecological Economics , 58 : 561 – 578 .
- O'Rourke , A.D. 1994 . “ The world apple market ” . In The Harworth Press, Inc 237 New York
- Perillat , B.J. , Brown , W.J. and Cohen , R.D.H. 2004 . A risk efficiency analysis of backgrounding and finishing steers on pastures in Saskatchewan, Canada . Agr. Systems , 80 : 213 – 233 .
- Roy , A.D. 1952 . Safety first and the holding assets . Ecometrica , : 431 – 449 .
- Samonati , C. 1999 . “ Il melo in Val di Non, Analisi dell'efficienza tecnico economica ” . In ESAT 39 Trento, , Italy
- Scholz , R.W. , Popp , M. , May , T.W. and Nothbaum , N. 1994 . “ Risikoberechnung zur Abwasserabgabe ” . In ATV Landesgruppe Baden-Württemberg. ATV-Landesgruppentagungen 1993, Donaueschingen , 45 – 59 . Hennef : Abwassertechnische Vereinigung, Landesgruppe Baden-Württemberg .
- Smit , A.B. 2004 . “ Changing external conditions require high levels of entrepreneurship in agriculture ” . In Proceedings of the XVth International Symposium on Horticultural Economics and Management Edited by: Bokelmann , W. 167 – 173 . ISHS, Acta Hort.:655
- Traxler , G.J. , Falck-Zepeda , J.L. , Ortiz-Monasterio , R. and Sayre , K. 1995 . Production risk and the evolution of varietal technology . Amer. J. Agr. Econ. , 77 : 1 – 7 .
- White , G.B. , DeMarree , A.M. and Putman , L.D. 1999 . Fruit farm business summary, lake of Ontario region New York . Cornell University, Ithaca, New York , : 27
- Winter , F. 1976 . A simulation model for studying the efficiency of apple and pear orchards . Stuttgart, Gartenbauwissenschaft , 41 ( 1 ) : 26 – 34 .
- Zürcher , M. , Mouron , P. and Carint , D. 2003 . Erträge und Produktionskosten im modernen Tafelkernobst-Anbau . Obst- und Weinbau , 15 : 6 – 9 .
APPENDIX A. FURTHER DETAILS CONCERNING THE SAMPLE
Location
The farms were located in the flatter regions of Eastern and Central Switzerland. The average altitude of the orchards was 477 m above sea level, with an annual mean temperature of 8.5°C and a mean annual precipitation of 916 mm. Severe frost damage in the apple orchards is rare, occurring about once in every 15 years. Rainfall is well distributed throughout the growing season so that hardly any irrigation is needed. On the other hand, the regular rainfall requires the consistent application of fungicides, especially in the spring, mainly to control scab (Venturia inaequalis) and powdery mildew (Podosphaera leucotricha). Among pests, annual regulation referred to codling moth (Cydia pomonella) and rosy apple aphid (Dysaphis plantaginea). Other pests, such as summer fruit tortrix moth (Adoxophyes orana) and apple sawfly (Hoplocampa testudinea), did not exceed the economic threshold every year.
Farm Structure
All farms had their orchards close by, within a distance of 2 km. The following apple cultivars were planted: ‘Golden Delicious’ (19%), ‘Jonagold’ (11%), ‘Idared’ (11%), ‘Maigold’ (9%), ‘Elstar’ (8%), ‘Boskoop’ (8%), ‘Arlet’ (6%), ‘Gravensteiner’ (6%), ‘Cox Orange’ (4%), ‘Gala’ (4%), and 13 other cultivars with a total of less than 3%. Sixty-five percent of the orchards were protected by hail nets; the other orchards were insured against hail damage.
Farmers’ Education
The fruit growers all have degrees in farming, which implied either a three-year apprenticeship, master courses, or internships at several other farms. Once a year, they attended a professional course or conference for at least one day so as to update their knowledge about IFP. They all used the most up-to-date information regarding local extension services.
Data Recording
The records included the following preharvest activities: care of trees (e.g., winter pruning), crop regulation (e.g., thinning of blossoms), plant protection (e.g., spraying), soil management (e.g., mulching), fertilization (e.g., foliar nutrition), yield protection (e.g., fix the hail net), administration (e.g., professional training); harvest activities (e.g., fruit picking); and postharvest activities (e.g., sorting fruits) were also recorded. In the diary each activity had to be linked to the actual physical and monetary inputs and outputs of the production process. It took a farmer 5 to 15 minutes per day to keep the electronic diary. The 12 farms analyzed in this study were involved in the survey for the whole period of 4 years. Thus, the diary afforded a highly disciplined cooperation. Nevertheless, the farmers were highly motivated; presumably they attained insight into their fruit production especially at the annual group meeting, where the current benchmark of the farms was always presented and discussed. Each year, the completeness of the recorded data was checked on each farm. As a result of those checks, the original total of 499 annual data sets of all apple orchards was reduced to 445.