Abstract
As costs for nitrogenous fertilizers become increasingly expensive, organic and conventional apple producers recognize the potential to integrate leguminous plants in the orchard agro-ecosystem to contribute to N nutrition. We evaluated alfalfa as a drive row cover and white clover as an under tree living mulch. Both impacted nitrogen dynamics and tree performance. Alfalfa did not adversely affect tree growth and yield while potentially contributing to tree N nutrition. The white clover living mulch, clearly impacted soil nitrate and tree performance. Clover co-location with tree roots enabled N contribution from both tops and roots.
INTRODUCTION
The Pacific Northwest is a leading national producer of apple [Malus x sylvestris) Mill. var. domestica (Borkh.)]. Orchardists face increasing cost for synthetic nitrogenous fertilizers based on natural gas that are no longer manufactured regionally. Synthetic nitrogen fertilizer in urea form (46% N) cost the growers in central Washington State, USA about $1.04 per kg N in June 2010, compared to $2.39 per kg N in October 2008. The average price over the last five years was $1.39 per kg N (N. Squires, Northwest Wholesale, Wenatchee, WA, USA, personal communication). Calcium nitrate (15% N), a formulation frequently used by orchardists, cost $4.06 per kg N in June 2010, compared to $5.73 in 2008, and has a five-year average price of $4.05 per kg N (K. Lorentz, Quincy Farm Supply, Quincy WA, USA, personal communication). Historically high N fertilizer pricing in 2008 resulted in substantial demand destruction. Organic nitrogen sources typically range in price from $3–13 per kg N (dry basis) (Granatstein, unpublished data). As costs for natural gas (used to synthesize N fertilizers) and oil (used for transportation) increase, costs for synthetic and organic N fertilizers will increase as well (CitationRoberts, 2008; CitationSimmons, 2005).
Washington organic orchardists identified soil fertility as a priority issue, (CitationGranatstein, 2003; CitationCornwoman and Granatstein, 1994) due to uncertain N mineralization, competition from weeds, and high costs (CitationGranatstein et al., 2010). In Washington State apple orchards, standard practice includes a perennial grass cover in the drive alley, a vegetation-free tree row approximately 1.5 m wide, maintained by either a herbicide application or tillage, and the annual application of some type of fertilizer to supply tree nitrogen nutrition needs.
Apple farmers are interested in the potential use of legumes either in the drive alley or under the tree canopy to supply a portion of tree N need (CitationGranatstein and Sanchez, 2009; CitationSanchez et al., 2006) and potentially serve other agro-ecological functions (CitationAltieri and Schmidt, 1985; CitationAltieri and Nickolls, 1999; CitationStary and Pike, 1999). Legumes offer a potentially sustainable source of N, given their ability to fix N from the atmosphere. Yet adoption of legume use in orchards has been low due to concerns about competition with trees, excess N at the wrong time, attractiveness to rodents (CitationMerwin et al., 1999) and certain insect pests, and uncertainty about potential N nutrition contribution (CitationMarsh et al., 1998; CitationWoolbridge and Botha, 1991). The orchard floor management system used can directly and profoundly affect tree performance (CitationConnell et al., 2001; CitationElmore et al., 1989; CitationForshey, 1988; CitationWoolbridge and Botha, 1991; CitationWoolbridge and Harris, 1989). Past studies clearly reveal that orchard nitrogen nutrition is sensitive to orchard floor vegetation and management systems (CitationNielson et al., 1984, Citation1986; CitationMarsh et al., 1996; CitationMeagher and Meyer, 1990; CitationMeyer et al., 1992; CitationNielson and Hogue, 1985; CitationShribbs and Skroch, 1986; CitationSkroch and Scribbs, 1986).
To evaluate potential N contribution, we conducted two studies in a Washington State orchard with legumes either in the drive alley or tree row. The first experiment, conducted over four growing seasons compared alfalfa (Medicago sativa) to the standard grass cover in the drive alley. The second experiment measured nitrogen released by white clover (Trifolium repens) as a living mulch in the tree row. Both legume management options meet the criteria for use in organic orchards.
MATERIALS AND METHODS
Both experiments were conducted at the Wenatchee Valley College Teaching and Demonstration Orchard, E. Wenatchee, Washington, USA (latitude 47.37°N, longitude 120.35°W, elevation 380 m), typical of orchards in the region, on a Pogue fine sandy loam (Aridic Haploxeroll), averaging 1% organic matter and pH 6.1 to 7.3. All plots were irrigated with micro-jet sprinklers as irrigation is necessary for fruit production in this semi-arid climate, with annual precipitation of 150 to 400 mm.
Experiment 1
In this experiment, alfalfa as the drive row cover was compared to the standard grass drive row cover (= control). Six contiguous 0.5 hectare plots were established in a 5th leaf, mature-bearing ‘Fuji’ (BC 2)/M.9 apple block planted at a spacing of 1.2 m × 3.96 m (2,104 trees per hectare). Three replications of alfalfa cover and three of grass cover in a randomized complete block design were sown on May 21, 1999, the first year of the four-year experiment. A standard orchard cover crop mix of 40% ‘Penguin’ perennial ryegrass (Lolium perenne), 40% ‘Omni’ perennial ryegrass, and 20% chewing's fescue (Festuca rubra subsp. commutata Gaudin) (Cenex Ag Supply Co., Wenatchee, WA, USA) was utilized for the grass cover, while ‘Vernal’ alfalfa (Cenex Ag Supply Co., Wenatchee, WA, USA) was chosen for its drought tolerance and lower vigor.
The plots were uniformly farmed, except when the maintenance of the two different covers dictated otherwise. Both covers were mowed with a flail type mower three to four times per year; the alfalfa was mowed before flowering and to a height of approximately 15 cm to avoid crown damage, and the grass was mowed to about 9 cm and before seed heads formed. The weed-free tree row strip (approximately 1.5 m wide) was maintained by one or two glyphosate applications (183 L ha−1; 0.94 l a.i. ha−1, 80:1 dilution) during each growing season. Ammonium nitrate fertilizer (34% N) at the rate of 28 kg N ha−1 was uniformly broadcast applied to all plots (due to low vigor) in year one (mid April) and year two (mid May), and in year three at the rate of 56 kg N ha−1 (mid May) along with foliar applied urea (46% N) at the rate of 5.6 kg N ha−1 (late April). In year two, ammonium nitrate was hand applied around the base of replanted trees only, at a rate of .016 kg N/tree. N fertilizer applications were made to mitigate low soil N level and concern about low tree vigor.
In mid-July of years two, three, and four, the composition of the cover crop vegetation was evaluated. In each replicate, ten sites were randomly selected and the numbers of prevalent plant species in a 1-meter diameter hoop were recorded. In year four, N content per unit of cover crop biomass was measured by clipping (at mowing height) and collecting vegetation from three hoop sample sites in each replicate, which were then composited and analyzed for total N (total Kjeldahl Method, Cascade Analytical, Wenatchee, WA, USA).
Soil nitrate (0–30 cm depth) in both tree row and drive alley, was assessed four times per season; in late March (before N fertilizer application), late May (after N fertilizer application), late summer (August/September), and early November. For this, ten randomly distributed soil cores were taken from each plot, composited, and analyzed (2N KCl extractant with determination by Cadmium reduction column on Lachat flow injection unit, Cascade Analytical, Wenatchee, WA, USA). Spring and late summer sampling was not done the initial year of the experiment. Complete soil nutrient analysis including soil organic matter content (SOM) was conducted for fall collected (November) soil samples each year of this study.
Tree leaf tissue samples, for nutrient content analysis, were collected in mid-July from 30 trees per plot, selecting ten mature leaves per tree from moderately vigorous, mid-canopy shoots, fully exposed to sunlight. Composited plot samples were analyzed for total N (total Kjeldahl Method, Cascade Analytical, Wenatchee, WA, USA) and total nutrient content.
Tree growth was assessed in early spring each year before bud break by measuring trunk circumference (20 cm above graft union) of the same 50 trees per plot, and then calculating the trunk cross-sectional area (TCSA). Replacement trees for measurement were selected in the spring of year two where sample trees suffered severe cold temperature injury to trunk bark and cambium tissues the previous winter. To further characterize tree growth, terminal and lateral shoot length measurements were taken at the end of the grand growth period, marked by the setting of terminal buds in the late summer. Ten representative trees per plot were selected and for each all current season shoot growth on a uniformly representative branch was measured.
Total fruit yield for each plot was calculated by adding estimated bins of field sorted fruit (i.e., field culled at harvest) to the number of bins per plot sent to the fruit packer for commercial sale.
Data were analyzed using ANOVA and FLSD for mean separation (Statistix 7, Analytical Software, Tallahassee, FL, USA) to compare between treatments in single years only and are thus reported as trends over time.
Experiment 2
This trial was conducted in a block of spur type ‘Red Delicious’/M.26 apples, adjacent to Experiment 1, planted in 1995 on a 1.0 × 3.96 m spacing, 2,525 trees/ha). Two treatments (see below) of ‘New Zealand’ white clover were planted in the tree row (22 kg seed per planted ha) as a ‘living mulch’ on August 17, 1999 as part of a larger orchard floor management trial. The control treatment (CTL) was bare ground-maintained with one or two glyphosate applications (183 l ha−1; 0.94 l a.i. ha−1, 80:1 dilution) per season to control weeds. Plots were 1.6 × 7.0 m in the tree row, with five replications in a randomized complete block design. The clover was mowed one or two times per season with a string trimmer to control weeds. No fertilizer was applied to the clover plots. Ammonium nitrate (34% N) fertilizer was applied to CTL plots as follows: May 1999 and 2000, 0.05 kg per tree; Oct 2000 and 2001, 0.1 kg per tree.
In 2001, two separate trials were conducted in the clover plots (using CTL plots for reference) to evaluate nitrogen release from the clover. We designate these as Experiments 2a and 2b in this report. Experiment 2a compared flaming (CLF) with a hand-held propane weed burner versus mowing the white clover living mulch (CLM) with a string trimmer to release N. An unmowed subplot (CLU), (0.8 × 1.2 m) was maintained in one corner of each CLM plot for comparison. Plots were mowed or flamed on June 11, 2001 after substantial clover growth. Ten soil cores (0–15 cm depth) were randomly taken from each plot and composited. Samples were taken in all plots (CTL, CLF, CLM, CLU) on June 11, June 25, July 2, July 5, July 9, and July 17; and from CLF, CLM, and CLU on June 14, June 18, June 21, and June 28. Nitrate analysis was done using a Cardy meter with a nitrate ion-selective electrode (Horiba Instrument Co., Kyoto, Japan) based on CitationHartz et al. (1993).
Experiment 2b was conducted in control (CTL) and clover living mulch (CLM) plots to measure clover N mineralization similar to the method of CitationRaison et al. (1987). Two mineralization tubes (ABS plastic, 7.6 cm ID, 25 cm long with 20 cm in the soil) were driven into the soil in each plot approximately 40 cm apart where they would receive similar quantities of water from micro sprinkler irrigation. One tube per plot was covered with a PVC cap to prevent nitrate leaching, but watered as needed to maintain moist soil. The other was uncovered. On day zero (July 17), a baseline soil sample (0–15 cm) for nitrate was taken from each plot. The clover was then cut and clippings left in place. A representative amount of cut clover was placed on the soil surface in the tubes. A clover sample was taken for fresh weight, dried and weighed, and then analyzed for total N by combustion (LECO C-N Analyzer, St. Joseph, MI, USA). Soil samples (see treatment list below) were then taken on days 7, 14, and 21. All soil samples were analyzed for nitrate with a Cardy meter (see above). The treatments were:
-
A = (CTL plot, tube + cover, – clover; background soil N mineralization);
-
B = (CTL plot, tube + cover, + clover; mineralization of soil plus clover clippings);
-
C = (CLM plot, tube + cover, + clover; mineralization of soil plus clippings plus roots, plus residual N from clover);
-
D = (CLM plot, tube – cover, + clover; as in C minus any leaching loss);
-
E = (CTL plot, no tube, ambient soil sample; soil N mineralization minus any leaching loss or root uptake);
-
F = (CLM plot, no tube, ambient soil sample; soil and clover mineralization minus any leaching loss or root uptake).
Data were analyzed with SAS 8.0 (SAS Institute, Inc., Cary, NC, USA) using ANOVA, and FLSD for mean separation.
RESULTS AND DISCUSSION
Despite only fair cover crop establishment in year one (1999) for Experiment 1 and intrusion with endemic weeds, alfalfa and grass dominated their respective plots. Planted species increased their percent cover from 40–50% in year 2 to 85–95% in years three and four (). Such an increase in stand strength and homogeneity was expected, but alfalfa is known to decline in stand strength over time (after four or five years), and its persistence (not examined in this experiment) with or without renovation in an orchard is questionable.
TABLE 1 Composition of Drive Alley Vegetation (Percent Dominant Plant Species) in Alfalfa and Grass Cover Crop Plots, by Year
The alfalfa cover consistently had a significantly greater (p < 0.001) N content per unit biomass (4.79% average over three years) than did the grass cover (2.45% average over three years). As alfalfa cover stand homogeneity increased, so did N content per unit biomass () and alfalfa produced at least two times the biomass per unit area as the grass (data not shown). Thus, as anticipated, the alfalfa cover vegetation had the potential to contribute more N to the system, upon mowing, deposition, and degradation than did the grass cover. However, despite the alfalfa cover producing twice the biomass per unit area as the grass cover, soil organic matter (SOM) content was not significantly different between cover treatments any year and was relatively consistent for the duration of the study (data not shown). At 1%, SOM was consistent with other parts of the orchard and other orchards on this soil type.
TABLE 2 Percent Total Nitrogen Content Per Unit Biomass in Alfalfa and Grass Cover Crop Treatments, by Year
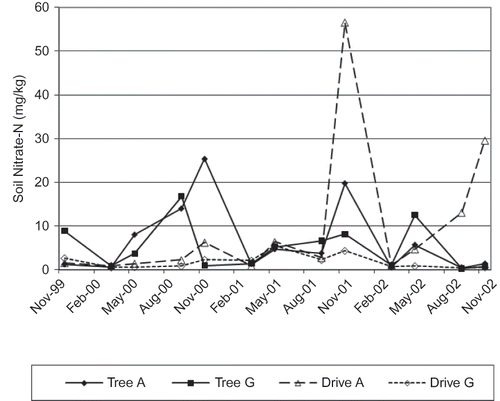
Spring soil nitrate levels were consistently very low for both treatments, likely due to leaching over the winter (). There were late season spikes of soil nitrate in the alfalfa tree row in years two and three, a large spike in alfalfa drive alley soil nitrate levels in year three, and a smaller spike in year four. The year two tree row spike may have been caused by sample contamination from ammonium nitrate fertilizer applied to young replant trees in all plots in that season. It is also possible that some nitrate from the drive row moved laterally with subsurface water on the hillside site and elevated levels in the tree row. Lateral nitrate movement, from drive row to tree row, was not assessed in this study. Grass tree rows generally had higher soil nitrate than grass drive rows, likely due to sample contamination from direct fertilizer application to replant trees and. Fall soil analysis for all other macro and micro-nutrients indicated levels within acceptable range for apple for both cover treatments (data not shown) in all years.
FIGURE 1 Soil nitrate nitrogen levels (0–30 cm depth) for alfalfa and grass cover crops measured both in tree row (TR) and drive alley (DA).
Nutrient levels from tree leaf tissue analysis were within acceptable ranges for all nutrients analyzed for all years (data not shown). Tissue N concentration was not significantly greater for any treatment any year of the study. Leaf total N was generally 2.3–2.9% across years and treatments, with the highest levels in year three. This coincided with particularly high soil nitrate levels in November, later that same year, but soil nitrate in the samples preceding the leaf collection were not elevated. Application of foliar urea during the growing season may account for this.
Persistently high soil nitrate nitrogen levels would likely have an effect on the balance between vegetative and reproductive growth and fruit quality (CitationElfving, 1996; CitationJohnson, 1996). Trees in both cover crop treatments grew steadily and equally well during this study. Trunk cross-sectional area (TCSA) was not different for either treatment in any year (). Mean terminal shoot length increased throughout the duration of the study for both treatments (), with the greatest terminal shoot growth in year four. Terminal shoots tended to be longer on alfalfa treatment trees and were significantly longer (p < 0.01) in years three and four. Lateral shoot length was similar between treatments except for significantly greater length for the alfalfa treatment in year three. Soil N enrichment over time by alfalfa might explain growth differences between treatments in the latter years of the study. Yields for both treatments in all years, though fluctuating somewhat (Fuji is an alternate bearing cultivar), fell within anticipated and acceptable ranges. Cover crop treatment did not significantly affect yield during the course of this study though yields were somewhat higher for the alfalfa treatment than the grass treatment in all years. This may be attributable to a slightly more vigorous state of the alfalfa treatment trees. Yield is a function of canopy size, fruiting wood quality and appropriate vigor. No significant differences were measured for incidence of fruit bitterpit or russeting, both physiological disorders associated with excess N nutrition, between treatments for any year of the study (data not shown). Internal indices of fruit maturity, such as starch levels, flesh translucence, and flesh firmness, were not measured but may have been, in retrospect, valuable and likely more sensitive indicators of N nutrition status.
TABLE 3 Mean Terminal and Lateral Shoot Length (cm) and Trunk Cross Sectional Area (TCSA) of Apple Trees in Alfalfa and Grass Cover Crop Plots, by Year
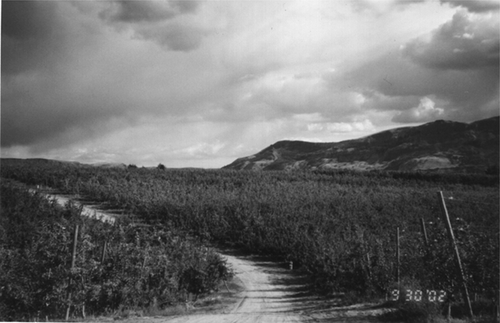
Despite the lack of consistent and definitive soil or tree growth data strongly indicating N contribution effect from the alfalfa cover, visual observation of plots in the fall of year four () evidenced a difference in degree of tree leaf chlorophyll clearing (senescence), with the trees in alfalfa plots having very green leaves and the trees in grass plot having browning leaves. The leaf color difference was evident exactly between plot boundaries and was consistent for all plots. Timing of leaf chlorophyll clearing and senescence was not measured in our experiment but given our observations may have provided an indication of difference in N nutrition enhancement.
FIGURE 2 Photo of the experimental block taken at the end of September, the fourth year of the study. Note the clearly demarcated light color of the grass plot in the center of the photograph. Below and above the grass plot are alfalfa plots exhibiting darker green foliage color indicative of delayed chlorophyll clearing as a result of higher nitrogen leaf tissue content.
CLOVER EXPERIMENTS
When mowed, the clover clippings provided 35 g/m−2 DM with 3% total N content. In Experiment 2a, all the clover plots exhibited higher soil nitrate than the bare ground control over the five week study period (). There was no clear flush of N from the cover crop based on the soil analysis, and the mowed or flamed plots were generally no different than the unmowed clover. This is likely due to the effect of leaching loss and root uptake (both tree and clover), which were not controlled for, and which instigated Experiment 2b. However, tree leaf total N was significantly higher in the clover plots than CTL, suggesting a contribution from the season-long presence of clover (). Clover plots also had significantly higher fruit yield, lower fruit firmness, and slower tree senescence than the control (data not shown).
FIGURE 3 Change in soil nitrate-N (0–15 cm depth) after mowing or flaming white clover living mulch in the tree row on June 11. CTL = bare ground control; CLM = white clover, mowed; CLU = white clover, unmowed; CLF = white clover, flamed.
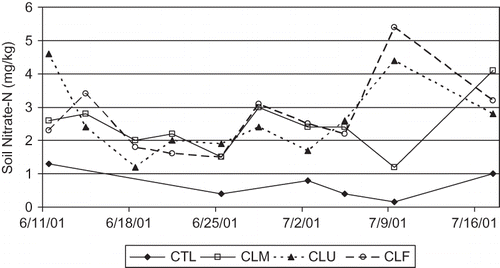
TABLE 4 Total N in tree leaves, experiment 2a, July 2001
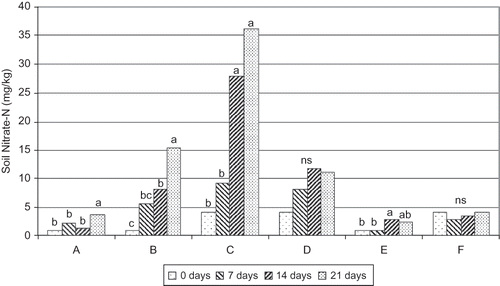
Experiment 2b was designed to control for root uptake and leaching loss of N, and to separate above-ground and below-ground N contributions from the clover. As shown in , soil nitrate was low in the control plots for all dates, indicating little contribution from organic matter. Treatment B represented the mineralization of N from the clover clippings alone, which was estimated at 45% of the N in the clover over the three-week period. Treatment C exhibited the highest levels of soil nitrate, with contributions from the clover clippings as well as clover roots and residue. Treatment D was lower than C, presumably due to leaching loss that occurred with the uncovered tube. Treatment F allowed for leaching plus tree uptake, and was similar to Treatment E (ambient soil in control plot). Leaching loss appeared to be important (difference between C and D), while root uptake by trees or the clover was also evident (difference between D and F). From these experimental data, based on the clover area being 37% of the orchard surface, the clover living mulch has the potential to contribute approximately 30 kg NO3-N ha−1 to the trees when mowed and if irrigation management can minimize leaching loss. This is nearly half or more the N requirement for most bearing apple orchards. However, if potential N is calculated using the above-ground clover dry matter and N content, the potential is much lower (130 kg ha−1 DM @ 3.0% N = 3.9 kg N ha−1 total). Possible explanations for the discrepancy include a sizeable contribution from clover roots and accumulated surface residue, lack of precision with the Cardy meter, and experimental error. It is not known whether multiple cuts would proportionally increase the nitrogen contribution. Clover management would also need to be adjusted to the optimal times for tree nitrogen needs.
FIGURE 4 Soil nitrate-N (0–15 cm depth) at 1, 2, and 3 weeks after mowing white clover. A = sample from tube in control plot, with cap; B = sample from tube in control plot with clover clippings added, with cap; C = sample from tube in clover plot with clover clippings added, with cap; D = sample from tube in clover plot with clover clippings, without cap; E = ambient soil sample, control plot; F = ambient soil sample, clover plot. Means within a treatment with the same letter are not significantly different among dates (p < 0.05). NS = no significant difference.
An adjunct experiment with the soil mineralization tubes was conducted immediately after Experiment 2b in the same plots but in an unsampled area. Treatment D was changed to [tube in clover + cover – clippings]. Overall results were very similar to Experiment 2b (data not shown), increasing the confidence in the first results.
CONCLUSIONS
Legume cover crops planted in either the drive alley (alfalfa) or tree row (white clover) impacted the nitrogen dynamics and tree performance in apples. Our four-year study demonstrated that alfalfa can serve as a drive row cover and not adversely affect tree growth and yield while potentially contributing to tree N nutrition. The effect of the alfalfa was less pronounced, because of the addition of fertilizer and perhaps because the clippings were left in place and not put on the tree row where the majority of Malling 9 apple roots exist. A system that deposits alfalfa mowed from the drive alley to under the tree row, in the root zone, for subsequent decomposition may better provide N to trees. However, observations of leaf color and senescence, particularly by the fourth year of the study, was seemingly indicative of nitrogen enrichment of the trees in the alfalfa plots. Similarly, greater terminal and lateral shoot growth in alfalfa cover plot trees indicated possible nitrogen enrichment. The trees in this experiment had low vigor and heavy crop loads and were therefore fertilized with modest N amounts in years one, two and three to assure adequate performance. These N additions may have masked some of the effect of the alfalfa in the system. It may also be that the experiment was terminated before cumulative or longer term alfalfa N contributions were evidenced or that the measures employed were simply not sensitive enough to better reveal subtle and short term N contributions. But for the four year duration of this study alfalfa caused no unacceptable problems.
In contrast, the white clover in the tree row, as a living mulch, exhibited clearer impacts on both soil nitrate and tree performance. By being co-located with the tree roots the clover was able to contribute N from both tops and roots. What is unknown is the degree of uptake of N by the clover roots in competition with the trees, and the extent to which this suppresses N fixation in the clover to bring new nitrogen into the system. In addition, the co-location of the clover with the trees makes N timing more difficult than in the alfalfa system and also dramatically increases vole populations and attendant potential tree damage. Over-winter loss of N in the sandy loam soils was considerable, and strategies for reducing this are needed, particularly in areas with vulnerable groundwater and in organic orchards where N is a costly resource to replace. As nitrogen supplies for agriculture become more constrained, both from synthetic and organic sources, use of legumes will be more necessary. Growers and researchers will need to build on existing results to develop systems that minimize known problems (e.g., excess N at the wrong time, vole attraction) so that legumes can be successfully incorporated into orchard systems.
Related Research Data
LITERATURE CITED
- Altieri , M.A. and Nickolls , C.I. 1999 . “ Biodiversity, ecosystem function, and insect pest management ” . In Biodiversity in agroecosystems , Edited by: Collins , W.W. and Qualset , C.O. Boca Raton, FL : CRC Press .
- Altieri , M.A. and Schmidt , L. 1985 . Cover crop manipulation in northern California orchards and vineyards: effects on arthropod communities . Biol. Agr. Hort. , 3 : 1 – 24 .
- Connell , J.H. , Colbert , F. , Krueger , W. , Cudney , D. , Cast , R. , Bettner , T. and Dallman , S. 2001 . Vegetation management in almond orchards . HortTechnology , 11 ( 2 ) : 254 – 257 .
- Cornwoman, M. and D. Granatstein. 1994. Organic apple production in Washington State: A 1994 survey of growers. Organic Farming Research Foundation. Santa Cruz, CA. http://ofrf.org/funded/reports/cornwoman_93-88.pdf (http://ofrf.org/funded/reports/cornwoman_93-88.pdf) (Accessed: 28 August 2010 ).
- Elfving , D.C. 1996 . “ Physiological processes and the coordination of vegetative and reproductive plant growth and development ” . In Tree fruit physiology: Growth and development , Edited by: Maib , K.M. , Andrews , P.K. , Lang , G.A. and Mullinix , K. Yakima, WA : Good Fruit Grower .
- Elmore , C.L. , Asai , W.K. , Hicks , L.C. and Elkins , R.B. 1989 . Plant composition of orchard floors . California Agr. , 43 ( 4 ) : 18 – 20 .
- Forshey , C.G. 1988 . An overview of orchard cover crop management . Proc. 82nd Ann. Mtg. Washington State Hort. Assn. , 75 : 125 – 128 .
- Granatstein, D. 2003. Organic tree fruit research needs for Washington State. Washington State University, Wenatchee, WA. http://organic.tfrec.wsu.edu/OrganicIFP/OrganicFruitProduction/Organic%20TF%20Research%20Summary%20Sept03.pdf (http://organic.tfrec.wsu.edu/OrganicIFP/OrganicFruitProduction/Organic%20TF%20Research%20Summary%20Sept03.pdf) (Accessed: 28 August 2010 ).
- Granatstein , D. and Sanchez , E. 2009 . Research knowledge and needs for orchard floor management in organic tree fruit systems . Intl. J. Fruit Sci. , 9 : 257 – 281 .
- Granatstein , D. , Kirby , E. and Willer , H. 2010 . Current world status of organic temperate fruits . Acta Hort , 873 : 19 – 36 .
- Hartz , T.K. , Smith , R.F. , LeStrange , M. and Schulbach , K.F. 1993 . On-farm monitoring of soil and crop nitrogen status by nitrate-selective electrode . Commun. Soil Sci. Plant Anal. , 24 : 2607 – 2615 .
- Johnson , R. S. 1996 . “ Manipulating vegetative and reproductive growth with water and nitrogen ” . In Tree Fruit Physiology: Growth and Development , Edited by: Maib , K. M. , Andrews , P. K. , Lang , G. A. and Mullinix , K. Yakima, WA : Good Fruit Grower .
- Marsh , K.B. , Daly , M. and McCarthy , T.P. 1996 . The effect of understory management on soil fertility, tree nutrition, fruit production and apple fruit quality . Biol. Agr. Hort. , 13 : 161 – 173 .
- Marsh , K. , Daly , M. and Rahman , A. 1998 . Sustainable fruit production: Nutrient cycling to manage the orchard floor . The Orchardist Sept , : 28 – 30 .
- Meagher , R.L. Jr. and Meyer , J.R. 1990 . Effects of ground cover management on certain abiotic and biotic interactions in peach ecosystems . Crop Protection , 9 : 65 – 72 .
- Merwin , I.A. , Ray , J.A. and Curtis , P.D. 1999 . Orchard groundcover management systems affect meadow vole populations and damage to apple trees . HortScience , 34 ( 2 ) : 271 – 274 .
- Meyer , J.R. , Zehr , E.I. , Meagher , R.L. Jr. and Salvo , S.K. 1992 . Survival and growth of peach trees and pest populations in orchard plots managed with experimental ground covers . Agr. Ecosystems Environ. , 41 : 353 – 363 .
- Nielsen , G.H. and Hogue , E.J. 1985 . Effect of orchard soil management on the growth and leaf nutrient concentration of young dwarf Red Delicious apple trees . Can. J. Soil Sci. , 65 : 309 – 315 .
- Nielsen , G.H. , Hogue , E.J. and Drought , B.G. 1986 . The effect of orchard soil management on soil temperature and apple tree nutrition . Can. J. Soil Sci. , 66 : 701 – 711 .
- Nielsen , G.H. , Meheriuk , M. and Hogue , E.J. 1984 . The effect of orchard floor management and nitrogen fertilization on nutrient uptake and fruit quality of ‘Golden Delicious’ apple trees . HortScience , 19 ( 4 ) : 547 – 550 .
- Raison , R.J , Connell , M.J. and Khanna , P.K. 1987 . Methodology for studying fluxes of soil mineral N in situ . Soil Biol. Biochem. , 19 : 521 – 530 .
- Roberts , P. 2008 . The end of food , Boston : Houghton Mifflin Company .
- Sanchez , E.E. , Giayetto , A. , Cichon , L. , Ferńandez , D. , Arnani , M.C. and Curetti , M. 2006 . Cover crops influence soil properties and tree performance in an organic apple (Malus domestica Borkh) orchard in northern Patagonia . Plant Soil , 292 : 193 – 203 .
- Shribbs , J.M. and Skroch , W.A. 1986 . Influence of 12 ground cover systems on young ‘Smoothie Golden Delicious’ apple trees: I. Growth . J. Amer. Soc. Hort. Sci. , 111 ( 4 ) : 525 – 528 .
- Simmons , M.R. 2005 . Twilight in the desert: The coming Saudi oil shock and the world economy , Hoboken, NJ : John Wiley and Sons, Inc .
- Skroch , W.A. and Shribbs , J.M. 1986 . Orchard floor management and overview . HortScience , 21 ( 3 ) : 390 – 394 .
- Stary , S. and Pike , K.S. 1999 . “ Uses of beneficial insect diversity in agroecosystem management ” . In Biodiversity in agroecosystems , Edited by: Collins , W.W. and Qualset , C.O . Boca Raton, FL : CRC Press .
- Woolbridge , J. and Botha , J.H. 1991 . Observations on orchard floor management practices: Implications for integrated pest management . Deciduous Fruit Grower , 41 ( 9 ) : 296 – 298 .
- Woolbridge , J. and Harris , R.E. 1989 . Effect of ground covers on the performance of young apple trees and on certain topsoil characteristics . Deciduous Fruit Grower , 39 ( 11 ) : 427 – 430 .