
Abstract
The convective drying of apples from two different cultivars, Golden Delicious and Granny Smith, in a range of temperatures from 30 to 60°C is studied. Some chemical and physical properties were determined fresh after drying: moisture, acidity and sugar content, color, and textural attributes, in order to evaluate the effect of drying and drying temperature on these properties. Furthermore, the drying kinetics were studied in terms of thin layer models and also by means of the Fick’s equation of diffusion, and some mass transfer properties were evaluated, such as effective moisture diffusivity and convective mass transfer coefficient. It was concluded that drying decreased both acidity and sugar content for both apple cultivars. Color was significantly affected by drying, resulting in high values of the total color difference, between 19.43 and 25.04. Drying turned the products less hard and less cohesive. Furthermore, it was found that mass diffusivity increased with temperature following an Arrhenius type function, where De0 was 5.4621 × 10⁻⁴ and 1.8401 × 10⁻⁴ m2/s, and E was 35.3 and 32.8 kJ/mol, respectively, for cultivars Golden Delicious and Granny Smith.
INTRODUCTION
Drying is a form of thermal processing, which involves simultaneous heat and moisture transfer in an unsteady state. Drying involves the use of heat to vaporize the water present in the food, as well as the removal of the water vapor from the food surface. In this way, it combines heat and mass transfer for which energy must be supplied. Making hot air flow over the food is the most common way of transferring heat to a drying material, being this process is mainly by convection (Khraisheh et al., Citation1997).
During drying many changes take place inside the foods, and these structural and physicochemical modifications affect the product properties: composition, color, texture, as well as those properties related to the heat and mass transfer. It has been reported in the literature that moisture transport varies widely in food materials, in view of their different physical structures as well as their chemical composition (Barroca et al., Citation2006; Faustino et al., Citation2007; Guiné, Citation2011).
The analysis of the drying processes allows the establishment of appropriate operating conditions. Therefore, food engineers need to understand some of the phenomena taking place during drying, which can be achieved by mathematical modeling. Many mathematical models have been used for this purpose, varying from models based on the diffusion laws to thin-layer models, which can be grouped into theoretical, semi-theoretical, and empirical (Doymaz, Citation2007). Furthermore, reliable process modeling demands a deep knowledge of the physicochemical behavior of the food, as well as the mechanisms of water removal, expressed by means of the drying kinetics.
Moisture diffusivity in solid foods can be accessed by different methods, which vary according to the geometry of the sample (infinite slab, infinite cylinder, or sphere) as well as the experimental conditions (steady state or non-steady state conditions). These methods have been used to estimate moisture diffusivity and rely on drying kinetics, sorption, or desorption kinetics, as well as moisture profile analysis (Mwithiga and Olwal, Citation2005).
Dincer and Dost (Citation1995, Citation1996) developed an analytical model to describe the mass transfer during drying and later Dincer and Hussain (Citation2004) developed a method to determine the mass transfer coefficient. Fick’s second law of diffusion can be used to describe the moisture diffusion process for food products allowing the means to calculate the effective diffusion coefficient.
The aims of this work were first to evaluate how drying and, in particular, drying temperature influenced the chemical and physical properties of apples from the cultivars Golden Delicious and Granny Smith; second it was intended to study the drying kinetics, either in terms of thin layer models or by means of the Fick’s equation for diffusion; and finally, it aimed to determine the diffusivities and the activation energy for diffusion, as well as the mass transfer properties, the convective mass transfer coefficient.
MATERIALS AND METHODS
Samples
In this study, apples from two commercial cultivars were used: Golden Delicious and Granny Smith. The apples were purchased in a local market, and were peeled and cut into 4 mm slices prior to drying.
Drying Procedure
The convective dryer used in this research consisted in structure with a parallelepiped shape with 0.56 m3 as represented in . The drier is made of stainless steel involved with insolating polyurethane. The air temperature inside the dryer was measured at six different locations, by six thermocouples (K type) homogeneously distributed and connected to a data acquisition board (TC-08, Pico Technology, Cambridgeshire, UK). The signal was obtained in degrees Celsius by the Pico Log Software Recorder 5.20.1 (Pico Technology). The weight was continuously measured and recorded inside the chamber. The evolution of the air relative humidity inside the dryer was monitored using a hygrometer (Opus10; Lufft, Fellbach, Germany) and the data was also downloaded on the computer.
FIGURE 1 Schematic representation of the drier: (a) dimensions and placement of temperature probes and (b) front view with placement of grids, scales, and lamps.
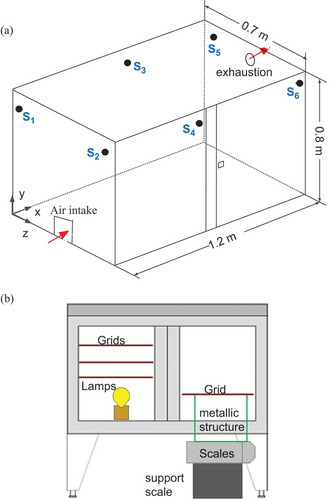
The air was heated by 4 lamps of 60 W each, connected to an on/off controller, in order to maintain the temperature constant. A low power fan was installed in the intake air grill to promote the renovation of the air inside the dryer.
The experiments were done at constant temperatures of 30, 40, 50, and 60°C. The endpoint of the drying process was when the apples reached a moisture content of about 2% or less (wet basis), thus giving a crunchy apple snack. The drying time varied from 20–25 h for the dryings at 30°C to about 8 h for the dryings at 60°C. The evolution of the moisture content of the samples was determined by weight loss along with drying.
Chemical Analyses
Some chemical properties of the apples were evaluated before and after drying: moisture, total soluble solids, and acidity. Moisture content was quantified with a halogen moisture analyzer (Model HG53; Mettler Toledo, Columbus, OH), which was previously calibrated for this type of fruit. Total soluble solids (TSS) and acidity were estimated according to the methodologies by the Association of Official Analytical Chemists (AOAC, Citation2012). The samples used were grinded and taken from different apples to obtain a homogeneous product. Four samples were used in every determination, and the results were given in terms of mean value and standard deviation. The acidity was expressed in malic acid.
Color Evaluation
The color of the fresh and dried samples was evaluated using a hand-held tristimulus colorimeter (CR-400 Chroma Meter, Konica Minolta, Tokyo, Japan). A Commission Internationale de l’Éclairage (CIE) standard illuminant D65 was used to determine CIE color space coordinates: L*a*b*. L* stands for brightness (black/white) and a* and b* stand for the opposing color coordinates (green/red and blue/yellow, respectively). The total color difference (ΔE) was calculated between a dried sample and the fresh fruit (used as reference and designated with the index 0):
For the color determinations, 20 measurements were done, and the corresponding mean value and standard deviation was calculated for each set of samples.
Texture Measurements
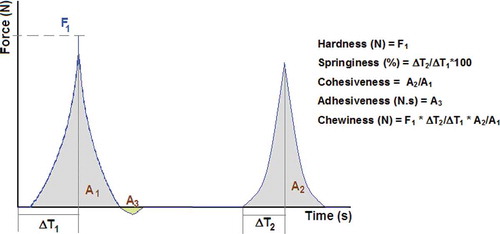
Textural properties were determined by means of texture profile analysis (TPA) done with a texture analyzer (model TA.XT.Plus, Stable Micro Systems, Godaming, Surrey, UK). The texture profile analysis consisted of two compression cycles using a flat 75-mm diameter plunger, with an interval of 5 s between cycles. A load cell of 5 kg was used and both the test and post-test speed were 0.5 mm/s. The textural properties: hardness, springiness, cohesiveness, adhesiveness, and chewiness were calculated after standard equations as indicated in . Twenty measurements were done for each case.
FIGURE 2 Typical texture profile analysis (TPA) with representation of the values and equations used to calculate the textural properties.
Statistical Analysis
The analyses made from the chemical properties (moisture, acidity, and TSS) as well as the physical properties (color and texture) were subject to a statistical evaluation in order to perceive if the different mean values were statistically different, using the Tukey HSD test at a level of significance of 95%. This test identifies which means are significantly different from each other, and consists of a single-step multiple comparison procedure, coupled to an analysis of variance (ANOVA). In this test, the difference between means is evaluated to see whether or not it is greater than the standard error. In this work, the statistical analysis was made using the software Statistica V6.1 (Statsoft, Tulsa, OK).
MATHEMATICAL MODELING
Thin Layer Models
The drying kinetics may be described in terms of the transport properties of the material as well as the drying air, and the thin layer models are equations that enable to estimate drying times and to access drying curves. They express the variations in moisture along drying in terms of parameters, such as the drying constant, k (1/s), or the lag factor, k0 (dimensionless), that account for combined effects of various transport phenomena during drying (Tripathy and Kumar, Citation2009). The data obtained experimentally was plotted in the form of the dimensionless variable moisture ratio (MR = (W – We)/(W0 – We)) versus time, where W is the moisture content at any time t, We is the equilibrium moisture content, and W0 is the initial moisture content, all expressed in dry basis (g water/g dry solids) (Mota et al., Citation2010).
The experimental sets of (MR, t) were fitted to different empirical models from the literature, cited by Baini and Langrish (Citation2007) and presented in . For that the software Sigma Plot, V8.0 (Systat Software, Inc., San Jose, CA) was used, and to evaluate the quality of each estimation, some statistical information was also determined: the correlation coefficient (R) and the standard error of the estimate (SEE). Furthermore, an analysis of variance was also included, providing information about the degrees of freedom (DF), sum of squares (SS), mean of squares (MS), the F-test, and the P-value.
TABLE 1 Empirical Models to Represent the Drying Kinetics
The Diffusion Model
Fick’s second law has been used for the mathematical modeling of drying kinetics and the estimation of the diffusion coefficients (Guiné et al., Citation2013). The drying data obtained in this work revealed that these apples did not present a constant rate period, and that drying took place mainly under falling rate conditions, as observed for other products (Guiné and Fernandes, Citation2006). In this way, it can be assumed that drying is governed by the internal mass transfer, being the moisture diffusion is the controlling step.
The non-steady-state diffusion for unidirectional mass transfer, assuming that the samples can be approximated to slabs, is expressed by (Crank, Citation1975):
For the transient diffusion, the solution of Fick’s Law can be approximated by an infinite series, but considering that, when the Fourier numbers are higher than 0.2 the second and following terms of the series can be neglected, the solution is given by (Vega et al., Citation2007):
By applying logarithms to Eq. (4), it can be expressed as a straight line of the form:
Considering that the effective diffusivity varies with temperature according to an Arrhenius type function:
Plotting ln(De) versus (1/T), a straight line is obtained with an intercept equal to ln(De0) and slope equal to –E/R, which allows estimating the values of De0 and E.
The Mass Transfer Correlations
For values of the dimensionless Biot number greater than 0.1, the convective mass transfer coefficient, hm (m/s), and the effective diffusivity are correlated by the Biot number for mass transfer (Dincer and Hussain, Citation2002; Jurendić and Tripalo, Citation2011):
Dincer and Hussain (Citation2002) show the equation that correlates the Biot number with the dimensionless Dincer number:
RESULTS AND DISCUSSION
Chemical and Physical Properties
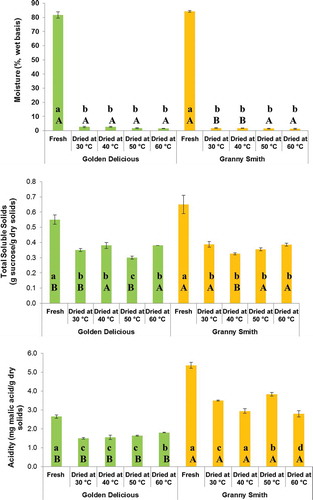
shows the medium values for moisture, total soluble solids (TSS), and acidity observed in the apples from both cultivars in the fresh and in the dry states at different temperatures, varying from 40 to 60°C. In relation to moisture, it was observed that apples from cultivar Golden Delicious had less water when compared to the cultivar Granny Smith apples, being the moisture content was respectively 82% and 84% (wet basis). When dried, all samples reduced their moisture content to very low values as expected for this crispy snack. The moisture decrease was around 98% in all cases. Acidity showed values of 3 and 5 mg malic acid/g dry solids, respectively, for cultivars Golden Delicious and Granny Smith (), thus confirming that the first is less acidic. Drying induced a decrease in acidity for both cultivars between 30% and 50%. This reduction can be due to vaporization of volatile acids, as well as degradation of some phenolic acids. The total soluble solids content in the fresh apples was 0.55 and 0.65 g sucrose/g dry solids, for cultivars Golden Delicious and Granny Smith, respectively. The drying treatments induced a marked reduction in the sugars content, being this decrease was higher for the cultivar Granny Smith apples than for the cultivar Golden Delicious. The reductions were an average of 38% and 45% for the Golden Delicious and Granny Smith cultivars, respectively. These reductions may be attributed to Mailhard reactions, in which the sugar molecules react with protein amino acids.
FIGURE 3 Chemical properties for the fresh and dried apples of both cultivars. Mean values with different superscripts are statistically different (P < 0.05). Lowercase superscripts aim at comparing one property for one cultivar in the different states (fresh or dried). Uppercase superscripts aim at comparing the two cultivars in the same state.
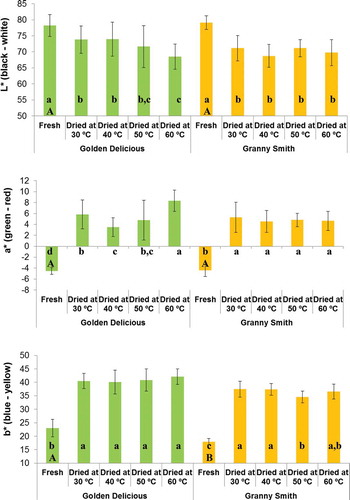
shows the values for the three color coordinates in the CIELab color space. The L* coordinate represents brightness and varies from 0 to 100, corresponding respectively to black and white. The coordinate a* is one of the color opposing coordinates and represents green for negative values and red for positive, varying from –60 to +60. The other opposing color coordinate, b*, corresponds to blue if negative and yellow if positive, also varying from –60 to +60. The color of the fresh apples revealed that L* and a* are very similar for both cultivars, whereas b* is just slightly higher for the Golden Delicious cultivar. The values of the color coordinates for the fresh Granny Smith apples were L* = 79, a* = −4, and b* = 18, being quite similar to those found by Picouet et al. (Citation2009), Vega-Gálvez et al. (Citation2012), and Moreno et al. (Citation2011) for the same apple cultivar. Furthermore, the results reveal that, in general, for both cultivars drying produced darker products with lower L* values. As reported by other researchers, prolonged drying at high temperature tends to favor browning reactions that cause a diminution in lightness (Acevedo et al., Citation2008; Vega-Gálvez et al., Citation2012). The a* parameter assumes negative values for the fresh state but after all drying, experiments become positive, thus turning from green to red. The coordinate b* always assumes positive values (yellow), but increases with drying. Hence, drying produced darker, reddish and more intense yellow apples, this is in accordance with the development of browning reactions, attributed to the activity of the polyphenol oxidase enzyme (Picouet et al., Citation2009). Also, Contreras et al. (Citation2008) observed an increase in all color parameters when drying cultivar Granny Smith apples. The drying air temperature did not show a decisive effect on color and just some slight changes are seen in the graphs, but they are not statistically significant.
FIGURE 4 CIELab color coordinates for the fresh and dried apples of both cultivars. Mean values with different superscripts are statistically different (P < 0.05). Lowercase superscripts aim at comparing one property for one cultivar in the different states (fresh or dried). Uppercase superscripts aim at comparing the two cultivars in the same state.
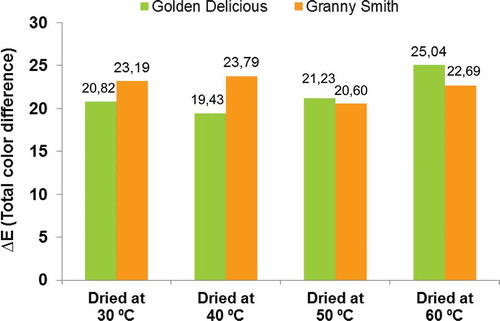
shows the total color change calculated by Eq. (2) having the fresh apples as reference. The graph shows that drying temperature did not influence the degree of color change, thus confirming what has been previously said. This finding can be due to the effect of two contradictory factors. If drying temperature increases, the intensity of the browning reactions would also increase, but in this case the temperatures are not too high. On the other hand, as the temperature increases, the drying time reduces drastically, thus allowing a much shorter exposure to the oxidizing effect of the hot drying air. Vega-Gálvez et al. (Citation2012) also reported similar observations for the drying of cultivar Granny Smith apples.
FIGURE 5 Color difference in relation to the corresponding color of the fresh product.
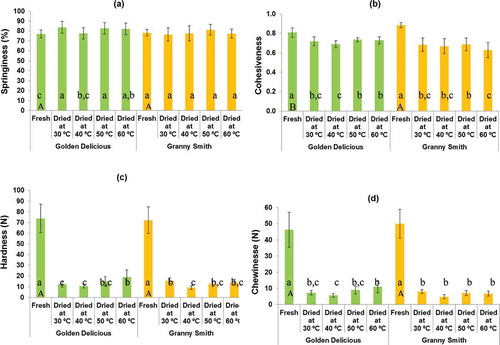
shows the textural parameters analyzed (springiness, cohesiveness, hardness, and chewiness) for the fresh and dried apples from both cultivars. Adhesiveness is not presented because the values encountered were negligible. The absence of adhesiveness has been reported previously in other researches (Guiné, Citation2013). Springiness measures the rate of regaining original shape after the removal of the compression force. shows that for the cultivar Golden Delicious springiness tends to increase with drying, regardless of the temperature, but this trend was not observed for the other cultivar of apples. reveals that cohesiveness, the degree to which the sample deforms before rupturing, diminishes in both cultivars from the fresh to the dried states, being the effect of temperature is not evident. The reduction in cohesiveness may be attributed to a loss of structure integrity during drying as a consequence of the intense degree of moisture loss. Hardness is the force required to deform the product, and shows a very pronounced decrease in this textural property with drying for both cultivars. Prothon et al. (Citation2001) also observed a decrease in firmness for the drying of cultivar Golden Delicious apples. shows chewiness, the work needed to masticate the sample to a consistency suitable for swallowing. This textural attribute is directly dependent on cohesiveness, springiness, and hardness. Therefore, the trends previously observed for hardness are also visible for the variations in chewiness, i.e., the intense decrease with drying for both cultivars, regardless of the temperature used.
FIGURE 6 Textural properties evaluated in the fresh and dried apples. Mean values with different superscripts are statistically different (P < 0.05). Lowercase superscripts aim at comparing one property for one cultivar in the different states (fresh or dried). Uppercase superscripts aim at comparing the two cultivars in the same state.
Drying Kinetics
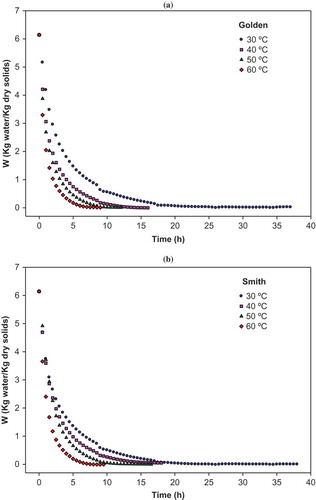
shows the variation of the dry basis moisture content along drying time. For both cultivars of apples studied, the moisture content decreases to a value very close to zero, corresponding to the equilibrium moisture content. Also, for both cultivars the results reveal that an increase in temperature results in an important reduction in drying time: 60% and 62% reduction, respectively, for cultivars Golden Delicious and Granny Smith, for a temperature increase from 30 to 60°C. This has important economic advantages, considering that this increase in temperature did not significantly affect the final product properties. also reveals that the drying rate decreases continually with time. The absence of the constant drying rate phase has been reported previously (Guiné et al., Citation2007).
FIGURE 7 Variation along drying of the dry basis moisture content for cultivars Golden Delicious (a) and Granny Smith (b).
The drying kinetics data obtained for the different temperatures studied (30, 40, 50, and 60°C), in the form of moisture ratio versus time, were fitted to four thin layer kinetic models commonly cited in the literature, whose equations are shown in . The fittings were done using the software Sigma Plot V8.0 (SPSS, Inc.), and the corresponding results are presented in to for each of the models tested. In each table are shown the values of the parameters in the model as well as the standard deviation. In addition, the results of the statistical analyses performed are also given: the number of experimental data points (N), the coefficient of correlation (R), and the standard error of the estimate (SEE). Finally the F-test and P-value are also provided. to , corresponding to models Page, Henderson and Pabis, or logarithmic, reveal that the fittings are good showing high values of the correlation coefficient always higher than 0.99. shows the fittings made with the Vega-Lemus model, and in this last case the values of R are slightly inferior, varying from 0.86 to 0.93. The P-values were highly significant in all cases (lower than 0.1%) and the values of the F-test were much lower in the fittings made with the Vega-Lemus model, confirming that this model was not so suitable to describe the drying kinetics of these apples. As to the other three models, and having in mind the high values of R and the high values of the F-test, the fits adequately describe the profiles of moisture ratio over time for the drying of these apples in the range of temperatures studied. The statistical information revealed that the best model was Page, although the logarithmic and the Henderson and Pabis would also be acceptable.
TABLE 2 Results of the Fitting to the Page Model
TABLE 3 Results of the Fitting to the Henderson and Pabis Model
TABLE 4 Results of the Fitting to the Logarithmic Model
TABLE 5 Results of the Fitting to the Vega-Lemus Model
The values of the drying constant for the Page model (), are on average 1.6 × 10⁻³ min−1 (2.6 × 10⁻⁵ s−1), being slightly higher than those reported by Roberts et al. (Citation2008) for the convective drying of grape seeds at temperatures from 40 to 60°C. The values for the drying constant encountered by these authors for the fitting with the Henderson and Pabis model were on average 4.8 × 10⁻⁶ s−1. On the other hand, Dincer and Hussain (Citation2002) reported a value for the drying constant of 9 × 10⁻⁴ s−1 for the drying of potatoes at 40°C, being this was higher than the ones found in this study. The values of the lag factor, k0, in models Henderson and Pabis and logarithmic ranged between 0.8700 and 0.9958, being close to that found by Dincer and Hussain (Citation2002), which was 1.0074 for the convective drying of potatoes. Corzo et al. (Citation2008) found the lag factor varying from 1.2666 to 1.4237 for the drying of mango in the range of temperatures from 50 to 90°C.
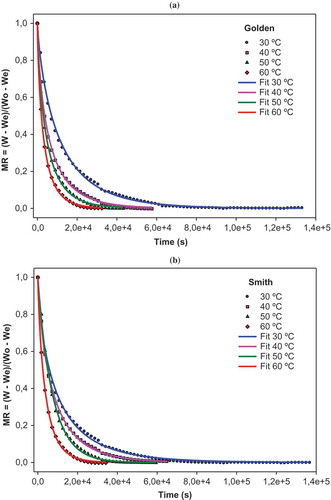
As the results indicated that the Page model was the best to fit the experimental data, shows the experimental points of (MR, t) obtained for the different temperatures together with the fittings obtained by the Page model. Both graphs, for the Golden Delicious cultivar and for the Granny Smith cultivar, are evidence that this model shows a good predicting capacity given the closeness of the experimental points to the fitting lines in all cases.
FIGURE 8 Fitting of the experimental points to the Page model for cultivars Golden Delicious (a) and Granny Smith (b).
Mass Transfer Properties
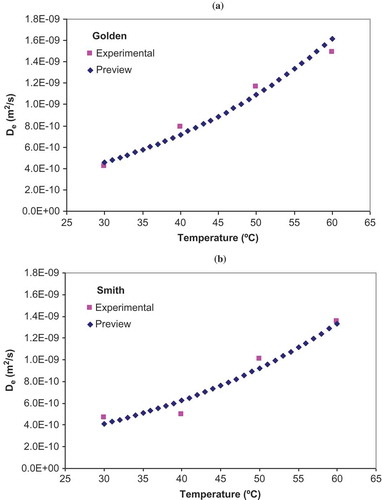
shows the results of the fittings of Eq. (5) to the experimental points, which allowed calculating the values of the effective moisture diffusion coefficients, De. The values of R2 are in all cases relatively high, varying from 0.93 to 0.99. The results show that diffusivity increases with temperature, varying from 4.22 × 10⁻¹⁰ m2/s to 1.44 × 10⁻⁹ m2/s for cultivar Golden Delicious and from 4.65 × 10⁻¹⁰ m2/s to 1.36 × 10⁻⁹ m2/s for cultivar Granny Smith. Vega-Galvéz et al. (Citation2012) reported for the drying of Granny Smith apples, diffusivities varying from 3.22 × 10⁻⁹ m2/s for 40°C and 0.5 m/s to 1.53 × 10⁻⁸ m2/s for 80°C and 1.5 m/s. Velic et al. (Citation2004) studied the convective drying of ‘Jonagold’ apples and found that the average moisture diffusivity ranged from 1.7 × 10⁻⁹ to 4.4 × 10⁻⁹ m2/s.
Equation (6) was used to calculate the values of the diffusivity for an infinite temperature, De0, and the activation energy for moisture diffusion, E, from the diffusivities previously calculated. shows the results obtained for the two cultivars of apples studied, and they evidence that the fittings were quite successful, given the values of the regression coefficients (over 0.9), thus confirming that the temperature dependence followed an Arrhenius type function. The values of De0 were 5.46 × 10⁻⁴ and 1.84 × 10⁻⁴ m2/s and the activation energy E was 35.3 and 32.8 kJ/mol, for cultivars Golden Delicious and Granny Smith, respectively. Corzo et al. (Citation2008) estimated for the convective drying of mango, the activation energy varying from 8.7 to 9.3 kJ/mol.
TABLE 6 Estimation of the Diffusion Coefficients for the Different Temperatures and Cultivars
TABLE 7 Estimation of the Parameters in Eq. (6)
shows the effective diffusivity in the range of temperatures studied. The experimental points are those from and the previews were obtained from Eq. (6) with the parameters presented in . Both graphs in show the exponential increase in diffusivity as the temperature is raised. The graphs also reveal that, while for lower temperatures no differences exist among cultivars, for higher temperatures cultivar Golden Delicious shows a higher diffusivity when compared to cultivar Granny Smith.
FIGURE 9 Experimental and predicted diffusivities for cultivars Golden Delicious (a) and Granny Smith (b).
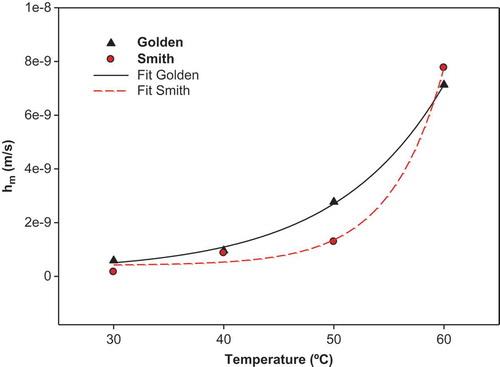
presents the values calculated for Biot number through Eq. (9), Dincer number through Eq. (10), and mass transfer coefficient through Eq. (8). The values of the Biot number tend to be higher for the cultivar Granny Smith than for the cultivar Golden Delicious, and the results show an increase in Biot number with temperature. Jurendić and Tripalo (Citation2011), for the convective drying of baby mixtures, reported values of the Biot number between 0.01 and 0.93, which stands in the same range as those found in this study. Also, for the convective drying of broccoli, Mrkic et al. (Citation2007) observed an increase in Biot number with temperature. The values of the Dincer number in vary from 1.25 × 10⁸ to 2.21 × 10¹¹. Dincer and Hussain (Citation2002) present a value of Di equal to 1.24 × 10⁴ for the air drying of potatoes at 40°C with an air velocity of 1 m/s. Mrkic et al. (Citation2007) found values of Di between 1.27 × 10⁵ and 3.66 × 10⁵, respectively, for the convective drying of broccoli at 75°C with air at 1.2 m/s and 50°C with air at 2.25 m/s. The moisture transfer coefficients, hm, vary between 1.61 × 10⁻¹⁰ m/s and 7.76 × 10⁻⁹ m/s. These values are quite inferior to some values found in the literature, although for other products and operating conditions. For the convective drying of baby mixtures, Jurendić and Tripalo (Citation2011) found values of hm between 2.7 × 10⁻⁸ and 4.2 × 10⁻⁵ m/s; Mrkic et al. (Citation2007) reported for values of hm between 1.92 × 10⁻⁴ m/s and 8.7310−4 m/s for the convective drying of broccoli; for the convective drying of potatoes, Dincer and Hussain (Citation2002) found a value hm of 3.27 × 10⁻⁵ m/s; and Tripathy and Kumar (Citation2009) reported hm ranging from 1.61 × 10⁻⁷ m/s to 4.17 × 10⁻⁷ m/s. The results shown in were fitted to exponential functions using software SigmaPlot V8.0 (SPSS, Inc.), as seen in , and which are described by the following equations:
TABLE 8 Estimation of the Mass Transfer Properties
FIGURE 10 Variation of the convective mass transfer coefficient with temperature.
CONCLUSIONS
We conclude that both acidity and sugar content were affected by drying for both apples studied. Acidity decreased from the fresh state to the dried forms, and so did sugars. Furthermore, the change in drying temperature was not observed to influence significantly the acidity or sugar content among the different dried samples.
Regarding color, both cultivars of apples showed approximately the same color either in fresh or after drying, thus we can conclude that Granny Smith or Golden Delicious apples are identical in terms of this physical attribute. As to the effect of drying, it was observed that the dried samples presented themselves as darker, with a more intense yellow coloration and also reddish, thus leading to relatively high values of the total color difference for all drying temperatures and for both types of apples.
Textural differences between both cultivars were not seen, but drying strongly affected the textural properties of the apples by decreasing hardness, chewiness, and cohesiveness.
In terms of thin layer drying kinetics, different models were tested and only the Vega-Lemus was not suitable to describe the drying kinetics of these apples. All others were found to give good results, most particularly the Page model.
Regarding the estimation of the mass transfer properties, it was found that the mass diffusivity increased with temperature for both cultivars of apples, and this followed an Arrhenius type function, having been possible to estimate the values of De0 and activation energy. For the ‘Golden Delicious’ apples, De0 was 5.46 × 10⁻⁴ m2/s and E was 35.3 kJ/mol, whereas for the ‘Granny Smith’ apples, De0 was 1.84 × 10⁻⁴ m2/s and E was 32.8 kJ/mol. Furthermore, for ‘Golden Delicious’ the moisture transfer coefficient varied from 5.85 × 10⁻¹⁰ m/s to 7.13 × 10⁻⁹ m/s and for ‘Granny Smith’ from 1.61 × 10⁻¹⁰ m/s to 7.76 × 10⁻⁹ m/s.
LITERATURE CITED
- Acevedo, N.C., V. Briones, P. Buera, and J.M. Aguiler. 2008. Microstructure affects the rate of chemical, physical and color changes during storage of dried apple discs. J. Food Eng. 85:222–231.
- AOAC. 2012. Official methods of analysis. 19th ed. Association of Official Analytical Chemists, Washington, DC.
- Baini, R., and T.A.G. Langrish. 2007. Choosing an appropriate drying model for intermittent and continuous drying of bananas. J. Food Eng. 79:330–343.
- Barroca, M.J., R.P.F Guiné, A. Pinto, F.M. Gonçalves, and D.M.S. Ferreira. 2006. Chemical and microbiological characterization of Portuguese varieties of pears. Food Bioprod. Proc. 84:109–113.
- Contreras, C., M.E. Martín-Esparza, A. Chiralt, and N. Martínez-Navarrete. 2008. Influence of microwave application on convective drying: Effects on drying kinetics, and optical and mechanical properties of apple and strawberry. J. Food Eng. 88:55–64.
- Corzo, O., N. Bracho, and C. Alvarez. 2008. Water effective diffusion coefficient of mango slices at different maturity stages during air drying. J. Food Eng. 87:479–484.
- Crank, J. 1975. The mathematics of diffusion. 2nd ed. Oxford University Press, London.
- Dincer, I., and M.M. Hussain. 2002. Development of a new Bi-Di correlation for solids drying. Int. J. Heat Mass Trans. 45:3065–3069.
- Dincer, I., and M.M. Hussain. 2004. Development of a new Biot number and lag factor correlation for drying applications. Int. J. Heat Mass Trans. 47:635–658.
- Dincer. I., and S. Dost. 1995. An analytical model for moisture diffusion in solid objects during drying. Dry. Technol. 13:425–435.
- Dincer, I., and S. Dost. 1996. A modeling study for moisture diffusivities and moisture transfer coefficients in drying of solid objects. Int. J. Energ. Res. 20:531–539.
- Doymaz, I. 2007. The kinetics of forced convective air-drying of pumpkin slices. J. Food Eng. 79:243–248.
- Faustino, J.M.F., M.J. Barroca, and R.P.F. Guiné. 2007. Study of the drying kinetics of green bell pepper and chemical characterization. Food Bioprod. Process. 85:163–170.
- Guiné, R.P.F. 2011. Influence of drying method on some physical and chemical properties of pears. Int. J. Fruit Sci. 11:245–255.
- Guiné, R.P.F. 2013. Variation of textural attributes of S. Bartolomeu pears at maturation, storage and drying. Int. J. Food Prop. 16:180–192.
- Guiné, R.P.F., and R.M.C. Fernandes. 2006. Analysis of the drying kinetics of chestnuts. J. Food Eng. 76:460–467.
- Guiné, R.P.F., D.M.S. Ferreira, M.J. Barroca, and F.M. Gonçalves. 2007. Study of the drying kinetics of solar-dried pears. Biosyst. Eng. 98:422–429.
- Guiné, R.P.F., M.J. Barroca, and V. Silva. 2013. Mass transfer properties of pears for different drying methods. Int. J. Food Prop. 16:251–262.
- Jurendić, T., and B. Tripalo. 2011. Biot number–lag factor (Bi-G) correlation for tunnel drying of baby food. African J. Biotechnol. 10:12706–12713.
- Khraisheh, M.A.M., T.J.R. Cooper, and T.R.A. Magee. 1997. Transport mechanisms of moisture during air drying processes. Food Bioprod. Process. 75:34–40.
- Moreno, J., R. Simpson, D. Estrada, S. Lorenzen, D. Moraga, and S. Almonacid. 2011. Effect of pulsed-vacuum and ohmic heating on the osmodehydration kinetics, physical properties and microstructure of apples (cv. Granny Smith). Innov. Food Sci. Emerg. Technol. 12:562–568.
- Mota, C.L., C. Luciano, A. Dias, M.J. Barroca, and R.P.F. Guiné. 2010. Convective drying of onion: Kinetics and nutritional evaluation. Food Bioprod. Process. 88:115–123.
- Mrkic, V., M. Ukrainczyk, and B. Tripalo. 2007. Applicability of moisture transfer Bi–Di correlation for convective drying of broccoli. J. Food Eng. 79:640–646.
- Mwithiga, G., and J.O. Olwal. 2005. The drying kinetics of kale (Brassica oleracea) in a convective hot air dryer. J. Food Eng. 71:373–378.
- Picouet, P.A., A. Landl, M. Abadias, M. Castellari, and I. Viñas. 2009. Minimal processing of a Granny Smith apple purée by microwave heating. Innov. Food Sci. Emerg. Technol. 10:545–550.
- Prothon, F., L.M. Ahrne, T. Funebo, S. Kidman, M. Langton, and I. SjoKholmw. 2001. Effects of combined osmotic and microwave dehydration of apple on texture, microstructure and rehydration characteristics. LWT–Food Sci. Technol. 34:95–101.
- Roberts, J.S., D.R. Kidd, and O. Padilla-Zakour. 2008. Drying kinetics of grape seeds. J. Food Eng. 89:460–465.
- Tripathy, P.P., and S. Kumar. 2009. A methodology for determination of temperature dependent mass transfer coefficients from drying kinetics: Application to solar drying. J. Food Eng. 90:212–218.
- Vega, A., E. Uribe, R. Lemus, and M. Miranda. 2007. Hot-air drying characteristics of Aloe vera (Aloe barbadensis Miller) and influence of temperature on kinetic parameters. LWT–Food Sci. Technol. 40:1698–1707.
- Vega-Gálvez, A., K. Ah-Hen, M. Chacana, J. Vergara, J. Martínez-Monzó, P. García-Segovia, R. Lemus-Mondaca, and K. Di Scala. 2012. Effect of temperature and air velocity on drying kinetics, antioxidant capacity, total phenolic content, colour, texture and microstructure of apple (var. Granny Smith) slices. Food Chem. 132:51–59.
- Velic, D., M. Planinic, S. Tomas, and M. Bilic. 2004. Influence of airflow velocity on kinetics of convection apple drying. J. Food Eng. 64:97–102.