
ABSTRACT
Genetic variation within specific fruit tree germplasms is an important tool in fruit tree breeding programs. In the present work, the genetic relationship of 31 European and Iranian (Pyrus communis L.) and Asian (Pyrus serotina Rehd) genotypes of pear were studied using 19 randomly amplified polymorphic DNA (RAPD) primers. Fifteen out of the 19 primers used in this study amplified 3373 clear and reproducible bands associated with 150 loci and many of them were polymorphic. The dendrogram resulting from the unweighted pair-group method of arithmetic cluster analysis separated the cultivars into eight groups. The correlation coefficient between the cophenetic matrix and the similarity matrix was 0.82 (r = 0.82). There was a significant difference between populations and most studied genotypes clustered closely together based on their geographic origin and Iranian pears placed between two groups of pears. Results showed the suitability of RAPD analysis in genetic diversity study of pear.
Introduction
Pyrus communis is the most commonly cultivated pear species in Europe, America, and Africa, whereas Pyrus serotina is the main cultivated species in Asia (Bell, Citation1990). Two primary origins and domestication centers have been reported for the Pyrus genus: the first is located in China, the second is located in Asia Minor to the Middle East (Vavilov, Citation1992). Also, Jookovskiy (Citation1950) believed that Caucasia and the western part of Iran are one of the centers of pear diversification. Some Pyrus species are distributed in different areas of Iran, mainly in alpine areas, and have been cultivated for nearly one thousand years, resulting in many unique traits. However, traditional cultivars have been threatened with extinction by urbanization and ongoing changes within a modernized fruit industry. There is growing concern that wild pear populations are gradually disappearing and accessions of indigenous germplasm have been replaced by a few improved cultivars (Yamamoto et al., Citation2002).
Conservation and sustainable use of plant genetic resources is a necessity for future food security. Advances in biotechnology have generated new opportunities for genetic resources, conservation, and utilization (Rao, Citation2004). Different methods were used to identify pear genotypes using morphological characteristics (Erfani et al., Citation2014; Paganava, Citation2003), isozymes (Chevreau et al., Citation1997), and biochemical composition (Challice and Westwood, Citation1973). Estimation of genetic diversity in pear (Pyrus spp.) is often very difficult because it is considered that there are at least nine natural or artificial interspecific hybrids (Bell, Citation1990). During recent years molecular-based markers, such as RFLP, AFLP, and SSR, were applied to study genetic diversity and pear cultivar relationships and origin (Bao et al., Citation2007; Kim et al., Citation2005; Monte-Corvo et al., Citation2000; Wünsch and Hormaza, Citation2007; Yamamoto et al., Citation2002). Random amplified polymorphic DNA (RAPD) markers were used to identify apple (Koller et al., Citation1993), plum (Koller et al., Citation1993), peach (Chaparro et al., Citation1994), and grape (Qu et al., Citation1996) cultivars. RAPD have been widely used in taxonomic classification and genetic diversity in fruit tree (Chaparro et al., Citation1994; Lisek and Rozpara, Citation2010; Oliveira et al., Citation1999). RAPDs have the advantage of being readily employed, requiring a very small amount of genomic DNA, and eliminating the need for blotting and radioactive detection.
Iran is geographically located between two centers of origin of genus Pyrus (Kole, Citation2011). In such a position, many different species might have contributed to the Iranian traditional pear germplasm (Nikzad Gharehaghaji et al., Citation2014). It is supposed that some of the most important Iranian cultivars have originated by hybridization of a European pear with an Asian pear (Erfani et al., Citation2012; Sharifani et al., Citation2008). In this current study, we set out to evaluate the relationship among Asian pear, some Iranian local pear cultivars and ecotypes, and European pear using RAPD markers.
Materials and methods
Plant materials
A total of 31 pear genotypes belonging to four distinct groups, including 15 European pears (Pyrus communis L.), 8 Asian pears (Pyrus serotina Rehd), 3 Iranian local pears cultivars (Pyrus communis L.), and 5 Iranian ecotypes (Pyrus spp.) were used in this study (). Leaf samples of Asian pears were collected from an Asian pear collection orchard at the department of horticultural science, Tarbiat Modares University (TMU), that was originally received by Iran from Belgium (Arzani, Citation2002, Citation2005). The other leaf samples for European and local pears were obtained from the Seed and Plant Improvement (SPII) collection orchard, located 20 km west of Karaj, Iran. The leaf samples were washed three times in sterile distilled water, frozen in liquid nitrogen, and kept at −80 °C until used.
Table 1. Name and origin of evaluated Pyrus genotypes and cultivars.
DNA extraction
Genomic DNA was extracted from pear leaves according to the CTAB method of Vroh Bi et al. (Citation1996) using the extraction buffer (3% w/v CTAB, 20 mM ethylenediaminetetraacetic acid (EDTA), 100 mM Tris-HCl (pH 8), 1.4 M NaCl, and 2% w/v polyvinylpyrrolidone (PVP)) with some modification. The purity and quantity of genomic DNA was determined spectrophotometrically by a nano drop spectrophotometer and confirmed using 0.8% agarose gel electrophoresis against known concentrations of unrestricted lambda DNA.
Primers and PCR assays
Nineteen primers were used for the analysis, 15 of which produced reproducible and polymorphic bands. The polymerase chain reaction (PCR) reactions were performed on an Eppendorf Master cycler (Gradient, No. 5331-41264, Hamburg, Germany) in a total volume of 25 µl containing 10 ng genomic DNA, 1× PCR buffer (with 1.5 mM MgCl2), 0.2 mM of each dNTPs, 10.5 pmol of each primer, and 1 unit of Taq polymerase (Takara Biotechnology Company, Shiga, Japan). The amplification was carried out with the following protocol: 5 min at 95 °C followed by 40 cycles of 30 s at 94 °C, 45 s at 36 to 42 °C, and 1.5 min at 72 °C followed by a final 7 min extension at 72 °C.
Following amplification, the PCR products (10 µL) were loaded in 1.5% agarose gels, stained with ethidium bromide in Tris-acetate-EDTA (TAE) buffer (40 mM Tris-acetate, 1 mM EDTA, pH 8.0), and separated by electrophoresis at 75 to 80 V for ≈ 2 h, and photographed on an ultraviolet transilluminator. The sizes of amplification products were determined by comparison with Lambda (λ) DNA digested with Eco RI and Hind III restriction enzymes.
Data analysis
For the genetic relationship analysis, each gel was analyzed by manually scoring the presence (1) or absence (0) of bands in individual lanes. Reproducible bands were used to calculate the Dice’s similarity coefficients (Nei and Li, Citation1979). A dendrogram was constructed based on the similarity matrix by the unweighted pair-group method of arithmetic analysis (UPGMA), using the NTSYS (Numerical Taxonomy System) program (Version 2.2; Rohlf, Citation1998). Number of observed alleles (Na), expected heterozygosity (He), and Shannon’s information index (I) (Shannon and Weaver, Citation1949) were obtained for each marker. Accordingly 0/1 matrix qi and pi (frequency of the null and dominant alleles, respectively) were calculated using the following equations, assuming Hardy-Weinberg equilibrium in the population:
He was calculated using the equation:
where is the homozygosity (Liu, Citation1998). Polymorphic information content (PIC) was calculated to evaluate the discriminatory power of molecular markers. The PIC values were determined by applying the formula: PICi = 2fi (1 – fi), where fi is the percentage of the amplified alleles (bands present) and (1 – fi) is the frequency of the null allele (band absent) for ith allele (Roldán-Ruiz et al., Citation2000). Data were entered in a binary matrix as discrete variables and analyzed with GenAlEx version 6.5 (Peakall and Smouse, Citation2012). Analysis of molecular variance (AMOVA) was used to evaluate population classification using GenAlEx version 6.5.
Results and discussion
Of 19 RAPD primers, the 15 primers that yielded clear, reproducible, and informative patterns were scored. A total of 150 reliable fragments (loci) were generated. The fragments ranged in size from 250 to 3000 base pairs (bp) and this range is in agreeance with the results reported by Teng et al. (Citation2002). The number of bands generated for each primer varied from 4 to 23 in OPD 01, 07, and OPC 06, respectively, with an average of 10 per primer (). These findings are also in line with those reported by Oliveira et al. (Citation1999) and Monte-Corvo et al. (Citation2000) in studies related to pear identification using RAPD markers. Among the 150 amplified loci, 95 showed polymorphism with an average of 6.33 polymorphic bands per primer that was higher than those reported by Cho et al. (Citation2012), while lower than what was reported by Monte-Corvo et al. (Citation2000).
Table 2. List of the primers used in RAPD analysis, their sequences, band scored (BS), no. of polymorphism band (NPB), percent of polymorphism (PP), no. of different allels (Na), expected heterozygosity of the marker (He), Shannon’s information index (I), and polymorphic information content of the markers (PIC).
The usefulness of each primer was examined in terms of percent of polymorphism, He, I, and PIC. In general, primer preference is dependent on the extent of polymorphism they exhibit. In the present study, OPC 06 and OPD 10 exhibited the highest (82.61%) and lowest (20.00%) polymorphism percentage, respectively. The average polymorphism observed by all of the 15 primers was found to be 57.32%, implying considerable variation at the DNA level within the Pyrus species.
He is the expected heterozygosity, which assumes that the population is under Hardy Weinberg equilibrium (Liu, Citation1998). High and low heterozygosity means that a lot and little of genetic variability exist, respectively. The He values varied from 0.07 to 0.28 in OPC 07 and OPE 03 primers, respectively, with an average of 0.21 (). Like He, I is another index that is commonly used to characterize species’ genetic diversity (Bao et al., Citation2007). Similarly, the highest and lowest values of I index were observed in the primers with highest and lowest He values, respectively.
PIC provides an estimate of discriminatory power of a marker by taking into account not only the number of alleles at a locus, but also their relative frequencies (Tessier et al., Citation1999). The PIC value for RAPD primers in the current study ranged from 0.06 in OPD 01 to 0.33 in OPC 06 with an average of 0.25 (). A comparison of the frequency of polymorphic bands with the PIC value for each primer showed that a greater number of polymorphic bands was associated with higher PIC values as previously reported by Liu et al. (Citation2008). In a previous study on pear genetic diversity, the mean PIC value of 0.6 has been reported using microsatellite markers (Safarpour Shorbakhlou et al., Citation2008) where a positive relationship was observed between PIC and He as well. High allele number and heterozygosity reflect the ability of markers to provide unique genetic profiles for individual plant genotypes (Zhebentyayeva et al., Citation2003). In this study, OPC 06 showed the highest polymorphism bands’ PIC values, and also high I and He values and produced the most informative DNA fragments for distinguishing genotypes ().
In other studies, genetic similarity values of Pyrus range from 0.02 to 0.98 based on RAPD and SSR data (Bao et al., Citation2007; Jiang et al., Citation2009; Kimura et al., Citation2002; Oliveira et al., Citation1999; Safarpour Shorbakhlou et al., Citation2008). The results of molecular characterization in our study indicated that the extent of genetic similarity in Pyrus species ranged from 0.57 to 0.80 (). Based on AMOVA analysis (), there was a significant difference between populations, and the diversity among populations (0.17) was less than within populations (0.83). This finding may indicate gene flow. Although the expected and observed heterozygosity observed by SSR (Jiang et al., Citation2009) and microsatelite (Volk et al., Citation2006) (the overal higher than 0.5) has been reported higher than the heterozygosity found by RAPD in the current study. The AMOVA results confirmed the significant genetic distance either among and within populations.
Table 3. Analysis of molecular variance (AMOVA) among and within populations.
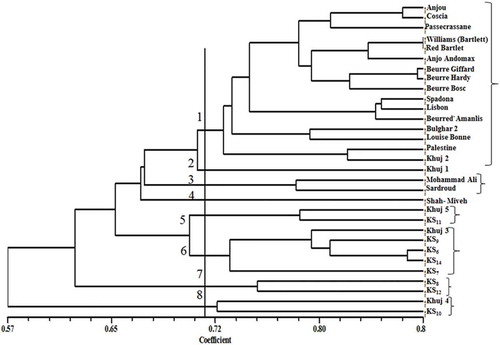
Figure 1. Dendrogram of 31 pear species, cultivars, and genotypes generated by UPGMA cluster analysis using the RAPD data based on Dice’s coefficient. (Source: Nei and Li, Citation1979.)
The Mantel test (Mantel, Citation1967) was used to determine the coefficient of correlation between the similarity matrices and ‘goodness of fit’ for the UPGMA dendrogram generated by the RAPD marker (Panwar et al., Citation2010). This was done by calculating the cophenetic correlation coefficient between the cophenetic matrix derived from the dendrogram and the corresponding similarity matrix. The cophenetic value (r = 0.82; p = 0.01) suggests that the cluster analysis strongly represents the similarity matrix and confirmed validity of RAPD markers. Schiliro et al. (Citation2001) also confirmed the potential of RAPD technology as a reliable, rapid, and inexpensive screening method to discriminate pear genotypes.
The clustering of the Pyrus species using RAPD results () indicates a first group, including ‘Anjou’, ‘Coscia’, ‘Passe Crassane’, ‘Williams’ (Bartlett), ‘Red Bartlet’, ‘Anjo Andomax’, ‘Beurre Giffard’, ‘Beurre Hardy’, ‘Beurre Bosc’, ‘Spadona’, ‘Lisbon’, ‘Beurre d’Amanlis’, ‘Bulghar 2’, ‘Louise Bonne’, ‘Palestine’, and ‘Khuj 2’. It has been previously reported that ‘Spadona’, ‘Coscia’, ‘Beurre Hardy’, and ‘Bulghar 2’ are grouped in the same cluster based on morphological characteristics (Erfani et al., Citation2014). ‘Khuj 1’ fell in the second group while ‘Mohammad Ali’ and ‘Sardroud’ comprised the third group. ‘Shah-Miveh’ solely made the fourth division, and ‘Khuj 5’ and ‘KS11’ were located in the fifth group. The sixth group included ‘Khuj 3’, ‘KS9’, ‘KS6’, ‘KS14’, and ‘KS7’. ‘KS8’ and ‘KS12’ clustered in the seventh group, and ‘Khuj4’ and ‘KS10’ were placed in the last group.
‘Shah-Miveh’, ‘Palestine’, and ‘Mohammad Ali’ clustered together based on morphological trait (Tahzibi Hagh et al., Citation2011). Mohammad Ali and Sardroud pears showed much higher affinity to European cultivars and these findings were in accordance with those reported based on morphological trait (Erfani et al., Citation2014) and SSR markers (Erfani et al., Citation2012). Shah-Miveh is a commercial cultivar that is mainly distributed in the center of Iran and it has been reported that this cultivar was derived from ‘Khuj’ and its evolution might have happened in the past (Erfani et al., Citation2014). Sabeti (Citation1976) believed that most Iranian pears were derived from the ‘Khuj’ genotype. Our results indicated that ‘Shah-Miveh’ was somewhere in the middle groups between ‘Khuj’ and those with European origin.
Pear classification using chemical and morphological characters divided the Pyrus genus into four principal groups of species: the East Asian pears, the larger-fruited East Asian pears, the North African pears, and the European and West Asian pears (Challice and Westwood, Citation1973). In the current study most Pyrus were clustered closely together according to their geographic origin, e.g., the first group included most European cultivars, Iranian commercial cultivars, and wild genotypes located in the middle groups and, finally, Asian cultivars clustered together. Briefly, Iranian commercial cultivars are close to European cultivars while wild ecotypes have more affinity to Asian genotypes. The finding of the current study confirmed the hypothesis that hybridization of European pear with Asian pear might happen and a middle group between those two has been generated.
In summary, a relationship was found between Pyrus samples and our result clearly demonstrated that RAPD marker assay is an inexpensive and fast marker for the preliminary genetic analysis of pear cultivars and genotypes. We can conclude that among the markers, OPC 06 showed the highest discriminating value. Further work will be needed in order to have a comprehensive understanding of genetic variation and diversity in Pyrus species and cultivars native to Iran, which will be of great help to solve the origin and evolution of pear species in this region.
Acknowledgments
We wish to thank Vali-e-Asr University of Rafsanjan for providing the facilities. Dr. Hosein Dashti is acknowledged for his technical assistance in the laboratory. Furthermore, we express our thanks to Dr. Nigel Gapper, Cornell University, Ithaca, NY, for doing the English revision of the manuscript.
Funding
This work was supported by Vali-e-Asr University of Rafsanjan (Grant number HS201 Agr84).
Additional information
Funding
Related Research Data
Literature cited
- Arzani, K. 2002. Introduction of some Asian pear cultivars (Pyrus pyrifolia) to Iran. Acta Hort. 596:287–290.
- Arzani, K. 2005. Progress in National Asian pear project: Study on the adaptation of some Asian pear (Pyrus serotina Rhed) cultivars under Iran environmental conditions. Acta Hort. 671:209–212.
- Bao, L., K. Chen, D. Zhang, Y. Cao, T. Yamamoto, and Y. Teng. 2007. Genetic diversity and similarity of pear (Pyrus L.) cultivars native to East Asia revealed by SSR (simple sequence repeat) markers. Genet. Resour. Crop Evol. 54:959–971.
- Bell, R.L. 1990. Pears (Pyrus), p. 665–697. In: J.N. Moore and J.R. Ballington (eds.). Genetic resources of temperate fruit and nut crops. International Society for Horticultural Science, Wageningen, Netherland.
- Challice, J.S., and M.N. Westwood. 1973. Numerical taxonomic studies of the genus Pyrus using both chemical and botanical characters. Bot. J. Linn. Soc. 67:121–148.
- Chaparro, J.X., D.J. Werner, D. O’Malley, and R.R. Sederoff. 1994. Targeted mapping and linkage analysis of morphological isozyme, and RAPD markers in peach. Theor. Appl. Genet. 87:805–815.
- Chevreau, E., S. Leuliette, and M. Gallet. 1997. Inheritance and linkage of isozyme loci in pear (Pyrus communis L.). Theor. Appl. Genet. 94:498–506.
- Cho, K.H., I.S. Shin, S.H. Kim, J.H. Kim, D.H. Kim, Y.U. Shin, and H.S. Hwang. 2012. Identification of Korean pear cultivars using combinations of SCAR markers. Hort. Environ. Biotechnol. 53:228–236.
- Erfani, J., A. Ebadi, H. Abdollahi, and R. Fatahi. 2012. Genetic diversity of some pear cultivars and genotypes using simple sequence repeat (SSR) markers. Plant Mol. Biol. Rep. 30:1065–1072.
- Erfani, J., A. Ebadi, H. Abdollahi, and R. Fatahi. 2014. Evaluation of genetic diversity of some pear (Pyrus spp.) genotypes and species based on morphological characteristics. Iran. J. Hort. Sci. 45:11–21.
- Jiang, Z., F. Tang, H. Huang, H. Hu, and Q. Chen. 2009. Assessment of genetic diversity of Chinese sand pear landraces (Pyrus pyrifolia Nakai) using simple sequence repeat markers. HortScience 44:619–626.
- Jookovskiy, P.M. 1950. Cultivated plants and their center of origins, 595 p. Savetskaya Science, Moscow, Russia.
- Kim, C.S., C.H. Lee, K.W. Park, S.J. Kang, I.S. Shin, and G.P. Lee. 2005. Phylogenetic relationships among Pyrus pyrifolia and P. communis detected by randomly amplified polymorphic DNA (RAPD) and conserved rDNA sequences. Sci. Hort. 106:491–501.
- Kimura, T., Y.Z. Shi, M. Shoda, K. Kotobuki, N. Matsuta, T. Hayashi, Y. Ban, and T. Yamamoto. 2002. Identification of asian pear varieties by SSR analysis. Breed. Sci. 52:115–121.
- Kole, C. 2011. Wild crop relatives: Genomic and breeding resources temperate fruits. Springer Heidelberg Dordrecht, Berlin, Germany.
- Koller, B., A. Lehmann, J.M. McDermott, and C. Gessler. 1993. Identification of apple cultivars using RAPD markers. Theor. Appl. Genet. 85:901–904.
- Lisek, A., and E. Rozpara. 2010. Identification of pear cultivars with RAPD and ISSR markers. J. Fruit Ornam. Plant Res. 18:17–22.
- Liu, B.H. 1998. Statistical genomics: Linkage, mapping and QTL analysis. CRC Press, Boca Raton, FL.
- Liu, W., X. Zhang, F. Li, and X. Ma. 2008. Genetic diversity of Cynodon dactylon accessions based on RAMP markers in hengduan mountains from southwest of China. Seed 27:56–59.
- Mantel, N. 1967. The detection of disease clustering and generalized regression approach. Cancer Res. 27:209–220.
- Monte-Corvo, L., L. Cabrita, C. Oliveira, and J. Leitão. 2000. Assessment of genetic relationships among Pyrus species and cultivars using AFLP and RAPD markers. Genet. Resour. Crop Evol. 47:257–265.
- Nei, M., and W.H. Li. 1979. Mathematical model for studying genetic variation in terms of restriction endonucleases. Proc. Natl. Acad. Sci. U.S.A. 76:5269–5273.
- Nikzad Gharehaghaji, A., H. Abdollahi, K. Arzani, A. Shojaeiyan, M. Naghi Padasht, L. Dondini, and P. De Franceschi. 2014. Contribution of western and eastern species to the Iranian pear germplasm revealed by the characterization of S-genotypes. Acta Hort. 1032:159–167.
- Oliveira, C.M., M. Mota, L. Monte-Corvo, L. Goulão, and D.M. Silva. 1999. Molecular typing of Pyrus based on RAPD markers. Sci. Hort. 79:163–174.
- Paganava, V. 2003. Taxonomic reliability of leaf and fruit morphological characteristics of the Pyrus L. taxa in Slovakia. HortScience 3:98–107.
- Panwar, P., M. Nath, V.K. Yadav, and A. Kumar. 2010. Comparative evaluation of genetic diversity using RAPD, SSR and cytochrome P450 gene based markers with respect to calcium content in finger millet (Eleusine coracana L. Gaertn.). J. Genet. 89:121–133.
- Peakall, R., and P.E. Smouse. 2012. GenAlEx 6.5: Genetic analysis in Excel. Population genetic software for teaching and research—An update. Bioinformatics 28:2537–2539.
- Qu, X., J. Lu, O. Lamikanra, V. Science, and A. Florida. 1996. Genetic diversity in Muscadine and American bunch grapes based on randomly amplified polymorphic DNA (RAPD) analysis. J Amer. Soc. Hort. Sci. 121:1020–1023.
- Rao, N.K. 2004. Plant genetic resources: Advancing conservation and use through biotechnology. Afr. J. Biotechnol. 3:136–145.
- Rohlf, F.J. 1998. NTSYS-pc: Numerical taxonomy and multivariate analysis system, version 2.0. Exeter Publishing, Setauket, New York.
- Roldán-Ruiz, I., J. Dendauw, E. Van Bockstaele, A. Depicker, and M. De Loose. 2000. AFLP markers reveal high polymorphic rates in ryegrasses (Lolium spp.). Mol. Breed. 6:125–134.
- Sabeti, H. 1976. Forests, trees and shrubs of Iran. Agricultural and Natural Resources Research Publications, Tehran, Iran.
- Safarpour Shorbakhlou, M., M. Bahar, B.E. Seyyed Tabatabaei, and H. Abdollahi. 2008. Determination of genetic diversity in pear (Pyrus spp.) using microsatellite markers. Iran. J. Hort. Sci. Technol. 9:113–128.
- Schiliro, E., S. Predieri, and A. Bertaccini. 2001. Use of random amplified polymorphic DNA analysis to detect genetic variation in Pyrus species. Plant Mol. Biol. Rep. 19:271–272.
- Shannon, C.E., and W. Weaver. 1949. The mathematical theory of communication, 144 p. University of Illinois Press, Urbana, IL.
- Sharifani, V., A. Erfani, C. Bagerian, T. Nishtani, and T.K. Yamamoto. 2008. Mutations in chloroplast DNA revealed relations and discriminations in genus Pyrus. Acta Hort. 800:355–364.
- Tahzibi Hagh, F., H. Abdollahi, A. Ghasemi, and D. Fathi. 2011. Vegetative and reproductive traits of some Iranian native pear (Pyrus communis L.) cultivars in climatical conditions of Karaj. Seed Plant Improv. J. 27:37–55.
- Teng, Y., K. Tanabe, F. Tamura, and A. Itai. 2002. Genetic relationships of Pyrus species and cultivars native to east Asia revealed by randomly amplified polymorphic DNA markers. J. Amer. Soc. Hort. Sci. 127:262–270.
- Tessier, C., J. David, P. This, J.M. Boursiquot, and·A. Charrier. 1999. Optimization of the choice of molecular markers for varietal identification in Vitis vinifera L. Theor. Appl. Genet. 98:171–177.
- Vavilov, N.I. 1992. Origin and geography of cultivated plants, vol. 15. Cambridge University Press, Cambridge, UK.
- Volk, G.M., C.M. Richards, A.D. Henk, A.A. Reilley, N.V, Bassil, and J.D. Postman. 2006. Diversity of wild pyrus communis based on microsatellite analyses. J. Amer. Soc. Hort. Sci. 131:408–417.
- Vroh Bi, I., L. Harvengt, A. Chandeller, G. Mergeal, and P.D. Jardin. 1996. Improved RAPD amplification of recalcitrant plant DNA by the use of activated charcoal during DNA extraction. Plant Breed. 115:205–206.
- Wünsch, A., and J.I. Hormaza. 2007. Characterization of variability and genetic similarity of European pear using microsatellite loci developed in apple. Sci. Hort. 113:37–43.
- Yamamoto, T., T. Kimura, M. Shoda, Y. Ban, T. Hayashi, and N. Matsta. 2002. Development of microsatellite markers in the Japanese pear (Pyrus pyrifolia Nakai). Mol. Ecol. Notes 2:14–16.
- Yamamoto, T., T. Kimura, Y. Sawamura, T. Manabe, K. Kotobuki, T. Hayashi, Y. Ban, and N. Matsuta. 2002. Simple sequence repeats for genetic analysis in pear. Euphytica 124:129–137.
- Zhebentyayeva, T.N., G.L. Reighard, V.M. Gorina, and A.G. Abbott. 2003. Simple sequence repeat (SSR) analysis for assessment of genetic variability in apricot germplasm. Theor. Appl. Genet. 106:435–444.