
ABSTRACT
Coffee trees show the fluctuation in production related to biannual phenological development. We aimed to quantify the berry distribution over the vertical profile and relate the chemical composition of coffee beans during few subsequent harvests in each of two production years (PY). The analyzed coffee productions followed severe pruning of plants grown in different planting designs. In the second PY, coffee plants loaded roughly fourfold more berries than the first PY. In the first PY, berry distribution in zones of plagiotropic axes that passed all physiological phases was characterized by random maturation over three harvests, while in the second PY, berry maturation over the orthotropic and plagiotropic axes differed between two harvests, suggesting higher impact of local light microclimate and, consequently, local source–sink relations. Proteins, sucrose, and lipids were the most sensitive studied chemical components when modifications in coffee beans composition were analyzed, considering the impacts of PY, harvest time, planting design, and berry position. Sucrose content increased in latter harvests, indicating better berry maturation compared to the first harvest in both PY. Protein and caffeine contents increased and lipids decreased in higher density and low plant layer during the second PY, suggesting that deposition of those components was modified by self-shading and maturation time related to the berry position over the plant profile.
Introduction
The Coffea arabica L. (Arabica coffee) architecture, described by the Roux’s model, is characterized by a continuous growth and dimorphic axes (Hallé et al., Citation1978). An orthotropic axis of first branching order forms plagiotropic axes of the second order that are bearing branches up to the fifth order. The highest branching orders appear in third or fourth year after planting or severe pruning (Rakocevic and Androcioli-Filho, Citation2010). Each year, foliage formation precedes intensive investments in berry growth and maturation (Silva et al., Citation2004). The second-order plagiotropic axes (in “coffee community” usually called “first plagiotropics”) have higher longevity and berry bearing capacity than higher order plagiotropic axes (Beaumont and Fukunaga, Citation1958).
Arabica coffee trees are the most productive between the ages of 7 and 20, but adequate plant management, as planting design and pruning, can maintain their output over the years. In very intensive coffee systems, the plantation life span is short, about 12–15 years, characterized by high plant density, from 3000 to 10,000 or even 20,000 plants ha−1 (Assis et al., Citation2014), and pruning in standardizing stumping back after few years of full production (Perfecto et al., Citation1996). The pruning has two essential roles: encourage the production of thrifty lateral growth capable of producing heavy annual crops (Beaumont and Fukunaga, Citation1958), and to permit that berries remain easily accessible. Some less severe types of pruning than stumping back, as leaf and shoot cluster thinning, could delicately modulate source–sink relations, which is an important tool controlling the relationship between yield and quality, and adjusting the complex chemical compositions in fruits (Kliewer and Dokoozlian, Citation2005).
Different planting patterns and densities are proposed to increase coffee production (Androcioli-Filho, Citation2002). Under higher densities, trees form thinner stems and smaller projection diameters when compared to plants growing on a wider space (Martinez et al., Citation2007). The increased population density results in lower coffee bean production per plant. A reduction of 93.5 g of processed coffee per plant (equivalent to 45%) is recorded with increasing number of plants from 2500 to 5000 plants ha−1 (Paulo et al., Citation2005). Considering that weight of one average coffee bean remains constant under different plant densities (Carr, Citation2001), greater yields per unit production area are achieved due to the increase in the number of plants per area. Reduced spacing also alters plant growth, because the self-shading alters the balance of growth regulators that stimulate terminal meristem development in woody species (Ford, Citation1985), and increases phyllochron in low layer and on higher branching orders of coffee plants (Correia et al, Citation2017).
Two to three intensive flowering flushes (from August to December), and consequently, two to three remarkably unsynchronized berry maturation flushes from May to August (Camargo and Camargo, Citation2001), occur each year in non-equatorial coffee production regions of Brazil (Pezzopane et al., Citation2003). Unsynchronized berry maturations are difficult in one-passage mechanical harvesting and impact on coffee bean quality.
The Arabica coffee trees, as many other horticulture species, show the fluctuation in production related to biannual phenological development (Monselise and Goldschmidt, Citation1982), where flower initiation can be strongly limited by an excessive crop in previous productive year. In coffee occurs alternation of vegetative and reproductive phases, six in totality (Camargo and Camargo, Citation2001; DaMatta and Ramalho, Citation2006), and the coexistence of two distinct phenophases of biannual cycle simultaneously, in a same moment of year, within the meta-population of axes of a same plant (Rakocevic et al., Citation2015). For example, the second-order plagiotropic axes of the highest plant layer or terminal part of many second-order plagiotropic axes could be in the first phase (Camargo and Camargo, Citation2001), while second-order plagiotropic axes in lower plant layers and middle branch zones could be simultaneously in third phase during flowering. The flowering and berry settings occur on second-order axes in zones that are subsequently reproductive and vegetative in two subsequent years, including the reproductive capacity of supported third-order axes in the later year (Beaumont and Fukunaga, Citation1958), but this alternation has never been quantified.
The concentration of principal chemical components in coffee beans depends on plant genetics (Bertrand et al., Citation2006; Leroy et al., Citation2006), environmental conditions (Bertrand et al., Citation2006; Jöet et al., Citation2010a, Citation2012), flowering uniformity (Soares, Citation2001), maturation stage (Joët et al., Citation2009; Pezzopane et al., Citation2012) cultural practices as fertilization, planting density, and pruning (DaMatta and Ramalho, Citation2006; Jaramillo-Botero et al., Citation2010; Morais et al., Citation2012), while is less impacted by year of production (Scholz et al., Citation2016) or biannual cycle (Silva et al., Citation1999).
The cultural practices of high density in monoculture grown coffee plants would modify the local light conditions (Scheel et al., Citation2015). The light microclimate over the coffee plant vertical profile will change the light availability for foliage, and consequently, for berries developed in different profile positions, view shading can diminish carbon assimilation by leaves, and consequently, the flux of carbon to berries, as the strongest botanical sinks (Cunha et al., Citation2007). Shading modifies the chemical composition in coffee beans and interferes in the sensory characteristics of the beverage (Bertrand et al., Citation2006; Vaast et al., Citation2006). The temperature and irradiation influence directly on the accumulation of chlorogenic acids, lipids, and sugar in coffee beans (Joët et al., Citation2010a). The deposition of chemical compounds in coffee beans may change during berry development (Pezzopane et al., Citation2012) but does not differ among three subsequent years (Scholz et al., Citation2016).
The hypotheses of this study were that berry distribution, as well as the coffee beans chemical composition, can be modified by cultural practices submitted to variations over the time. The aims were to (1) quantify the Arabica coffee berry distribution over the vertical tree profile and its modification under four planting designs, (2) analyze chemical composition of coffee beans obtained from berries harvested from four planting designs and collected in various harvesting periods of the first biannual production cycle after the severe pruning.
Materials and methods
Site and plant description
The experiment was set up at the Agronomical Institute of Paraná (IAPAR), Londrina (23°18′S and 51°17ʹW, 563 m above the sea level), Brazil, with adult C. arabica trees, of the most popular Paraná cultivar – IAPAR 59. The seedlings were planted in 1995 on dusky-red dystrophic latosol with addition of fertilizers (1000 kg ha−1 year−1 of 20:5:15 NPK split in four times). Plants were pruned twice by stumping back (first in 2000 and second in 2008), permitting the recuperation of the coffee plantation by remaining the most vigorous reiteration on each trunk. Two high plant densities (6000 and 10,000 plants ha−1) combined with two planting patterns (PP), square (Q), and rectangular (R), defined four treatments identified as Q10, R10 (3 m × 0.33 m), Q6 (1.29 m × 1.29 m), and R6 (3 m × 0.55 m).
Northwest Paraná climate is the frontier for Arabica coffee production (Assad et al., Citation2004; Caramori et al., Citation2001). The berry production and distribution, coffee bean chemical characteristics, of the first (2010) and the second (2011) production year (PY), correspondent to the second and third year after the 2008 severe pruning, were evaluated.
Nondestructive coffee plant architecture measurements were performed under VPlants (Pradal et al., Citation2008) before the first flush of berry maturing in two PY, for each of four planting design treatments. Data collection was performed in June 2010 and April 2011. The plants were coded in Multi Scale Tree Graphs – MTG (Godin and Caraglio, Citation1998). Following the VPlants methodology, the coffee plant topology was decomposed into three scales: the plant scale (P), the axes scale (G), the metamer scale, in which two distinct subclasses were used to distinguish the axes they belong to – orthotropic (O) and plagiotropic (E) (Rakocevic and Androcioli-Filho, Citation2010). All metamers on coffee plant and its properties were measured and counted, including leaf and internode properties, number of mature and immature berries, number of branches, branch positions, which allowed plant reconstructions by procedure specified for coffee trees (Matsunaga et al., Citation2016).
In the first PY, the plant architecture was composed by two 40-cm-thick layers over the vertical profile of coffee canopy, but predominantly the low layer contained berries. As plants grown, in the second PY, they were composed by three 40-cm-thick layers, but only axes from the low and middle layers produced berries. All visually mature berries of C. arabica were collected. In 2010, berries were collected in three harvesting periods (June, July, and August), while in 2011 were collected twice (May and June).
The berry number over the orthotropic axis included berry supporters of all plagiotropic orders. The distribution over the second-order plagiotropic axis summed all berries that were produced by “parental” metamer, accounting also the referent third-order production. The low layer comprised the height of cut trunk plus 7–9 orthotropic metamers (O1 to O7–O9); the middle layer was constituted on about 12 following orthotropic metamers and the highest superior layer comprised the rest of top metamers (>O19 or O21).
Chemical analysis
The collected berries were dried in the sun at a concrete yard until 12.5% of water content. After being dried, the beans were benefited (removal of bark and parchment) and all defective beans have been removed. The beneficiated material was stored in a dry and airy local on paper bags. The coffee beans from each treatment were frozen with liquid nitrogen at −196°C for physicochemical analyzes. They were grounded into PERTEN 3600 disk mill, passed in sieves with 0.5 mm meshes, packed in plastic bottles with screwing lids, and kept in a freezer at −18°C.
The determination of protein (PRO), caffeine (CAF), lipids (LIP), phenolic compounds (PC), chlorogenic acid (CGA), sucrose (SAC), total sugars (TS) were performed by near infrared spectroscopy methodology, with the prediction models for these components that were prepared in previous experiments (Scholz et al., Citation2014). The reducing sugars were obtained by subtracting SAC from TS. The spectra of the ground samples were collected on NIRSYSTEM 6500 spectrophotometer, Foss-Perstorp employing ISIscan software. Spectra were collected between 1100 and 2498 nm in 2-nm intervals using a rectangular cuvette containing about 10 g of ground coffee. The spectra were collected randomly and the data were analyzed by WinISI II software (Infrasoft Int.).
Data processing
Architectural data extraction from the MTGs was performed using AMAPstudio – Xplo software (Griffon and De Coligny, Citation2014). The special attention was paid on berry distribution along the orthotropic trunk and axes of second order. The extracted number of berries per rank index/metamer/axes was used to generate berry distributions.
All statistical analyses were performed using the R Software (R Development Core Team, Citation2017). ANOVA was used to compare berry number over 40-cm-thick layers and chemical components in coffee beans. The mixed model fitted by “lme” function was applied in analyses of the effects of planting design and harvest. Plant and/or axes repetitions/positions over orthotropic rank were considered as fixed effects in berry distribution analyses, while plant repetitions and/or layers were considered as fixed effects in chemical components analysis.
Results and discussion
Spatial berry distribution
Spatial berry distribution in the first PY
In the first PY, the berries were present on plagiotropic axes grown from the first to the 14th ranks of orthotropic axes, counting from the bottom to the top ( and ). In that year, the average plant was composed on 21–23 orthotropic metamers, having greater metamer number on first-order axis in rectangular than in square PP (Rakocevic et al., Citation2014).
Figure 1. Mean and standard error values of sum of berries per plant distributed over vertical (A and C) and horizontal profile, on the second-order axes (B and D), in the first production year (2010). The sum of berries collected in the first harvest is shown on upper line and sum of berries collected in the second and third harvests is represented at lower line. Plants were cultivated under two planting patterns (Q – square and R – rectangular) and densities (10,000 and 6000 plants ha−1).
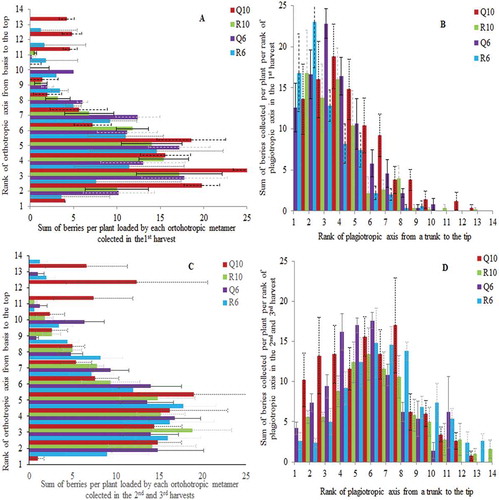
In the first PY, the distribution of berries over the orthotropic axes differed between two densities and two PP in the first harvest; the highest berry production was attributed to Q10 and the lowest to R6 PP (, ). The significant effect of planting design on berry distribution over orthotropic axis was not observed in latter harvests of the first PY (, ).
Table 1. ANOVA P-values for the effects of planting density (Dens, 10,000 and 6000 plants ha−1), planting pattern (PP, Q – square and R – rectangular) and rank of orthotropic and plagiotropic axes on the berry distribution in the first production year during the first and later harvests (second + third).
In the first PY, the highest concentration of berries was found in the low plant layer, originated on plagiotropic axes born at second to seventh orthotropic metamer ( and ). Some individuals in Q10 started the production from the first orthotropic rank in the first harvest () including individuals from R6 in later harvests (). In the middle layer, the berries were loaded by plagiotropic branches born at eighth to 14th orthotropic metamer, with a charge roughly twofolds lower per orthotropic rank. This difference in charge over the orthotropic axis was significant in the first and in later harvests ().
In the first PY, along the plagiotropic axes (counting from the insertion to the orthotropic metamer to the tip of axes), the berries were originated near the trunk, up to 14th plagiotropic metamer rank. That represented the first zone that in the previous chronological year was in vegetative phase and under bud induction (Camargo and Camargo, Citation2001). The lateral distribution of berries over the second-order axes was not influenced by PP in the first harvest (, ), while in later harvests, the berries were significantly more numerous in the zone close to the trunk (1st to fourth rank) in square than in rectangular PP (, ). The number of berries varied significantly over plagiotropic axes, with higher concentration in the zone from the first to fifth ranks in the first berry collection and from the first to eighth ranks in later harvests ( and ). The most shaded berries are situated very closely to the trunk, where occurs the highest berry production (Rakocevic et al., Citation2011). In Q10 and R6, the highest berry incidence was positioned on first and second metamer, while in Q6, it was shifted to the third and fourth metamer from the trunk (). The most shaded berries had the conditions of microclimate that possibilities slower ripening and slightly lower temperatures (Vaast et al., Citation2006; Bosselmann et al., Citation2009; Bote and Struik, Citation2011).
The general tendency of spatial berry distribution in the first and two latter harvests (second and third) was very similar. No significant difference in spatial berry distribution between harvests was observed (, first versus second + third harvest), suggesting that flowering flushes and berry maturing occurred in zones that previously passed all phenophases along the orthotropic and plagiotropic axes, in random manure in the first PY.
In the coffee structures described in the first PY, the leaf area per plant does not vary between planting treatments, but the final leaf area index (projection of total leaf area to the soil area) and berry production per hectare are significantly higher for 10,000 than for 6000 plants ha−1 (Rakocevic et al., Citation2014). The average berry number per metamer is higher in square than in rectangular PP, as the total berry production per hectare, because of greater possibility to regularly occupy space in horizontal sense (azimuth), which argue in favor of very dense plantation (10,000 plants ha−1) with a square PP in the first PY after the stumping back pruning.
Spatial berry distribution in the second PY
In the second PY, the plants grown by forming new metamers on orthotropic and plagiotropic axes, creating the more complex structure () than in the first PY (). In the second PY, the berries were present on plagiotropic axes grown from 1st to 22nd metamer rank of orthotropic axes, counting from the bottom to the top ( and ), distinguishing about 8 more metamers compared to the first PY ( and ). In this PY, the average plant was composed by 27–30 orthotropic metamers, representing higher metamer number and height in square PP and higher density – Q10 (not shown). This fact indicates the plant competition and apical dominance expressed in high-density designs of coffee culture practices (Sakai et al., Citation2015). The highest orthotropic metamers are branched in plagiotropic branches that appeared during the last year, passing the second phase, when occurs the transformation of the vegetative buds of the knots formed in the first phase to reproductive buds (Camargo and Camargo, Citation2001).
Figure 2. Mean and standard error values of sum of berries per plant distributed over vertical (A and C) and horizontal profile, on the second-order axes (B and D), in the second production year (2011). The sum of berries collected in the first harvest is shown on upper line and sum of berries collected in the second harvest is represented at lower line. Plants were cultivated under two planting patterns (Q – square and R – rectangular) and densities (10,000 and 6000 plants ha−1).
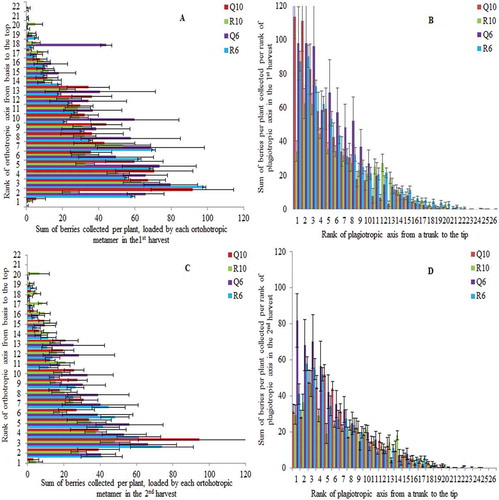
Usually, the biannual production cycles in coffee culture are characterized by variation of about 60–80% between two years of a cycle, lowering the variation under shading compared to full sun conditions (Vaast et al., Citation2006). In the second PY of our experiment, coffee plants loaded roughly fourfold more of berries () compared to the first PY (), showing much higher variation than observed in years of full production (Vaast et al., Citation2006). As in the first PY, in the second PY, about upper eight metamers did not load berries, because they were formed in the last 8–9 months of growth. In Arabica coffee, the development of flowers from the buds takes several weeks, that of the berries several months after flowering, with periods of growth and of dormancy (Oestreich-Janzen, Citation2010). The sequence of steps is enzymatically controlled in coffee plants and is triggered externally by photoperiodism, relief of water stress, and temperature drop.
In the second PY, the distribution of berries along the orthotropic axes differed between two densities and two planting patterns (PP) in the first and second harvests ( and ; ). The berry production was stimulated in square PP and higher density (, ). The highest berry concentration continued in the low layer, as in the first PY; however, the berry production in second PY was loaded not only on second-order plagiotropic branches but also on third and sporadically fourth-order ones. In the middle layer, the berries were loaded by plagiotropic branches born from 8th to 18th orthotropic metamer, with a charge lower than in low layer. Very low berry production was found in the upper layer ( and ).
Table 2. ANOVA P-values for the effects of planting density (Dens, 10,000 and 6000 plants ha−1), planting pattern (PP, Q – square and R – rectangular), occurrence over the 40-cm-thick layers and rank of orthotropic and plagiotropic axes on the berry distribution in the second production year during the first and second harvests.
In the second PY, the sum of berries produced on second-order axes and their branches were localized up to 26th metamer counting from the branch insertion to a trunk to the tip of the branch, having the highest concentration near the trunk ( and ). The lateral distribution of berries was influenced by PP in both harvests (). In the first harvest, the plagiotropic metamers near the trunk loaded more berries under square PP and higher density than under rectangular PP (, ). The most distal productive metamers were found under lower planting density (Q6 and R6, ) in the first harvest. In the second harvest, the berry production diminished roughly twice () on metamers near to trunk (first to fifth) compared to the first harvest (), while in most distal metamers of plagiotropic axes, the berry production was less reduced. The Q6 planting design was less impacted by the harvest period, with pretty equal number of berries along the plagiotropic axes in both periods of collection ( vs. ). The spatial berry distributions in the first and second harvests were significantly different (), suggesting that flowering flushes and maturation over orthotropic and plagiotropic axes in the second PY were more impacted by microclimate than in the first PY. This was related to growing competition for light between plant organs; the most shaded berries, those near to the trunk, have the conditions of microclimate that possibilities slower ripening and slightly lower temperatures (Bertrand et al., Citation2012; Vaast et al., Citation2006), and they are not always associated to chlorophyll content modifications (Scheel et al., Citation2016).
In the coffee structures described in the second PY, the leaf area per plant did not differ between planting treatments, but the final leaf area index (not published data) and berry production per hectare were significantly higher under density of 10,000 than 6000 plants ha−1, as in the first PY. The increasing complexity of tree structure leaded not only to increased competition for resources but also to higher berry production.
Coffee beans chemical modification over the time, space, and planting design
Coffee beans chemical modification in the first biannual production cycle
The LIP, RS, and CGA contents were significantly higher in the first PY than in the second PY, while the SAC and CAF contents had the opposite response to the PY (). The PRO, PC, and TS contents have not been influenced by the PY. The SAC content was higher in the second than in the first PY, while the RS content showed the inversed response. This would not be attributed to leaf area available for each produced berry that significantly diminished in the second PY compared to the first PY (data not shown), because it was more than enough for berry maturation, higher than 20 cm2 per one matured berry (Cannell, Citation1985). Probably, the maturation degree was higher in the second PY, attained more homogeneously in two harvest periods, compared to three collections in the 2st PY. No significant difference in TS between two PYs was a consequence of opposite responses in SAC and RS contents over years.
Table 3. Means (g 100 g−1) and Tukey test following by ANOVA P-values for the effects of production year (PY, first and second after the low tree pruning), planting densities (Dens, 10,000 and 6000 plants ha−1) and patterns (PP, Q – square and R – rectangular) on chemical compounds of coffee beans.
The higher the planting density, the higher was the content of PRO and CAF (). This suggests that PRO and CAF contents were promoted by self-shading. Shading conditions promote the synthesis of nitrogenous compounds (Carelli and Fahl, Citation2006). Coffee beans originated from square PP showed higher content of PC and CGA. PC and CGA are the components that are modulated by berry maturation (Joët et al., Citation2010b) and higher CGA content is the consequence of incomplete maturation (Joët et al., Citation2009, Citation2010b). The higher CGA and PC contents in square PP could be the consequence of lower light availability around the tree trunk, considering the higher berry loading of plagiotropic ranks near to the trunk in square than in rectangular PP (, and ,). No interaction between the studied temporal and spatial factors was observed.
There is no year effect on the chemical components in Arabica coffee accessions originating from Ethiopia (Scholz et al., Citation2016) or on the diterpene profile among the cultivars of different genetic backgrounds (Kitzberger et al., Citation2016). The year effect on chemical components variation observed in our experiment could be related to (1) very first biannual cycle of production, characterized with high annual variation in production ( and ), (2) genetic properties of cultivar IAPAR 59, which represents C. arabica crosses with introgressions of C. canephora (Ito et al., Citation2008), and finally (3) increased competition for light and other resources in the second PY. Resource competition could modify the carbon partitioning between vegetative and reproductive organs, impacting the berry maturity (Campanha et al., Citation2004). Judging the chemical composition, the berry maturation was more accomplished in the second PY ().
Coffee beans chemical modification in the first PY
In the first PY, the PRO content was higher in the first harvests than in the two latter ones, while the LIP content showed the inverse response (). The TS and SAC were formed in higher content in the first and third than in the second harvest, while the RS, CAF, and PC contents were not modified by a harvest period. The lowest concentration of CGA was found in the third harvest. This indicates that the longer the berries stayed on the plant, the more complete is the maturation (Fagan et al., Citation2011), even their higher concentration over the plagiotropic axes was more disperse in latter than in the first harvest ( and ). The RS increases while the perisperm is still present with the endosperm that shows doughy appearance (Geromel et al., Citation2008; Laviola et al., Citation2007). After the endosperm modification to the solid state, the SAC concentration increases until the harvest. The greatest accumulation of sucrose occurs in the transition from green to mature berries, so the more mature is the berry, the higher is the concentration of sucrose (Pezzopane et al., Citation2012). The concentration of CGA tends to decrease during berry ripening (Joët et al., Citation2009; Koshiro et al., Citation2007).
Table 4. Means (g 100 g−1) and Tukey test following by ANOVA P-values for the effects of harvest periods, planting densities (Dens, 10,000 and 6000 plants ha−1) and patterns (PP, Q – square and R – rectangular) on chemical compounds of coffee beans in the first production year.
The spatial planting design (density and PP) influenced particularly the sugars and caffeine contents (). In higher density were found more SAC and TS. The function of carbon transport between cells is attributed to SAC (Carelli and Fahl, Citation2006; Joët et al., Citation2009; Laviola et al., Citation2007), and the SAC accumulation indicates the best moment for harvest (Pezzopane et al., Citation2012). The RS content was the only one studied coffee bean component modified by PP, representing higher concentrations under the square PP in the third harvest that could be attributed to longer berry permanence on the plant.
Coffee beans chemical modification in the second PY
In the second PY, the harvest period influenced the LIP, sugars, and CAF contents (). The LIP content was reduced from the first to the second harvest, while the CAF content showed the opposite trend. The increase in TS content in the second compared to the first harvest was a consequence of the SAC increase and constant RS values. Again, the increasing SAC concentration in latter harvest can be explained by longer berry permanence on the plant.
Table 5. Means (g 100 g−1) and Tukey test following by ANOVA P-values for the effects of harvest periods, planting densities (Dens, 10,000 and 6000 plants ha−1) and patterns (PP, Q – square and R – rectangular) on chemical compounds of coffee beans in the second production year.
Number of berries collected in the second harvest was about two times lower than in the first harvest () that could impact the beans quality through the more available carbon investments. In subtropical climate of South hemisphere, the winter period (second harvest) is characterized by lower temperatures than the temperatures during the autumn (first harvest) (Aparecido et al, Citation2016). Generally, low temperatures decrease the concentration of lipids in grains and seeds (Joët et al., Citation2010a; Singer et al., Citation2016; Villarreal et al., Citation2010).
In the second PY, the planting density influenced the modifications of number of chemical compounds (PRO, LIP, and CAF), more than the plating pattern (only LIP). Higher density promoted and rectangular PP decreased the deposition of cited compounds. Similar tendencies in LIP, PRO, and CAF fluctuations relative to planting management are shown exploring one different methodology, as ultraviolet characteristic profiles and infrared spectroscopic fingerprints (Terrile et al., Citation2016).
Coffee beans chemical modification over the vertical profile
The chemical modification of berries over the vertical tree profile was analyzed only in the second PY (), when plants attained height and branching structure that loaded berries over three 40-cm-thick layers ( and ). The negative gradient in PRO and CAF contents was observed from the base to the top of the coffee plants (), while the PC content in coffee beans had the positive gradient over the vertical profile in the second PY. PRO and CAF concentrations were higher in 10,000 plants ha−1 than in 6000 plants ha−1, while only the PRO content was modified comparing two PP, which has been promoted under the square PP.
Table 6. Means (g 100 g−1) and Tukey test following by ANOVA P-values for the effects of vertical profile localization of coffee berries over the 40-cm-thick layers, planting densities (Dens), and patterns (PP) on chemical compounds of coffee beans in the second PY.
The nitrogenous compounds, as PRO and CAF, decreased as the light availability over the vertical profile increased (; ). A reduction in nitrogenous compounds in coffee plants grown in full sun is due to the inhibition of nitrate reductase activity (Carelli and Fahl, Citation2006). No significant difference was observed for other compounds over the vertical plant layers and planting design.
In the first PY, the PRO content was higher and the LIP content was lower in the first than in the two latter harvests; the RS represented higher concentrations under the square PP in the third harvest. In the second PY, the LIP was reduced, while TS, SAC, and CAF contents increased in the second compared to the first harvest. The increasing sugar concentration in latter harvests can be explained by longer berry permanence on the plant. The protein and lipid compounds were the most sensitive component among the evaluated chemical components, to all the temporal and spatial modifications. They are together present in thylakoid membranes that are dynamic systems in which the lateral mobility of proteins and lipids plays a key role in physiological processes including electron transport, regulation of light-harvesting, membrane biogenesis, and turnover and repair of proteins. Plants need to compensate changes in thylakoid membrane fluidity to prevent the negative impacts of environment (Murata, Citation1989). The active restructuring of membranes with respect to negative temperature effects has been studied in some species as Arabidopsis thaliana (Routaboul et al., Citation2000), cotton and potato (Welti et al., Citation2007). Common strategies to maintain adequate membrane fluidity involve the incorporation of polyunsaturated fatty acids, the conformation of double bonds, the length of fatty acyl chains, and the presence of sterols (Mullineaux and Kirchhoff, Citation2009). Our results indicate that the high lipid component could be related to membrane maintenance during longer berry permanence on plants occurring in the second harvest under low competition between plants in the first PY, and in the first harvest under lower plant density when higher competition between plants was attained in the second PY. The protein compound deposition in coffee beans decreased as increased the light availability, very probably more related to enzymatic content and functioning than to membrane maintenance.
Conclusions
The first novelty of our work is that we dimensioned the berry distribution over the horizontal and vertical profiles of Arabica coffee plants for one biannual production cycle. This quantification used different scales, from the finest macroscopic architectural one – metamer, through branches and layers up to plant scale. The second novelty is the year effect on chemical components in coffee beans between two subsequent years. Results are related to the very first biannual cycle of production, with probable modifications in direction of carbon partitioning between vegetative and reproductive organs, which finally impacted berry maturity and grain composition.
The berry distribution and total berry number calculated per soil area, together with chemical composition of coffee beans argue in favor of very dense plantation (10,000 plants ha−1) in both PY. The increasing SAC concentration in latter harvests can be explained by longer berry permanence on the plant, permitting more complete bean maturation. In this sense, our data support the selective berry collection, when possible even with mechanical harvesting, to obtain better quality of coffee beans in totality.
The better chemical quality was judged under the square PP in the first PY, receiving the fine shifting to the rectangular PP in the second PY, when the competition between plants increased. These findings support the modern coffee cultural planting design in lines with large interline spaces preview for machine management.
Acknowledgments
M.R. thanks the Consórcio Pesquisa Café for a granted fellowship. The research work was carried out with the support of Consórcio Pesquisa Café and IAPAR, projects N 02.09.20.008.00.00 and 02.13.02.042.00.00.
References
- Androcioli-Filho, A. 2002. Café adensado - Espaçamentos e cuidados no manejo da lavoura. Circular N° 121, IAPAR. 32p. <www.iapar.br/arquivos/File/zip_pdf/ct121.pdf>.
- Aparecido, L.E.O., G. de Souza Rolim, J. Richetti, P.S. Souza, and J.A. Johann. 2016. Köppen, Thornthwaite and Camargo climate classifications for climatic zoning in the State of Paraná, Brazil. Ciência Agrotecnol. 40(4):405–417.
- Assad, E.D., H.S. Pinto, J. Zullo-Junior, and A.M.H. Ávila. 2004. Impacto das mudanças climáticas no zoneamento agroclimático do café no Brasil. Pesq. Agropec. Bras. 39(11):1057–1064.
- Assis, G.A., M.S. Scalco, R.J. Guimarães, A. Colombo, A.W. Dominghetti, and M.S.N. Matos. 2014. Drip irrigation in coffee crop under different planting densities: growth and yield in southeastern Brazil. Rev. Bras. Engen. Agríc. Ambient 18(11):1116–1123.
- Beaumont, J.H., and E.T. Fukunaga. 1958. Factors affecting the growth and yield of coffee in Kona, Hawaii. Bulletin 113 <https://www.ctahr.hawaii.edu/oc/freepubs/pdf/B-113.pdf>.
- Bertrand, B., R. Boulanger, S. Dussert, F. Ribeyre, L. Berthiot, F. Descroix, and T. Joët. 2012. Climatic factors directly impact the volatile organic compound fingerprint in green Arabica coffee bean as well as coffee beverage quality. Food Chem. 135(4):2575–2583.
- Bertrand, B., P. Vaast, E. Alipizar, H. Etienne, F. Davrieux, and P. Chamatent. 2006. Comparison of bean biochemical composition and beverage quality of Arabica hybrids involving Sudanese-Ethiopian origins with traditional varieties at various elevations in Central America. Tree Physiol. 26:1239–1248.
- Bote, A.D., and P.C. Struik. 2011. Effects of shade on growth, production and quality of coffee (Coffea arabica) in Ethiopia. J. Hortic. For. 3(1):336–341.
- Bosselmann, A.S., Dons, K., Oberthur, T., Smith-Hall, C., and A. Ræbild. 2009. The influence of shade trees on coffee quality in small holder agroforestry systems in southern Columbia. Agric. Ecosys. & Environ. 129(1):253–260.
- Camargo, A.P., and M.B.P. Camargo. 2001. Definição e esquematização das fases fenológicas do cafeeiro arábica nas condições tropicais do Brasil. Bragantia 60(1):65–68.
- Campanha, M.M., R.H.S. Santos, G.B. Freitas, H.E.P. Martinez, S.L.R. Garcia, and F.L. Finger. 2004. Growth and yield of coffee plants in agroforestry and monoculture systems in Minas Gerais. Brazil. Agrofor. Syst. 63(1):75–82.
- Cannell, M.G. 1985. Physiology of the coffee crop, p. 108–134. In: Clifford M.N. and Willson K.C. (Eds.). Coffee - Botany, biochemistry and production of beans and beverage. Crom Helm, London.
- Caramori, P.H., J.H. Caviglione, M.S. Wrege, S.L. Gonçalves, R.T. Faria, A. Androcioli-Filho, T. Sera, J.C.D. Chaves, and M.S. Koguishi. 2001. Zoneamento de riscos climáticos para a cultura de café (Coffea arabica L.) no Estado do Paraná. Rev. Bras. Agrometeorol. 9:486–494.
- Carelli, M.L.C., and J.I. Fahl. 2006. Partitioning of nitrate reductase activity and its relation to carbon assimilation under different irradiance regimes. Braz. J. Plant Physiol. 18(3):397–406.
- Carr, M.K.V. 2001. The water relations and irrigation requirements of coffee. Exp. Agricul. 37:1–36.
- Cunha, R.L., S.C.V. Martins, F.G. Villela, W.C. Antunes, and F.M. DaMatta. 2007. Metabolism and photosynthetic carbon partitioning in response to source: sink manipulation in field-grown Coffea arabica L. trees. Anais de V Simpósio de Pesquisa dos Cafés do Brasil. <http://www.sbicafe.ufv.br/handle/123456789/2272>.
- DaMatta, F.M., and J.D.C. Ramalho. 2006. Impacts of drought and temperature stress on coffee physiology and production: a review. Braz. J. Plant Physiol. 18(1):55–81.
- Fagan, E.B., de Souza, C.H.E., Pereira N.Maria.B., and V.J. Machado. 2011. Efeito do tempo de formação do grão de café (Coffea sp) na qualidade da bebida. Biosci. J. 27(5):729–738
- Ford, E.D. 1985. Branching, crown structure and the control of timber production, p. 228–252. In: Cannell M.G.R. and Jackson J.E. (Eds.). Attributes of trees as crop plants. Titus Wilson & Son Ltd, Kendal, Cumbria.
- Geromel, C., L.P. Ferreira, F. Davrieux, B. Guyot, F. Ribeyre, M.B.S. Scholz, L.F.P. Pereira, P.H. Vaast, D. Pot, T. Leroy, et al. 2008. Effects of shade on the development and sugar metabolism of coffee (Coffea arabica) fruits. Plant Physiol. Bioch. 46(5–6):569–579.
- Godin, C., and Y. Caraglio. 1998. A multiscale model of plant topological structures. J. Theor. Biol. 191(1):1–46.
- Griffon, S., and F. de Coligny. 2014. AMAPstudio: an editing and simulation software suite for plants architecture modeling. Ecol. Model 290(1):3–10.
- Hallé, F., R. Oldeman, and P. Tomlinson. 1978. Tropical trees and forests: an architectural analysis. Springer-Verlag, Berlin.
- Ito, D.S., T. Sera, G.H. Sera, L. Grossi, and F.S. Kanayama. 2008. Resistance to bacterial blight in arabica coffee cultivars. Crop Breed. Appl. Biotechnol. 8:99–103.
- Jaramillo-Botero, C., R.H.S. Santos, H.E.P. Martinez, P.R. Cecon, and M.P. Fardin. 2010. Production and vegetative growth of coffee trees under fertilization and shade levels. Sci. Agric. 67(6):639–645.
- Joët, T., A. Laffarge, F. Descroix, S. Doulbeau, B. Bertrand, A. De Kochko, and S. Dussert. 2010a. Influence of environmental factors, wet processing and their interactions on the biochemical composition of green coffee beans. Food Chem. 118:693–701.
- Joët, T., A. Laffargue, J. Salmona, S. Doulbeau, F. Descroix, B. Bertrand, A. De Kochko, and S. Dussert. 2009. Metabolic pathways in tropical dicotyledonous albuminous seeds: coffea arabica as a case study. New Phytol. 182:146–162.
- Joët, T., J. Salmona, A. Laffargue, F. Descroix, and S. Dussert. 2010b. Use of the growing environment as a source of variation to identify the quantitative trait transcripts and modules of co-expressed genes that determine chlorogenic acid accumulation. Plant Cell Environ. 33:1220–1233.
- Kitzberger, C.S.G., M.B.S. Scholz, L.F.P. Pereira, J.B.G.D. Silva, and M.T. Benassi. 2016. Profile of the diterpenes, lipid and protein content of different coffee cultivars of three consecutive harvests. AIMS Agric. Food 1(3):254–264.
- Kliewer, W.M., and N.K. Dokoozlian. 2005. Leaf area/crop weight ratios of grapevines: influence on fruit composition and wine quality. Am. J. Enol. Vitic. 56:170–181.
- Koshiro, Y., M.C. Jackson, R. Katahira, M.L. Wang, C. Nagai, and H. Ashihara. 2007. Biosynthesis of chlorogenic acids in growing and ripening fruits of Coffea arabica and Coffea canephora plants. J. Biosci. 62(9–10):731–742.
- Laviola, B.G., MartinezI, H.E.P., Salomão, L.C.C., Cruz, C.D., Mendonça, S.M., and L.D.S. Rosado. 2007. Nutrient accumulation in coffee fruits at two at two plantation altitudes: micronutrients. Rev. Bras. Ciênc. Solo 31(6):1439–1449.
- Leroy, T., F. Ribeyre, B. Bertrand, P. Charmetant, M. Dufour, C. Montagnon, P. Marraccini, and D. Pot. 2006. Genetics of coffee quality. Braz. J. Plant Physiol. 18(1):229–242.
- Martinez, H.E.P., H.S. Augusto, C.D. Cruz, A.W. Pedrosa, and N.F. Sampaio. 2007. Crescimento vegetativo de cultivares de café (Coffea arabica L.) e sua correlação com a produção em espaçamentos adensados. Acta Sci. Agron. 29:481–489.
- Matsunaga, F.T., J.B. Tosti, A. Androcioli-Filho, J.D. Brancher, E. Costes, and M. Rakocevic. 2016. Strategies to reconstruct 3D Coffea arabica L. plant structure. SpringerPlus 5(1):2075.
- Monselise, S., and E. Goldschmidt 1982. Alternate bearing in fruit trees. Hortic. Rev. 4:128–173.
- Morais, L.E., P.C. Cavatte, E.F. Medina, P.E.M. Silva, S.C.V. Martins, P.S. Volpi, S. Andrade Júnior, J.A. Machado Filho, C.P. Ronchi, and F.M. DaMatta. 2012. The effects of pruning at different times on the growth, photosynthesis and yield of conilon coffee (Coffea canephora) clones with varying patterns of fruit maturation in southeastern Brazil. Expl. Agric. 48(2):210–221.
- Mullineaux, C.W., and H. Kirchhoff. 2009. Role of lipids in the dynamics of thylakoid membranes, p. 283–294. In: Wada H. and Murata N. (Eds.). Lipids in photosynthesis: essential and regulatory functions. Springer Science, Dordrecht.
- Murata, N. 1989. Low-temperature effects on cyanobacterial membranes. J. Bioenerg. Biomemb. 21:61–75.
- Oestreich-Janzen, S. 2010. Chemistry of coffee, p. 1081–1113. In: Mander L. (Ed.). Comprehensive natural products II. Chemistry and biology. Elsevier Ltd, Oxford, UK.
- Paulo, E.M., E. Furlani Júnior, and L.C. Fazuoli. 2005. Comportamento de cultivares de cafeeiro em diferentes densidades de plantio. Bragantia 64:397–409.
- Perfecto, I., R.A. Rice, R. Greenberg, and M.E. Van der Voort. 1996. Shade coffee: a disappearing refuge for biodiversity. BioSci 46:598–608.
- Pezzopane, J.R.M., M.J. Pedro Júnior, R.A. Thomaziello, and M.B.P. Camargo. 2003. Escala para avaliação de estádios fenológicos do cafeeiro arábica. Bragantia 62(3):499–505.
- Pezzopane, J.R.M., T.J.G. Salva, V.B. Lima, and L.C. Fazuoli. 2012. Agrometeorological parameters for prediction of the maturation period of Arabica coffee cultivars. Int. J. Biometeorol. 56(5):843–851.
- Pradal, C., F. Boudon, C. Nouguier, J. Chopard, and C. Godin. 2008. PlantGL: A Python-based geometric library for 3D plant modelling at different scales. Graph. Models 71:1–21.
- R Development Core Team. 2017. R: a language and environment for statistical computing. 7 Jan. 2017. <http://www.rproject.org>.
- Rakocevic, M., and A. Androcioli-Filho. 2010. Morphophysiological characteristics of Coffea arabica L. in different arrangements: lessons from a 3D virtual plant approach. Coffee Sci. 5(2):54–166.
- Rakocevic, M., F.P. Lucambio, A. Androcioli-Filho, and F.T. Matsunaga. 2011. Leaf position and light interception affect the berry number in virtual coffee arabica trees. Anais de VII Simpósio de Pesquisa dos Cafés do Brasil, Curitiba-PR, Brazil. http://www.sapc.embrapa.br/arquivos/consorcio/spcb_anais/simposio7/206.pdf>.
- Correia, L.E., Matsunaga, F.T., Alvim, C.A., and M. Rakocevic. 2017. Phyllochron, leaf expansion and life span in adult Coffea arabica L. plants: Impact of axis order, growth intensity period and emitted leaf position. In: IEEE Functional-Structural Plant Growth Modeling, Simulation, Visualization and Applications, 38–43.
- Rakocevic, M., F.T. Matsunaga, M.P. Novaes, R.S. Oyamada, M.B.S. Scholz, S. Griffon, J. Dauzat, and E. Costes. 2014. How density and planting pattern affect coffee plant structure and berry distribution in first production year? Proceedings of the 25th International Conference on Coffee Science. ASIC, Armenia, Colombia. <http://www.asic-cafe.org/fr/proceedings/6266/toc/7/conf>.
- Rakocevic, M., M.B.S. Scholz, and P. Charmetant. 2015. Leaf photosynthesis in four coffee genotypes as response to the irrigation during the biennial period. Anais de IX Simpósio de Pesquisa dos Cafés do Brasil, Curitiba-PR, Brazil. <http://www.sbicafe.ufv.br/handle/123456789/3632>.
- Routaboul, J.M., S.F. Fischer, and J. Browse. 2000. Trienoic fatty acids are required to maintain chloroplast function at low temperatures. Plant Physiol. 124:1697–1705.
- Sakai, E., E.A.A. Barbosa, J.M.C. Silveira, and R.C.M. Pires. 2015. Coffee productivity and root systems in cultivation schemes with different population arrangements and with and without drip irrigation. Agri. Water Mgmt. 148:16–23.
- Scheel, G.L., E.D. Pauli, M. Rakocevic, R.E. Bruns, and I.S. Scarminio. 2016. Environmental stress evaluation of Coffea arabica L. leaves from spectrophotometric fingerprints by PCA and OSC–PLS–DA. Arab. J. Chem. doi: 10.1016/j.arabjc.2016.05.014.
- Scheel, G.L., I.S. Scarminio, and M. Rakocevic. 2015. Study of water regime, light interception and their metabolic compounds in leaves of cv. ‘Catuaí’. Anais de IX Simpósio de Pesquisa dos Cafés do Brasil, Curitiba-PR, Brazil. <http://www.sbicafe.ufv.br/handle/123456789/3618>.
- Scholz, M.B.S., C.S.G. Kitzberger, N.F. Pagiatto, L.F.P. Pereira, F. Davrieux, D. Pot, P. Charmetant, and T. Leroy. 2016. Chemical composition in wild Ethiopian Arabica coffee accessions. Euphytica 209:429–438.
- Scholz, M.B.S., C.S.G. Kitzberger, L.F.P. Pereira, F. Davrieux, D. Pot, P. Charmetant, and T. Leroy. 2014. Application of near infrared spectroscopy for green coffee biochemical phenotyping. Jnirs 22:411–421.
- Silva, E.A., F.M. DaMatta, C. Ducatti, A.J. Regazzi, and R.S. Barros. 2004. Seasonal changes in vegetative growth and photosynthesis of Arabica coffee trees. Field Crops Res. 89:349–357.
- Silva, E.B., F.D. Nogueira, P.T.G. Guimarães, S.J.R. Chagas, and L. Costa. 1999. Sources and doses of potassium on the yield and quality of green coffee. Pesq. Agropec. Bras. 34(3):335–345.
- Singer, D.S., J. Zou, and R.J. Weselake. 2016. Abiotic factors influence plant storage lipid accumulation and composition. Plant Sci. 243(1):1–9.
- Soares, A.R. 2001. Irrigação fertirrigação fisiologia e produção do cafeeiro adulto na região da Zona da Mata de Minas Gerais. MSci -Universidade Federal de Viçosa, Brazil. p. 84.
- Terrile, A.E., G.G. Marcheafave, G.S. Oliveira, M. Rakocevic, R.E. Bruns, and I.S. Scarminio. 2016. Chemometric analysis of UV characteristic profile and infrared fingerprint variations of Coffea arabica green beans under different space management treatments. J. Braz. Chem. Soc. 27(7):1254–1263.
- Vaast, P., B. Bertrand, J.J. Perriot, B. Guyot, and M. Genard. 2006. Fruit thinning and shade improve bean characteristics and beverage quality of coffee (Coffea arabica L.) under optimal conditions. J. Sci. Food Agric. 86:97–204.
- Villarreal, N.M., C.A. Bustamante, P.M. Civello, and G.A. Martínez. 2010. Effect of ethylene and 1-MCP treatments on strawberry fruit ripening. J. Sci. Food Agric. 90:683–689.
- Welti, R., J. Shah, W. Li, M. Li, J. Chen, J.J. Burke, M.-L. Fauconnier, K. Chapman, M.-L. Chye, and X. Wang. 2007. Plant lipidomics: discerning biological function by profiling plant complex lipids using mass spectrometry. Front. Biosci. 12:2494–2506.