
 ?Mathematical formulae have been encoded as MathML and are displayed in this HTML version using MathJax in order to improve their display. Uncheck the box to turn MathJax off. This feature requires Javascript. Click on a formula to zoom.
ABSTRACT
Jamun (Syzygium cumini) is a tropical, underutilized fruit which is highly perishable in nature. It is a good source of vitamin C, tannins, gallic acid and anthocyanins and its beneficial effects are mostly due to the presence of bioactive compounds (pigments and phenolic compounds) in it. Due to astringent and fibrous nature, preparation of jam from jamun pulp is quite difficult, but other fruits (apple and kiwifruit) can be incorporated in it to improve its quality. This study aims to develop jam from blends of jamun with other fruits and analyse various physico-chemical, nutritional, textural and sensory properties. It was found that physico-chemical properties of jams were not found to vary greatly, but the jamun–kiwifruit jam was found to have fairly high amount of antioxidants(46.75 ± 0.67%), tartaric acid (26.24 ± 0.02 mg/100g sample), ascorbic acid (0.08 ± 0.01 mg/100 g sample) and lactic acid (23.95 ± 0.01 mg/100g sample) and lowest amount of 5-hydroxymethyl-2-furaldehyde (0.38 ± 0.04 mg/100 g sample). Jamun jam and jamun–kiwifruit jam possessed the texture required for jam while jamun–apple jam was found to be a relatively harder gel. Jam made with jamun and kiwifruit pulp was found to have highest acceptability on the basis of sensory evaluation.
Introduction
Fruits are of great importance in human nutrition. However, due to their perishable nature and seasonal availability, they are generally processed into more stable forms such as jams, jellies, juices, pickles and many more products. Jam is a processed fruit product having an intermediate moisture content which is prepared by boiling homogenised fruit pulp with sugar, acid, and pectin. It may have some other ingredients like preservatives, flavouring or colouring compounds. It should have a proper consistency so that it could easily spread and should be firm enough so that it does not flow like a fluid. Jam should contain at least 68.5% total soluble solids (TSS), and the fruit should contribute at least 45% of the total weight of jam (PFA, Citation2004). Sugar present in jam reduces its water activity resulting in longer shelf life. Worldwide, several types of fruits have been used for making jams. Since the food products are governed by consumer choices, the development of new products is quite important for the fruit industries.
Jamun (Syzygium cumini) generally called Indian blackberry (or Java Plum) is a relatively underutilized tropical fruit that belongs to the Myrtaceae family. It is native to the Indian subcontinent and the adjoining regions of Southeast Asia. The jamun fruits are abundantly available during the monsoon season but only for a short span of time (nearly 30–45 days). These contain vitamin C, tannins, gallic acid and anthocyanins which are responsible for the deep purple colour (Banerjee et al., Citation2005). The beneficial effects of jamun are mostly due to the presence of bioactive compounds (pigments and phenolic compounds) in it. Due to astringent and fibrous nature, preparation of jam from jamun pulp is quite difficult, whereas apples are widely used for making jams, jellies, juice, candies, pies, etc. Apple (Malus pumila) is one of the most common and readily available fruit in the world. They are low in calories, rich in antioxidants, a good source of vitamin-C, β-carotene, B-complex vitamins and have a small amount of minerals like iron, potassium, magnesium, sodium, zinc, phosphorus, copper, manganese, calcium and fluoride (US Food and Drug Administration, Citation2012). Kiwifruit (Actinidia deliciosa) or Chinese gooseberry is a highly nutritional edible berry that belongs to the Actinidia family. It has a sweet but unique flavor. It is considered as it is a good source of vitamin C, vitamin K, antioxidants, phytonutrients and chlorophyll (Cassano et al., Citation2006). Due to its highly perishable nature, it has a very short shelf life and is often used for making purees, juice and jams.
Several types of fruits have been reutilized in the production of value-added products such as jams. For a long time, jams made by mixing of fruits with each other and fortified with other ingredients are highly accepted by consumers due to their better taste and high nutritive values. Mohamad et al. (Citation2012) prepared jam from watermelon waste with different combinations of rind, sugar and different flavours. The combination of rind and sugar in 1:1 ratio and strawberry flavour resulted in the jam with acceptability on the basis of sensory and physicochemical analysis. Ajenifujah & Aina (Citation2011) produced jam from black plum and determined its physico-chemical and nutritional properties and consumer acceptability. It was found to be acceptable with high flavour and good spreadability. Shah et al. (Citation2015) studied the overall quality of jam made with a blend of apple and olive and the effect of storage and treatment on it at 15 days intervals for 3 months. It concluded that titratable acidity, reducing sugars content and TSS increased, while pH and non-reducing sugars content decreased during storage. Jayabalan and Karthikeyan (Citation2013) worked on the sensory quality of aloevera jam and optimized the ingredients (aloevera juice sugar pectin and citric acid) by response surface methodology. They found a satisfactory correlation between actual and model fitted values. Jaiswal et al. (Citation2015) studied the physical properties of jamun fruit (Syzygium cumini) to facilitate its handling and processing operations. They prepared jam from jamun fruit and compared it with other commercial fruit jams in terms of proximate analysis, total phenols, viscosity and antioxidant activity. The results showed that proximate composition and viscosity of jamun jam were close to the commercial jams and had more phenolic compounds and antioxidants. Shahnawaz and Shiekh (Citation2011) studied the rheological behaviour of jamun juice, squash and jam at different compositions and found the rheological behaviour of squash and ready-to-drink jamun juice to be significant while quality attributes of jam to be poor.
Incorporation of other fruits in jamun jam can result in better quality. However, these fruits may change the flavour of the jam drastically. High amount of pectin in apple can account for better gel formation in jam, while nutrients in kiwifruit can improve the nutritional quality of the jam. The objective of this study is to develop jam from jamun blended with other fruits (apple and kiwifruit) and analyse various physico-chemical (pH, TSS, colour, titratable acidity, antioxidants, moisture content, 5-hydroxymethyl-2-furaldehyde (HMF), tartaric acid, ascorbic acid, lactic acid and citric acid), nutritional (ash, protein, fat, crude fibre, carbohydrate, energy and minerals content), textural and sensory properties of obtained jams.
Material and methods
Sampling
Fresh and properly ripe jamun fruits (Ram Jamun variety), apples (red delicious variety) and kiwifruits (Hayward variety) were purchased from a local supermarket in Rourkela, Odisha, India. The fruits were washed manually to remove any dust or foreign particles on their surface. High-methoxyl (HM) pectin (HM with degree of esterification of 65–70%), petroleum ether, hydrochloric acid, sodium hydroxide pellets and phenolphthalein were procured from HiMedia Laboratories Pvt. Ltd., Mumbai, India. Standard solutions for mineral analysis (Ca, Fe, Na, Mg, K and Zn), DPPH (2,2-diphenyl-1-picrylhydrazyl), Folin & Ciocalteu’s phenol reagent, HMF, l-ascorbic acid (99%), citric acid (99%), l-(+)-lactic acid (98%) and l-(+)-tartaric acid (≥99.5%) were obtained from Sigma-Aldrich Co., Bangalore, India. Sulphuric acid and methanol were purchased from Nice Chemicals Pvt. Ltd., Kochi, India, and Sisco Research Laboratories Pvt. Ltd., New Mumbai, India, respectively. Nitric acid was procured from Thermo Fischer Scientific India Pvt. Ltd., Mumbai, India. The glassware were purchased from Borosil Glass Works Ltd., Mumbai, India.
Pulp extraction
Jamun fruits were deseeded manually, while apple and kiwifruit were peeled, deseeded and chopped manually into small pieces. The fruits were then ground individually using a mixer grinder (GX6 Mixer Grinder, Bajaj Electricals Limited, Mumbai, India) till the pulp became uniform and homogeneous (Shah et al., Citation2015). The ground pulps were then strained through a 100 mesh strainer.
Product formulation
Three different jams were made which were named as control, sample 1 (S1) and sample 2 (S2). The quantity of jamun pulp in each variant was 500 g. The control jam was prepared with jamun pulp only. Preliminary studies (textural and sensory) were done to optimize the proportion of apple (or kiwifruit) with jamun pulp (results not given), and it was found that the ratio of 1:4 was of highest acceptability. So sample 1 and sample 2 were made by blending apple pulp and kiwifruit with the jamun pulp in 1:4 ratio (by weight) respectively. The quantity of sugar in all the three variants was half of the weight of jamun pulp, i.e., 250 g. Quantity of pectin was constant in all the jams, i.e., 0.2% of the weight of jamun pulp (Shahnawaz and Shiekh, Citation2011).
Preparation of jam
For the preparation of jam, the fruit pulp and sugar were taken in a heavy bottom stainless steel pan and was put on an induction cooktop (Bajaj Electricals Limited, Mumbai, India) at 100°C. The mixture was allowed to boil and then pectin powder (0.1 g) was added to it while stirring it continuously so as to prevent pectin from clotting. The temperature was increased to 130°C, and the mixture was allowed to cook for several minutes while stirring it occasionally. This 130°C was the set temperature of the induction cooktop; however, the actual temperature of jam while cooking was 105°C. The temperature (105°C) was applied for several minutes for quick cooking of the jam. The endpoint of jam preparation was determined by cooling a small amount of sample and testing its TSS using a refractometer (Erma hand refractometer, Erma Inc, Tokyo, Japan). Upon reaching the consistency of 65º Brix TSS, the heat was turned off. The jam samples were immediately filled into clean and pre-sterilized glass jars and were allowed to cool at ambient temperature. Upon cooling, the jars were closed with their lids and were stored in the refrigerator. The prepared jams were filled into pre-sterilized glass bottles and were allowed to equilibrate with ambient temperature. Then, they were stored in the refrigerator (Shahnawaz and Shiekh, Citation2011).
Determination of physico-chemical properties
TSS of the jams were determined by keeping the sample on the prism of the calibrated refractometer (Erma hand refractometer, Erma Inc, Tokyo, Japan), and the result was expressed in ºBrix. The pH of the jam was measured by placing probe of calibrated digital pH meter (Eutech Instruments, Singapore) in the beaker containing jam sample. Colour of the jams were measured by HunterLab ColorFlex EZ Bench Top Spectrophotometer (Hunter Associates Laboratory, Reston, Virginia, USA), and the result was recorded in CIE (L*, a*, b*) system. Estimation of titratable acidity of the jam was done by the method as described by Touati et al. (Citation2014). All the tests were performed on samples at room temperature and were done in triplicates. Generally, commercially available jams are vacuum packed to ensure sterility of the jam. However, once the pack is opened, jam has to be kept in the refrigerated condition. This is due the fact that the jam will be infected by airborne microbes, which can grow rapidly under room temperature. Hence, in the experimentation, jams were stored in the refrigerated condition to increase its shelf life. All the analyses were done at room temperature.
Antioxidant activity of the jam was determined as free radical scavenging activity against DPPH (2,2-diphenyl-1-picrylhydrazyl) by the method described by Bermúdez-Soto and Tomás-Barberán (Citation2004) and Surveswaran et al. (Citation2007). Jam extract was mixed with DPPH solution (0.002% w/v in ethanol) and the mixture was kept in dark for 30 min. Its absorbance was measured against the blank sample at 516 nm using UV-VIS Double Beam Spectrophotometer (Systronics India Limited, Ahmedabad, India). The antioxidant activity was expressed as the percentage reduction in the DPPH˙ radicals.
DPPH free radical scavenging activity (%) = where X is the absorbance of sample and Y is the absorbance of the blank sample.
Moisture content of the jam was determined by the hot air oven method (AOAC, Citation2006). An equivalent of 5 g sample was kept inside the hot air oven at 100ºC for 24 h, and final weight of the sample was obtained to calculate the moisture content.
A modified procedure of the Kukurova et al. (Citation2006) was used to measure the content of HMF in jams using high-performance liquid chromatography analysis method (Korus et al., Citation2015). Detection was done using Waters HPLC system with binary pumps (Model 515) apparatus equipped with a UV-VIS detector. The analysis was done using column SunFire C-18 (5 µm, 4.6 × 250 mm) and light of wavelength 283 nm was used for measurements. Methanolic water (methanol:water = 60:40) was used as mobile phase and the flow rate was maintained at 1.0 ml/min. HMF solution was used as standard to identity HMF. The quantity of HMF in jam was then calculated from the standard curve plotted for the HMF standard.
Organic acids (tartaric, ascorbic, lactic and citric acids) were quantified using HPLC (Rheodyne injector PDA, Model 2998) apparatus equipped with UV-VIS detector at 210 nm. A separation column SunFire C-18 (5 µm, 4.6 × 250 mm) was used for analysis with 20 mM H2PO4 as the mobile phase. The flow rate was maintained at 0.2 ml/min, and the operation was done at room temperature. Organic acids content was determined using external standards.
Nutritional and mineral analysis of jam
Ash content was analysed by dry ashing method (AOAC, Citation2006). Moisture free jam was churned and was kept in a muffle furnace at 550°C for 4 h or until it was properly ashed. The final weight of the ash was taken and ash content was calculated.
Protein content was estimated (with bovine serum albumin (BSA) as standard) by the dye-binding method (Ghosh et al., Citation2017). The absorbance of the sample was measured at 660 nm using UV-VIS Double Beam Spectrophotometer. From the standard graph of BSA, the amount of protein present in each jam sample was determined.
Fat content was determined by semi-continuous solvent extraction method (AOAC, Citation2006) using petroleum ether as solvent (between 40°C and 60°C). Fat was extracted from moisture free jam using automated fat extraction system (SOCS PLUS Six Place Automatic Solvent Extraction System, Pelican Equipment, Chennai, India).
The crude fibre content of jam was estimated by the method described by AOAC (Citation2006). The fibre was extracted from fat-free jam using automatic fibre extraction system (FIBRA PLUS Automatic Fibre Estimation System, Pelican Equipment).
The amount of carbohydrates present in jam was calculated by subtracting the sum of moisture, protein, fat, ash and crude fibre from 100% (Menezes et al., Citation2004).
The total energy content of each jam was calculated by multiplying its carbohydrate content, protein content, fat content and fibre content by factors of 4, 4, 9 and 2, respectively and adding these values. The value was expressed in kilocalories per 100 g of the jam.
The total phenolic content of the jam was estimated by Folin–Ciocalteu method as described by Singleton et al. (Citation1999). The jam extract was dissolved in distilled water and Folin–Ciocalteu reagent was added to it. After 3 min, Na2CO3 solution (7.5% w/v) was added to it and was mixed well. The solutions were kept at room temperature for 1 h and then analysed by UV-VIS Double Beam Spectrophotometer at 650 nm. The results were expressed in gallic acid equivalent per gram of sample.
Mineral content of jams was measured using Atomic Absorption Spectroscopy method. Two grams of the jam was ashed in the muffle furnace and then 5 ml of HCl (6 M) and some glass beads were added to it. It was kept on a hot plate at 100ºC for complete digestion till all the HCl got vaporized. Fifty milliliters of HNO3 (0.1 M) was added to the digested sample and was mixed well. The mixture was then filtered using a filter paper. The filtrate was used as sample for mineral analysis. The absorption of each sample was measured using the Atomic Absorption Spectrometer (PerkinElmer Inc, USA) for different minerals: calcium, iron, potassium, sodium, magnesium and zinc at the wavelengths of 422.67, 248.33, 766.49, 589.61, 285.24 and 213.89 nm, respectively.
Texture analysis of jam
The texture of jam was analysed by the method described by Korus et al. (Citation2015) using texture analyzer (Brookfield Engineering Laboratories, USA), which was coupled with a computer equipped with the TexturePro CT V1.7 Build 28 software. The compression test was performed using the probe TA4/1000 (with 46.8 mm diameter). The test speed was 1.00 mm/s and the hold time was 3 s. The deformation target was set at 60% of the height of sample and the trigger load was 0.50 N. The following texture parameters were analyzed from the data and graph (load vs. distance) obtained:
Gel strength (N) – a point where little deformation had occurred in the jam at initial stage of penetration
Rupture force (N) – the point where jam gets ruptured
Gel brittleness (mm) – the distance that the probe penetrates before breaking occurs
Target load (N) – the force required for targeted deformation (60% deformation)
Energy of penetration (J) – work done for target deformation
Sensory evaluation of jam
Among a group of 50 people, 30 were selected for evaluation of sensory attributes of the jam. Sensory evaluation was done by a panel of 30 people consisting of 18 female and 12 male candidates (within the age group of 22–35 years). Since the panellists had to rate the samples on hedonic scale, they were recruited on the basis of a screening test. The screening test involved discrimination between similar products and quantification of key flavouring ingredients in the samples. The panellists were trained with descriptive analysis. The sensory attributes namely appearance, consistency, taste, flavour, aroma, spreadability, mouthfeel and overall acceptance were scored on a nine-point Hedonic scale (Touati et al., Citation2014). The jam samples were served in 50-ml cups along with bread slices, and the room was equipped with a proper light. The panellists were provided salt solution (2% w/v) for gargling after evaluation of each sample.
Statistical analysis of jam
All the experimental data were subjected to statistical analysis using SPSS (Statistical Package for the Social Sciences, IBM Corporation, Armonk, NY, USA) version 22 for windows. The results were expressed as mean ± standard deviation. One-way ANOVA and Duncan’s homogeneity of variance test were performed to detect any statistically significant difference (p < 0.05).
Results and discussion
Physico-chemical analysis
Various physico-chemical properties of the jams are listed in . The TSS content of the jams was found to be in the range of 64.33–66.67º Brix. The values are significant (p < 0.0001). Control is having significant value with S1 and S2, whereas there is no significant difference between S1and S2. However, Jaiswal et al. (Citation2015) found TSS of jamun jam to be 68.3º Brix. The differences are due to the different variety and varying degree of ripeness of the fruit or it can be due to different cooking time.
Table 1. Physico-chemical properties of jam.
pH is an important factor in formation and stabilization of jam. pH of the jams varied between 2.92 and 3.01 with a significant difference (p < 0.05). S1 is having significantly different value with control and S2. pH of control was found to be lowest on account of highest acidity of jamun while S1 has highest pH as the acidity of apple is least among these fruits. Similar results have been found for pH of jamun jam by Shahnawaz and Shiekh (Citation2011).
The colour attributes of jams were represented in L*, a*, b* scale. Jam with kiwifruit was found to be of lightest colour followed by control while jam with apple was found to be of darkest colour due to browning of apple upon cooking. Due to the presence of jamun only, control had maximum red colour component. All the samples showed negative b* values indicating the absence of a yellow colour component in them. Control was found to be maximum bluish due to the presence of purple coloured jamun in it while S1 was found to have the least value because incorporation of apple reduced its blue colour component. Chroma (c*) and hue angle (h°) were also calculated for the jams as per the formula given by Maskan (Citation2001).
Chroma indicates saturation of colours in the sample (Korus et al., Citation2015). Sample 1 and Sample 2 were found to have 10% and 7.5% less colour saturation than control jam. Hue angle represents the overall colour of the sample. All the jam samples were found to have negative and small values of hue angle representing more of red–purple colour component in them. All the values were found to be significant (p < 0.0001).
Titratable acidity is a measure of the total concentration of free protons present in a solution. Titratable acidity of jams was expressed as percentage malic acid. All the samples were found to possess similar level of titratable acidity (1.00–1.64). Control was found to have lowest while S1 was found to have the highest amount of titratable acidity although the differences were not found to be significant statistically (p > 0.05). High amount of malic acid in apple accounted for the highest value in S1. Titratable acidity of control was found to be in accordance with the results for jamun jam, whereas S1 was found to have higher titratable acidity than apple jam as found by Jaiswal et al. (Citation2015) which is due to the addition of jamun in the former.
Antioxidant activity of jam was determined by DPPH free radical scavenging activity and it was found to be highest in S2 (46.75 ± 0.67%) due to the presence of antioxidants-rich kiwifruit that is present in S2. S1 and S2 were found to have significantly similar values, whereas control was found to have a significantly different value from other jams (p < 0.0005). The antioxidant property of control was similar to that of jam prepared from jamun (47.97 ± 0.01%) by Jaiswal et al. (Citation2015). S1 was found to have fairly higher antioxidant property as compared to that of apple jam (22.05 ± 0.02%) (Jaiswal et al., Citation2015) and this difference is due to the presence of antioxidant-rich jamun in S1. This is due to the fact that the total antioxidant value is a sum of various classes of compounds such as phenolic compounds; anthocyanins; vitamins A, C, E; lutein; β-carotene; flavonoids. So it is quite possible that S1 (having apple and jamun pulp) and S2 (having kiwifruit and jamun pulp) have nearly equal amount of antioxidants, but their phenolic content may have a high variation. Although S1 has a lower total phenolic content, but it may have antioxidant constituents other than phenolic compounds more than S2, it might be the reason for nearly equal overall antioxidant activity of S1 and S2 (Haytowitz and Bhagwat, Citation2010).
The moisture content of jams varied from 28.79% to 35.89%. Control was found to have the least value on account of least amount of moisture in jamun as compared to other fruits used here (USFDA, Citation2012). Ashaye and Adeleke (Citation2009) found similar results for moisture content of different variants of roselle jam at the initial stage (28.74–36.13%). The variation in moisture content of jam could be due to a varying moisture content of fruit or difference in the cooking period. However, Ashaye and Adeleke (Citation2009) found that moisture content could also vary with storage period and storage conditions, but the variation of the moisture content of jam with different storage conditions is not studied here.
The amount of HMF was found to be very less in all jams. Control was found to have the highest value followed by S1 and S2. The values are in accordance with the amount of carbohydrates in the respective jams which undergoes Maillard reaction to form HMF (Basumallick and Rohrer, Citation2011). The values were found to be significant (p > 0.05). Since HMF is a heat-induced contaminant and is considered potentially carcinogenic to humans, it is desired to be present in lowest amount (Capuano and Fogliano, Citation2011).
Jam incorporated with kiwifruit was found to have the highest amount of tartaric acid, ascorbic acid and lactic acid, while jam incorporated with apple possessed the lowest amount of tartaric acid and ascorbic acid. A higher amount of tartaric acid is desirable as it can help in better functioning of the colon and better digestion (Spiller et al., Citation2003). Ascorbic acid helps in maintenance of skin health, teeth, bones, cartilages and blood vessels (Kyrtopoulos, Citation1987; Telang, Citation2013). The presence of lactic acid is considered beneficial as it can control intestinal infections (Gilliland, Citation1990). However, all the jams were found to have a negligible amount of citric acid.
Nutritional and mineral analysis
Various nutritional properties and mineral content of jams are listed in . Ash content of jams ranged from 0.26% to 0.37% with maximum value for S2 and least value for S1. This result is justified by the mineral content of the individual fruits used for making them (US Food and Drug Administration, Citation2012). The value for all the samples was found to be significant (p > 0.05). Ash content of control and S2 were found to be less than that of jamun fruit and kiwifruit, respectively (Sehwag and Das, Citation2015; US Food and Drug Administration, Citation2012). However, ash content of S1 was found to be much higher than that of apple fruit which is accounted due to the presence of jamun in this jam (US Food and Drug Administration, Citation2012).
Table 2. Nutritional and mineral analysis of jam.
The protein content of jams was found to be similar and ranged from 1.55% to 2.84%. The mean differences between the values were found to be significant (p < 0.0005). Jam containing kiwifruit possessed the highest amount of protein due to high protein in kiwifruit (US Food and Drug Administration, Citation2012). The value for control and S1 were found to be very high as compared to that of jamun jam (0.72 ± 0.05) and apple jam (0.18 ± 0.07) respectively as found by Jaiswal et al. (Citation2015). Protein content of control and S2 was found to be higher than that of jamun fruit and kiwifruit, respectively (Sehwag and Das, Citation2015; US Food and Drug Administration, Citation2012).
All the jams were found to possess very low and similar fat content (1.28–1.45%). The low fat is due to the absence of higher amount of fat in the fruits. Control was found to have the least fat (1.28 ± 0.00) followed by S2 (1.35 ± 0.01) and S1 (1.45 ± 0.01). The values were found to be significant (p < 0.0001). Fat content of control and S1 were found to be higher than that of jamun jam and apple jam, respectively Jaiswal et al. (Citation2015). Fat content of S2 was found to be slightly higher than that of control because kiwifruit contains more fat than jamun (US Food and Drug Administration, Citation2012).
The crude fibre content of the jams was found to be in the range of 0.44–1.61% with the least value for the control. The values are significant (p < 0.0001). S2 was found to have maximum fibre content and this can be attributed to higher amount fibre in kiwifruit. It was also found to have significantly higher fibre content than grape jam, apricot jam, blueberry jam and strawberry jam (Naeem et al., Citation2015). Thus, S2 can be considered healthier as dietary fibre plays an important role in reducing cholesterol and blood glucose level.
All the jams were found to be rich in carbohydrates due to the presence of fruits and sugar in them. The value for control was found to be highest followed by S1 and S2. The values were found to be statistically significant (p < 0.0001). Jamun has more carbohydrates as compared to apple and kiwifruit and justifies the higher value for the control. Carbohydrate content of S2 was found to be least and even less as compared to jams prepared from grape, apricot, blueberry and strawberry (Naeem et al., Citation2015). Thus, S2 can be used in low carbohydrate diet which could be very helpful in losing weight (Foster et al., Citation2003).
All the jams were found to possess high amounts of energy. Control was found to have maximum calories due to the presence of jamun only as it contains more calories. The mean values were found to be significant at p < 0.0001. The jams were found to have very high energy value as compared to the fruits used for their manufacture and this is due to the presence of high amounts of sugar in them. The jams were found to have energy value similar to other fruit jams as found by Naeem et al. (Citation2015). Since consumption of a high amount of calories is not preferred nowadays, sample 2 (with lower calorie content) can be considered healthier than other jams.
Since the fruits used in jam preparation are rich in phenolic compounds so all the jams were also found to be rich in it. However, the value was found to be highest for S2 (5.48 ± 0.01) and least in sample 1 (3.28 ± 0.01). The results for control jam and sample 1 were in accordance with the results obtained for jamun jam and apple jam by Jaiswal et al. (Citation2015).
Jams were analysed for the presence of certain minerals (calcium, iron, potassium, sodium, magnesium and zinc) and were found to be rich in most of them. S2 was found to have highest amounts of calcium, iron, potassium, magnesium and zinc, whereas control has sodium in highest amount. S1 was found to have the lowest amount of all the minerals except potassium. The results are in accordance with the mineral composition of jamun, apple and kiwifruit, respectively (US Food and Drug Administration, Citation2012). All the values were found to be significant (p < 0.0001).
Texture analysis
Texture analysis was done to evaluate various parameters: gel strength, rupture force, gel brittleness, the force required for targeted deformation (60%) and the energy of penetration of probe into the jams, and the results are shown in . S1 was found to have the highest value of gel strength, rupture (or breaking) force and F60 value. Gel brittleness value was found to be highest in case of S2 followed by S1 and control. This implies that S2 is more stable than other jams and it does not break easily. The energy required for penetrating into the jam was found to be similar for S2 and control, but S1 had quite lower value. S2 and control possessed similar results for all these parameters with bilberry jam cooked in the open pan by Korus et al. (Citation2015). Thus, jam with jamun and apple (S1) was found to be undesirable as it forms hard gel, whereas jams with kiwifruit and jamun (S2) and jamun only (control) were found to possess better textural properties.
Table 3. Texture analysis of jam.
Sensory evaluation
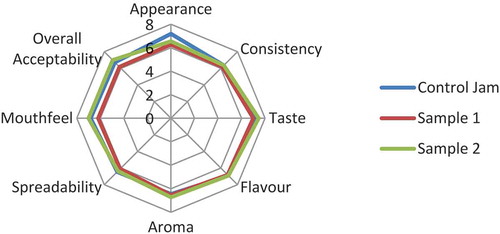
Various sensory attributes measured for jams were appearance, consistency, taste, flavour, aroma, spreadability, mouthfeel and overall acceptability and scores are depicted in . Since the preparation method was same for all jams and the amount of jamun was higher than other fruits, therefore, consistency, taste, flavour and aroma of all the jams were found to be similar. Control was found to be best in appearance due to its rich colour followed by S2 and S1. However, spreadability and mouthfeel of S2 were found to be higher than other jams. Overall acceptability of S2 was found to be highest and that of S1 to be lowest.
Figure 1. Comparative study for sensory evaluation. Control jam: jam made from jamun pulp only; Sample 1: jam made from apple and jamun pulp in the ratio of 1:4; Sample 2: jam made from kiwifruit and jamun pulp in the ratio of 1:4.
Conclusion
This study was aimed at fortification of the jamun jam with other fruits – apple and kiwifruit that could lead to improvement in its physico-chemical, nutritional, textural and sensory properties. Although physico-chemical properties of jams did not differ much, still jam incorporated with kiwifruit was found to have fairly high amount of antioxidants, tartaric acid, ascorbic acid and lactic acid and lowest amount of HMF which are highly beneficial for humans. Its TSS and pH can be made appropriate by a suitable change in the amount of acid added. Jam with jamun and kiwifruit was also found to have highest nutritional values and minerals, so it can be considered healthier than other jams. Textural analysis revealed that jamun jam and the jam incorporated with kiwifruit possessed the texture required for jam while jam having apple was found to be a relatively hard gel. Again, the jam with kiwifruit was found to have the highest acceptability in sensory evaluation with better spreadability and mouthfeel while jam with apple was found to have the least acceptability. Finally, it can be concluded that fortification of the jamun jam with kiwifruit resulted in best jam followed by jam made by jamun only and the jam fortified with apple was found to be least acceptable.
References
- Ajenifujah-Solebo, S.O., and J.O. Aina. 2011. Physico-chemical properties and sensory evaluation of jam made from black-plum fruit (Vitex doniana). Afr. J. Food, Agriculture, Nutr. Dev. 11:3. doi: 10.4314/ajfand.v11i3.66629.
- AOAC, 2006. Association of Official Analytical Chemists, International Official methods of analysis, 18th ed., Current through revision 1. (MD, USA: AOAC)
- Ashaye, O.A., and T.O. Adeleke. 2009. Quality attributes of stored Roselle jam. Int. Food Res. J. 16(3):363–371.
- Banerjee, A., N. Dasgupta, and B. De. 2005. In vitro study of antioxidant activity of Syzygium cumini fruit. Food Chem. 90(4):727–733. doi: 10.1016/j.foodchem.2004.04.033.
- Basumallick, L., and J. Rohrer. 2011. Determination of hydroxymethylfurfural in honey and biomass. Thermo Scientific Dionex Appl. Note Update 270:1–6.
- Bermúdez-Soto, M.J., and F.A. Tomás-Barberán. 2004. Evaluation of commercial red fruit juice concentrates as ingredients for antioxidant functional juices. Eur. Food Res. Technol. 219(2):133–141. doi: 10.1007/s00217-004-0940-3.
- Capuano, E., and V. Fogliano. 2011. Acrylamide and 5-hydroxymethylfurfural (HMF): A review on metabolism, toxicity, occurrence in food and mitigation strategies. LWT-Food Sci. Technol. 44(4):793–810. doi: 10.1016/j.lwt.2010.11.002.
- Cassano, A., A. Figoli, A. Tagarelli, G. Sindona, and E. Drioli. 2006. Integrated membrane process for the production of highly nutritional kiwifruit juice. Desalination 189(1):21–30. doi: 10.1016/j.desal.2005.06.009.
- Foster, G.D., H.R. Wyatt, J.O. Hill, B.G. McGuckin, C. Brill, B.S. Mohammed, S. Szapary, D.J. Rader, J.S. Edman, and S. Klein. 2003. A randomized trial of a low-carbohydrate diet for obesity. New England J. Med. 348(21):2082–2090. doi: 10.1056/NEJMoa022207.
- Ghosh, P., R.C. Pradhan, and S. Mishra. 2017. Low‐temperature extraction of Jamun juice (Indian Black Berry) and optimization of enzymatic clarification using Box‐Behnken design. J. Food Process. Eng.. 40:2. doi: 10.1111/jfpe.2017.40.issue-2.
- Gilliland, S.E. 1990. Health and nutritional benefits from lactic acid bacteria. FEMS Microbiol. Rev. 7(1–2):175–188.
- Haytowitz, D.B., and S. Bhagwat. 2010. USDA database for the oxygen radical absorbance capacity (ORAC) of selected foods, Release 2. US Department of Agriculture, Washington, DC, USA
- Jaiswal, S.G., M. Patel, and S.N. Naik. 2015. Physico-chemical properties of Syzygium cuminii (L.) Skeels jam and comparative antioxidant study with other fruit jams. Indian J. Nat. Prod. Resour. (IJNPR) [Formerly Nat. Prod. Radiance (NPR)] 6(1):9–15.
- Jayabalan, K., and C. Karthikeyan. 2013. Optimization of ingredients for sensory evaluation of Aloe vera jam preparation using response surface methodology (RSM). Int. J. Engg. Res. Applic 3(1):1224–1234.
- Korus, A., G. Jaworska, E. Bernaś, and L. Juszczak. 2015. Characteristics of physico-chemical properties of bilberry (Vaccinium myrtillus L.) jams with added herbs. J. Food Sci. Technol. 52(5):2815–2823. doi: 10.1007/s13197-014-1315-9.
- Kukurova, K., J. Karovičová, G. Greif, Z. Kohajdová, and J. Lehkoživová. 2006. Determination of 5-hydroxymethylfurfural after Winkler and by the HPLC method for authentication of honey. Chem. Pap. 60(3):186–191. doi: 10.2478/s11696-006-0034-8.
- Kyrtopoulos, S.A. 1987. Ascorbic acid and the formation of N-nitroso compounds: Possible role of ascorbic acid in cancer prevention. American J.L Clinical Nutrition (USA). doi:10.1093/ajcn/45.5.1344.
- Maskan, M. 2001. Kinetics of colour change of kiwifruits during hot air and microwave drying. J. Food Eng. 48(2):169–175. doi: 10.1016/S0260-8774(00)00154-0.
- Menezes, E.W., A.T. de Melo, G.H. Lima, and F.M. Lajolo. 2004. Measurement of carbohydrate components and their impact on energy value of foods. J. Food Composition Anal. 17(3):331–338. doi: 10.1016/j.jfca.2004.03.018.
- Mohamad, S.A., O.K. Saheed, and P. Jamal. 2012. Physico-chemical analysis of jam preparation from watermelon waste. Paper presented at International conference on chemical, environmental and biological sciences (ICCEBS’2012), Penang, Malaysia, 12th February
- Naeem, M.M., M.M. Fairulnizal, M.K. Norhayati, A. Zaiton, A.H. Norliza, W.W. Syuriahti, . . . S. Rusidah. 2015. The nutritional composition of fruit jams in the Malaysian market. J. Saudi Soc. Agric. Sci. 16(1):89–96. https://doi.org/10.1016/j.jssas.2015.03.002
- PFA, 2004. The prevention of food adulteration rules, 1955’. A.16.07.287. http://www.mohfw.nic.in/pfa%20acts%20and%20rules.pdf (accessed 14. 07.09).
- Sehwag, S., and M. Das. 2015. Nutritive, therapeutic and processing aspects of Jamun, Syzygium cuminii (L.) Skeels-An overview. Indian J. Nat. Prod. Resour. (IJNPR) [Formerly Nat. Prod. Radiance (NPR)] 5(4):295–307.
- Shah, A.K., A. Zeb, M.A. Khan, F.N. Shah, N.U. Amin, and W. Muhammad. 2015. Quality evaluation and preparation of apple and olive fruit blended jam. Global J. Med. Res. 15:1.
- Shahnawaz, M., and S.A. Shiekh. 2011. Analysis of viscosity of jamun fruit juice, squash and jam at different compositions to ensure the suitability of processing applications. Int. J. Plant Physiol. Biochem. 3(5):89–94.
- Singleton, V.L., R. Orthofer, and R.M. Lamuela-Raventos. 1999. [14] Analysis of total phenols and other oxidation substrates and antioxidants by means of folin-ciocalteu reagent. Meth. Enzymol. 299:152–178.
- Spiller, G.A., J.A. Story, E.J. Furumoto, J.C. Chezem, and M. Spiller. 2003. Effect of tartaric acid and dietary fibre from sun-dried raisins on colonic function and on bile acid and volatile fatty acid excretion in healthy adults. British J. Nutrition 90(04):803–807.
- Surveswaran, S., Y.Z. Cai, H. Corke, and M. Sun. 2007. Systematic evaluation of natural phenolic antioxidants from 133 Indian medicinal plants. Food Chem. 102(3):938–953. doi: 10.1016/j.foodchem.2006.06.033.
- Telang, P.S. 2013. Vitamin C in dermatology. Indian Dermatol. Online J. 4(2):143. doi: 10.4103/2229-5178.110593.
- Touati, N., M.P. Tarazona-Díaz, E. Aguayo, and H. Louaileche. 2014. Effect of storage time and temperature on the physicochemical and sensory characteristics of commercial apricot jam. Food Chem.. 145:23–27. doi: 10.1016/j.foodchem.2013.08.037.
- US Food and Drug Administration. (2012). National nutrient database for standard reference Release 24.