
 ?Mathematical formulae have been encoded as MathML and are displayed in this HTML version using MathJax in order to improve their display. Uncheck the box to turn MathJax off. This feature requires Javascript. Click on a formula to zoom.
ABSTRACT
Ficus is one of the largest plant genera which are recognized as keystone species. In the previous studies on Ficus, seeds have been counted manually. The main objective of this study is to introduce a model for predicting the yield of seeds in two monoecious species. Three-dimensional magnitudes were measured, and the numbers of seeds were recorded per each fruit. Generalized additive models (GAM) and Poisson regression models were used for prediction. Fruit length is a significant predictor for both models. Moreover, it is observed that data classification as areas plays an important role in GAM. Poisson modeling of Ficus callosa gives better predictions than Ficus racemosa. Besides, predictions of both models are more accurate when the number of seeds is less than 1000.
Introduction
Figs are woody plants belong to the genus Ficus (Family Moraceae). They are native throughout the tropics while few are in semi-warm temperatures. Fig trees are known as keystone species since it has a higher ecological value within its community. In addition, they have unique pollination syndrome which utilizes a species-specific wasp belonging to the family Agaonidae (Shanahan, Citation2000). Fig wasps are the supporting factor for pollination and production process of Fig fruits (Karunaratne, Citation2010:69–71). The wasp concurrently attempts to lay eggs by inserting its ovipositor down the styles. Ovaries on which an egg is deposited results a gall, within which the wasp larvae feed and develop. Ovaries missed by wasps receive pollen and develop into Seeds (Weiblen, Citation2002).
Many birds and mammals consume fig fruits as the major source of food. All these imply that they give a great support to maintain the balance of an ecosystem. Figs are now considered as a category of endangered species. Under these circumstances, many researchers do experiments with the purpose of conserving figs and their wasp pollinators (Gray et al., Citation1999: 1269). In these researches, one of the major constraints is the quantification of seeds per fruit, which is done manually (Denne, Citation1963: 265–294). Therefore, the main objective of this study is to find a solution to this time-consuming and hectic issue. Most of the existing studies for predicting the yield of seeds are based on parametric approach (Compton et al., Citation1994:180–186). The present study is toward a new direction with a non-parametric approach in predicting the yield of seeds of two monoecious Ficus species namely, Ficus callosa and Ficus racemosa (Kjellberg et al., Citation1988: 117–122). Non-normality of all independent and dependent variables was affected by following a non-parametric approach (Fox and Weisberg, Citation2010: 2). This method gives a space to speak data by themselves with relaxed limitations.
Theory of non-parametric approach has been developed since few decades (Wood, Citation2010: 119–125). Generalized additive modeling (GAM) is one of the most outstanding non-parametric modeling techniques, and there were some intermediate states to achieve this improved level. Bin smoothing, moving average, splines and local polynomial regression can be recognized as these intermediate states (Cao and Naya, Citation2010:2–6; Hall and Racine, Citation2015:510–525; Zhao and Ma, Citation2016: 72–79). It is obvious that the total number of seeds is non-zero and discrete-dependent variable in this study. Satisfaction of these two basic requirements leads for Poisson regression modeling (Zeileis et al., 2008:5–7). Additionally, correlation analysis was carried out to identify the relationship between Fig fruits and Fig wasps.
The main objective of this study is to propose a novel approach to build up a model to predict the yield of seeds in Fig fruits. Ficus fruits are spherical in shape apparently, but this assumption was not verified by majority of studies in Ficus (Gray et al., Citation1999: 1269). Thus, the spherical shape of Ficus callosa and Ficus racemosa is examined using a statistical test without taking a risk of biased assumptions. Moreover, in general, the total number of seeds is higher when fruit diameter is higher with respect to fruit length (Denne, Citation1963: 265–294). Hence, our next goal is to clarify whether this phenomenon is valid for both species in this study. Besides, fig fruits–fig wasp relationship is examined (Kjellberg et al., Citation1988:117–122; Compton et al., Citation1994:180–186).
The rest of this article is organized as follows. Section 2 consists the proposed methodology mainly focused on non-parametric statistical approach. Section 3 discusses results from preliminary level to confirmatory level. Section 4 contains the conclusion of the study. All the data analysis and model fitting were performed out using the R statistical software (R Development Core Team, Citation2016).
Methods
Kandy municipal area, the premises of the University of Peradeniya and Thumpane area of Kandy District, Central province, Sri Lanka were considered as the study sites to collect figs of the selected two species. According to results of ArcGIS spatial analysis, Kandy municipal area has least tree covering while the premises of the University of Peradeniya and Thumpane area have moderate and the highest tree coverings, respectively (Karunaratne, Citation2010:69–71). These three sites are assumed to be approximately similar by climatic measurements. The annual rainfall of these areas varies in between 1500 mm and 2500 mm; temperature is in the range of 22.5 °C to 25.0 °C and elevation range differs in between 175masl and 600 masl.
Fruits were collected from fully matured fig trees since it controls growth factors of trees which affect the yield of seeds. From each of the two-fig species, Ficus callosa and Ficus racemosa, 120 mature fruits (with no exit holes, that make sure the wasps have not left the fruit) from each site were collected. In the laboratory fruit length, fruit diameter1 and fruit diameter2 of each fruit were recorded using a venire caliper.
Afterwards, fruits were placed in a separate plastic drinking cup to collect the emerging wasps and the cups were covered with a fine mesh cloth to stop the escape of the emerging wasps. Then, the emerged wasps were transferred individually into separate vials with 70% alcohol for preservation (Karunaratne, Citation2010:69–71). The species of emerged wasps (both pollinator and non-pollinator Fig wasps) from each Fig were identified using identification keys (Priyadarsanan, Citation2000: 175–182). Male and female pollinators and non-pollinators that emerged from Fig fruits were recorded separately for each species. After the emergence of wasps from fruits, each fruit was dissected into two halves and the seeds and galled ovaries of one half of each fruit was counted and recorded. These values were multiplied by two to get the total number of seeds and galls per fruit. The total number of galls and seeds is considered as response variable of the study. Data collection of predictor variables was based on three-dimensional predictors and four pollination-related predictors. Fruit length, fruit diameter1 and fruit diameter2 were classified as dimensional predictors. Moreover, the number of pollinating males, number of pollinating females, number of non-pollinating males and number of non-pollinating females are recognized as pollination-related predictors that relate to pollination mechanism.
First descriptive statistics for dataset were obtained to get an idea about the behavior of data. The central tendency was checked using variable mean. Minimum, quartiles and maximum were found to identify the data dispersion. Graphical methods such as box plot and scatter plot were used to recognize the data pattern visually. After that, the normality of all independent and dependent variables was tested using two tests namely, Anderson Darling test and Lilliefors’ test. However, normality was satisfied by none of the variables in this study. Hence, the study was focused on a non-parametric approach (Fox and Weisberg, Citation2010: 2).
Initially, similarities of fruit dimensional variables were hypothesized for two species using Mann–Whitney U-test. The null hypothesis is given by EquationEquation (1)(1)
(1) ,
Then, hypothesis given in EquationEquation (2)(2)
(2) was made by considering sampling areas as treatment groups. The similarity of dimensional values for each study area was checked using the Kruskal–Wallis test (Hollander et al., Citation2014: 4–7). The same null hypothesis was applied for fruit diameter1 and fruit diameter2. The effect of the species and the effect of the sampling areas on the growth of fruit size can be detected using these two tests. Differences of all possible combinations of two-dimensional variables (fruit length-fruit diameter1, fruit length-fruit diameter2, fruit diameter1-fruit diameter2) were examined to identify whether these differences are reaching to value zero. This null hypothesis was checked using Friedmann test. But it has been assumed without any mathematical proof in the literature (Hollander et al., Citation2014: 4–7). Both Mann–Whitney U-test and Kruskal–Wallis test were applied for dependent variables (Galls, Seeds), and hypotheses of these tests are discussed in Section 3. Non-parametric modeling was performed after completing these tests. All hypotheses were based on median values since data follow non-parametric approach (Hollander et al., Citation2014: 4–7). Next, a statistical model was fitted to predict the yield of seeds.
The expectation of fitting a model is getting highly accurate predictions. Therefore, models with all possible variable combinations were checked. Data have been collected for two species covering three areas. First, GAMs have fitted for separate three areas; Kandy Municipal area, Thumpane area and the premises of the University of Peradeniya (Hastie, Citation2017 :249–307; Hurn et al., 2008). Then, same modeling technique was performed after categorizing the dataset as two separate species which are Ficus callosa and Ficus racemosa. Besides, the prospect of existing common model was checked which can be applied for the data of two species in all the three areas. The total number of seeds is a countable and non-zero-dependent variable in this study. Hence, it is appropriate to apply Poisson regression (Zeileis et al., Citation2008:5–7). As in GAMs, area-specific and species-specific Poisson models were fitted using min-max scaled predictors. illustrates the description of all variables of this study.
Table 1. Description of variables.
Then, the relationship between Fig fruits and Fig wasps was studied. First, the associations between pollinators and amount of galls, non-pollinators and number of seeds, male and female pollinators per Fig fruit were found using the Spearman correlation coefficient. Scatterplots were used to demonstrate the relationship of each two-variable combination (Missanjo and Matsumara, Citation2016:253). Henceforth, GAM and Poisson regression are further explained under the following two subsections.
Generalized Additive Modeling (GAM) for Predicting Yield of Seeds of Ficus Fruits
GAM is a latest technique in non-parametric modeling which can be implemented when the normality assumption of variables is violated (Hastie, Citation2017:249-307; Wood, Citation2010: 119–125). EquationEquation (3)(3)
(3) shows the primary structure of the model.
where Total denotes the total number of seeds, X1, X2 and X3 define fruit length, fruit diameter1 and fruit diameter2, respectively. S1, S2 and S3 are smoothing functions for X1, X2 and X3, respectively. This is the general format of GAM in the study (Erceg-Hurn and Mirosevich, Citation2008: 591–601). Smoothing functions in the format of Sij(Xi, Xj) implies smoothing function of interaction term of Xi and Xj where i, j = 1,2,3 and i ≠ j.
GAMs are applied when a priori reason is not given for choosing a particular response function such as linear, quadratic, among others. GAMs perform via a smoothing function and each smoothing function; (i.e., S1, S2 and S3) is separated into parts which are delimited by knots. Polynomial functions are fitted to each part by taking a constraint that second derivative of separate functions is equal at the knots (Wood, Citation2010: 119–125). Model fit is based on likelihood, and fitted models are directly comparable with GLMs using likelihood techniques such that AIC or classical tests based on model deviance; Chi-squared or F-tests, depending on the error structure.
Min-max scaled-independent variables have been used as a data scaling technique in GAM and Poisson regression. Min-max scaling has resulted in best predictions than original variables in some applications of GAM and Poisson regression (Wood, Citation2010: 119–125). The general expression for min-max scaling is given in EquationEquation (4)(4)
(4) .
Poisson Modeling for Predicting Yield of Seeds of Ficus Fruits
The total number of seeds only takes discrete and non-zero values since there are no fractions of seeds. Poisson regression can be performed at the presence of discrete, non-zero-dependent variable under two assumptions (Zeileis et al., Citation2008:5–7). First one is that the response (dependent) variable has Poisson distribution. The second one is logarithm of its expected value can be modeled by a linear combination of unknown parameters.
Poisson regression restricts to predict values of non-negative numbers since it is a skewed and discrete distribution. It is an advantage over ordinary linear regression. As the variance of the errors is larger than mean, “over dispersed” Poisson models are used in this study. Generally, the model can be defined as
where “Total” represents the total number of seeds and “Exp” implies exponential term. X1, X2 and X3 are min-max scaled fruit length, fruit diameter1 and fruit diameter2, respectively. β1, β2 and β3 represent coefficients of respective min-max scaled variables. Akaike information criterion (AIC) and the Bayesian information criterion (BIC) are used for model selection in both types of models.
Relationship between Fig Fruits and Fig Wasps
Production of galls and seeds can be depended on the density of pollinators and non-pollinators, respectively. Therefore, correlations between the yield of galls and number of pollinators per fruit, and between the yield of seeds and number of non-pollinators per fruit were found using Spearman correlation coefficient (Karunaratne, Citation2010:69–71; R Development Core Team, 2010). Significant results of correlation analysis have been included in Section 3.
Results and Discussion
Descriptive statistics provide a summarized idea about the behavior of data quantitatively. There was no identified literature on Ficus which has described statistical aspects widely, but based on biological and ecological theories. shows the descriptive statistics which were calculated for all independent and dependent variables and results have been tabulated for each sampling area, and shows the summary of descriptive statistics of the same variables for each species separately.
Table 2. Descriptive statistics in sampling areas.
Table 3. Descriptive statistics for sampling species.
According to the results of , there are some fruits that all seeds have been damaged by pollinators (minimum of seed number is zero). But these types of fruits can be seen only within Kandy municipal area and the premises of the University of Peradeniya. It implies that there is a competition for pollination in these two sites with a low density of Fig trees. Urbanization of respective two sites can be caused to this observation. Moreover, the highest total number of seeds is belonging to Thumpane area. This area has a higher density of Ficus trees and most of the environmental factors (soil and water, among others) are over enough for an effective pollination and reproduction process. The overall result of shows that sampling sites can make an effect in the next steps of studies.
There is no big difference in descriptive statistics of fruit length between the two species. But other variables show a significant variation by descriptive measurements. It can be identified that most of the seeding measurements (Galls, Seeds) in Ficus racemosa are approximately five times larger than measurements in Ficus callosa. It is obvious to mention that the number of seeds of Ficus callosa is smaller in size than that of Ficus racemosa according to the tabulated summary of descriptive statistics. Graphical methods were performed after calculation of descriptive statistics. and illustrate the boxplots of independent and dependent variables for Ficus callosa and Ficus racemose, respectively.
Figure 1. Boxplots of fruit dimensions for Ficus callosa and Ficus racemosa.
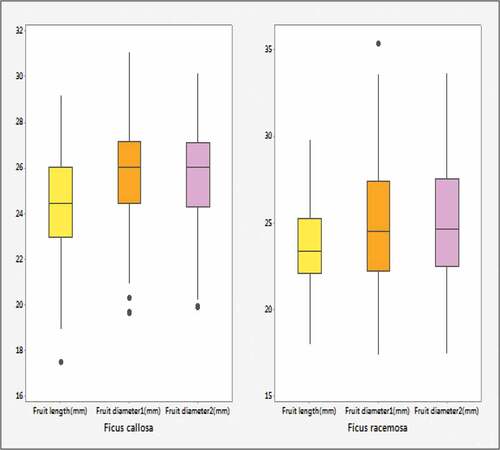
Figure 2. Boxplots of seeding variables for Ficus callosa and Ficus racemosa.
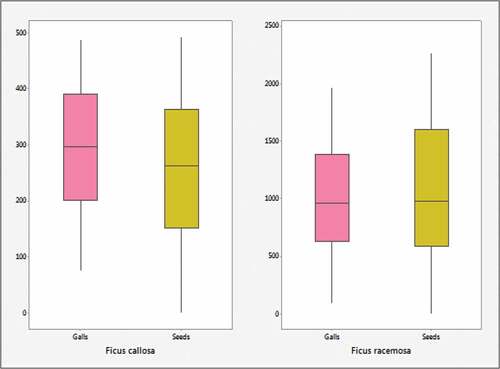
implies that inter quartile ranges (IQR) of dimensional variables in Ficus callosa is lying in a relatively small range with respect to Ficus racemosa and a high dispersed quality of Ficus racemosa. In , seeding variables (Galls, Seeds) of Ficus racemosa vary in a large scale (0–2500), while seeding variables (Galls, Seeds) of Ficus callosa are in a small scale (0–500).
Past literature has mentioned that seed number is increased when fruit diameter is higher than fruit length (Denne, Citation1963: 265–294). This result has been evaluated using the dataset of this study and results are given in .
Figure 3. Total number of seeds versus ratio of dimensions (length/diameter).
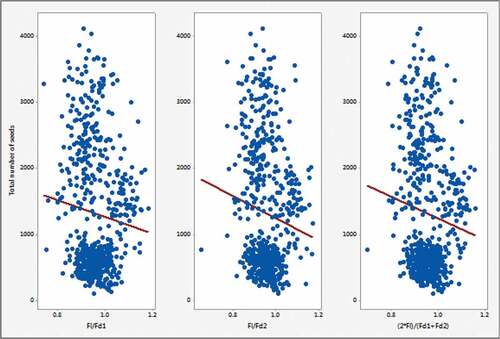
shows a higher increment of the total number of seeds when the ratio is less than 1. The ratio is calculated using a division of fruit length by fruit diameter. The ratio becomes less than one when fruit diameter increases comparatively with respect to fruit length. This observation implies that the total number of seeds increases when fruit diameter is higher than fruit length. All possible ratios between fruit length and fruit diameter were calculated, and the same result was obtained.
After completing the basic analytical part, normality test was performed and it was an influential point in the study. The referred literature on Ficus fruits had assumed normality without statistical evidence for satisfying normality (Shanahan, Citation2000). But in this study, Anderson Darling Test and Lillifos’ test was performed to check normality of dimensional variables, galls, seeds and variables related to pollination. The results are shown in .
Table 4. Normality test results using Anderson Darling test.
It can be concluded that all variables violate normality assumption in this study since all the p-values are less than 0.05. Besides, Lilliefors’ test was performed for confirmation of non-normality and the same result was obtained as Anderson Darling test. Therefore, non-parametric tests are used to test the similarity of fruit dimensions and yield of seeds (seeds, galls) by comparing both area and species. It is essential to state that hypotheses of all tests are based on median values of variables since we are using the non-parametric approach. Henceforth, each non-parametric test is discussed separately.
Literature based on Ficus species has assumed a spherical shape of fruits without any statistical evidence (Shanahan, Citation2000). Friedman test was applied to check the difference between each pair of dimensions variables. According to results of Friedman test, equality of medians of fruit diameter1 and fruit diameter2 are failed to reject at 5% significance level (p-value = 0.5841). But fruit length differs from the other two diameter values (p-value<0.05). It is prejudicial to assume spherical shape at the beginning of the study without any evidence. It is observed that fruit length is not equal to fruit diameter1 and fruit diameter2. Therefore, the volume of fruits cannot be calculated using as in previous papers (Shanahan, Citation2000).
Species are independent according to biological theories. Mann–Whitney U-test was performed to check similarity of dimensions between two species considering the null hypothesis in EquationEquation (1)(1)
(1) of Section 2. A numerical evidence (p-value<0.05) shows that two species are not similar by any dimensional measurement was obtained. Theory of independence in biological studies is strengthened by these results.
Then, data of both species were tabulated according to the three areas and the similarity of dimensional measurements’ medians was checked using Kruskal–Wallis test. The corresponding null hypothesis of the test is given by EquationEquation (2)(2)
(2) in Section 2. All dimensional variables are not similar in area vice according to p-values of Kruskal–Wallis tests (p-values<0.05) for three areas.
Then, the similarity of the number of seeds and number of galls was checked by considering areas and species. Median of each variable was used in statistical tests. Null hypotheses of all tests defined as in EquationEquations (6)(6)
(6) and (Equation7
(7)
(7) ) were rejected according to p-values.
Moreover, similar hypotheses were checked for the number of galls. All these non-parametric tests imply that there can be effects from areas and species to the growth of fruits (fruit dimensions) and the yielding process of seeds (seeds, galls). Even though there were few works on Ficus studies with detailed statistical analysis, none of them performed non-parametric tests (Gray et al., Citation1999:1269; Shanahan, Citation2000). Therefore, a model fitting step was initialized after completing a series of non-parametric tests.
Statistical modeling results are discussed under two principal aspects that are GAM and Poisson regression. Overview of non-parametric tests results is concluded that areas and species can make a significant effect on size and pollination of Figs. Therefore, model fitting was done by considering these two factors, areas and species.
GAM was performed as an optimized solution for the non-parametric model fitting. and show the results of area-specific and species-specific GAMs, respectively. In each of resulting models, “*” implies significance of that particular variable. The term “deviance explained” in and analogous to variance in a linear regression.
Table 5. Generalized additive models for areas.
Table 6. Generalized additive models for species.
Results of imply that fruit length is a significant variable in every model. Best model has 62.5% of model accuracy, and it can be used to predict the yield of seed in both Ficus callosa and Ficus racemosa in Kandy municipal area. Moreover, this model requires only fruit length as independent variable. GAM for Thumpane area is the second best model, and it gives the best predictions with single smoothing function of fruit length. All these facts allocate a room to discuss “Do fruit diameter1 and fruit diameter2 are really needed to be studied?”. It can be identified that fruit length is sufficient to perform GAM, since all best GAMs are fitted under the significance of single predictor; fruit length.
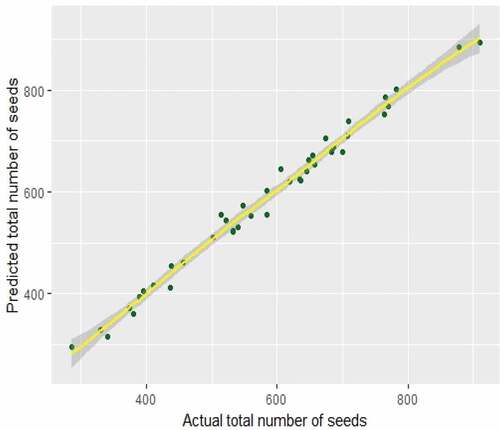
A plot of fitted values versus actual values is demonstrated in . The sourcing model of this plot is the best GAM for Kandy municipal area, and sample of data was selected randomly to plot this graph.
Figure 4. Predicted values versus actual values of the yield of seeds in Ficus fruits for GAM in Kandy municipal area.
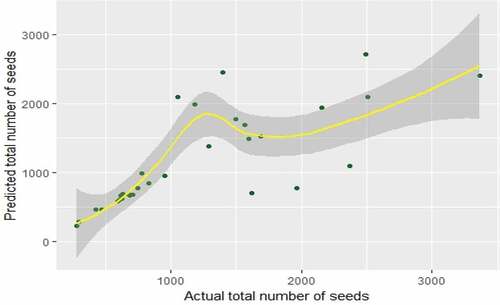
shows that Cartesian coordinates of actual and predicted values of the yield of seed for the best GAM in Kandy municipal area. There is a large deviation between actual and predicted values of the yield of seeds when actual value exceeds 1000.
GLMs for each species were given in . Symbol of “*” represents the significant variable in each model.
Results of are not given a satisfactory result with respect to the results of . Even the best model for species gives 16.4% of model accuracy. These results imply the necessity of an alternative method to fit models for each species. Poisson regression was applied as an alternation, and it well answered with predictions of Ficus callosa. It can be identified that min-max scaled independent variables are best applicable in these Poisson models and all min-max scaled independent variables are significant in every Poisson model. The results are tabulated in .
Table 7. Poisson models for Ficus callosa and Ficus racemosa.
Mean square error (MSE) values of given models imply that Poisson models for Ficus callosa are better than Poisson models for Ficus racemosa. The best Poisson model of Ficus callosa has resulted with min-max scaled fruit length, fruit diameter1 and fruit diameter2. This study can be considered as the first attempt of scaled predictors in the model fitting history of Ficus species. It shows that min-max scaled predictors that are in the same range (0, 1) give the best results than original predictors in Poisson regression. shows that there is a better agreement between actual and fitted values of best Poisson model for Ficus callosa. Actual total seeds of Ficus callosa do not exceed 1000 according to the descriptive statistics in . The same result was found with GAMs also. Area-specific Poisson models were also fitted for Poisson regression. But MSE and AIC values of Poisson models for areas are higher than those for species-specific Poisson models. Therefore, those results are not included in this paper.
Figure 5. Predicted Values versus Actual Values plot for Poisson Models in Ficus callosa.
According to , it can be concluded that there is a good agreement between the actual yield of seeds and predicted the yield of seeds in Ficus callosa fruits with higher percentage of accuracy. Here, all the actual values of the yield of seeds are less than 1000.
Relationship of pollination-related variables-fruit length and pollination-related variables-seeding variables (Galls, Seeds) were checked after completing model fitting step. shows the relationships between pollinating factors and seeds, pollinating factors and dimensions.
Figure 6. Scatterplots based on pollinators and non-pollinators.
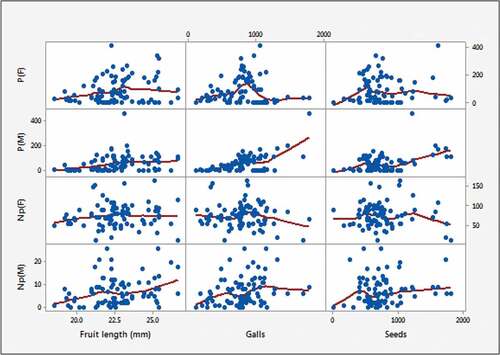
shows that there is an increment of galls when the number of male pollinators increase (γ = 0.60). There is a moderate positive correlation between the number of non-pollinators (both male and female) and the number of seeds (γ = 0.51). All these results reveal that pollinating and non-pollinating Fig wasps are influential factors in transforming seeds into galls (damaged seeds). This result gives a space to extend future study on model fitting by considering an influence of pollination toward the yield of seeds.
Conclusion
GAM of Kandy Municipal areas with single smoothing function of fruit length is the best GAM among fitted GAMs. Hence, there is no need for collecting three-dimensional variables for GAMs and a lot of time and money can be saved. Poisson model for Ficus callosa with min-max scaled fruit length and two fruit diameters gives better predictions than all possible Poisson models in Ficus racemosa. Further, GAMs and Poisson models are good at prediction when the actual yield of seeds is less than 1000.
Non-parametric test statistics concludes the independency of species. Median value of any dimensional variable or seeding variable was not identical for considered two species or three areas. Furthermore, it implies that species are independent by its dimensions and seeding measurements.
Moreover, Ficus callosa and Ficus racemosa are not spherical in shape. Besides, the total number of seeds of a fruit increases when fruit diameter is higher than fruit length in a particular fruit. Correlation analysis of Fig wasps and Fig fruits gives two major findings; the amount of galls is higher in the presence of a large number of male pollinators and fruit that has large number non-pollinators causes for a majority of undamaged seeds. All these findings are based on monociouse species where male and female flowers are produced in the same trees. But there is room to improve model fitting for diociouse species in which male and female structures are generated in separate trees.
Related Research Data
References
- Cao, R., and S. Naya. 2010. The use of statistical software to teach nonparametric curve estimation from EXCEL to R. Paper presented at the 9th International Conference on Teaching Statistics (ICOTS8). Ljubljana, Slovenia, Voorburg, Netherland. 10 July.
- Compton, S.G., Ross, S.J. and Thornton, I.W.B., 1994. Pollinator limitation of fig tree reproduction on the island of Anak Krakatau (Indonesia). Biotropica, pp.180–186.
- Erceg-Hurn, D.M., and V.M. Mirosevich. 2008. Modern robust statistical methods: an easy way to maximize the accuracy and power of your research. American Psychologist 63(7):591. doi:10.1037/0003-066X.63.7.591.
- Fox, J., and S. Weisberg. 2010. Non-parametric Regression in R. Appendix R. Companion Appl. Regression 116(2):2–5.
- Gray, M.J., R.M. Kaminski, and M.G. Brasher. 1999. A new method to predict seed Yield of moist-soil plants. J. Wildl. Manage. 63(4):1269. doi: 10.2307/3802844.
- Hall, P.G., and J.S. Racine. 2015. Infinite order cross-validated local polynomial regression. Journal Of Econometrics 185(2):510-525. doi:10.1016/j.jeconom.2014.06.003.
- Hastie, T.J., 2017. Generalized additive models. In Statistical models in S (pp. 249–307). Routledge
- Hollander, M., D.A. Wolfe, and E. Chicken. 2014. Nonparametric statistical methods. John Wiley & Sons, New York.
- Karunaratne, I., 2010. Pollinator and non-polinator fig wasp relationship in syconia of ficus exasperata. Ceylon Journal Of Science (Biological Sciences), 38(2). doi:10.4038/cjsbs.v38i2.1860
- Kjellberg, F., B. Doumesche, and J.L. Bronstein. 1988. Longevity of a Fig wasp (Blastophaga psenes). Paper presented at the koninklijke nederlandse akademie van wetenschappen Series C. Biological and Medical Sciences, Amsterdam, New York.
- Missanjo, E., and J. Matsumura. 2016. Genetic improvement of wood properties in Pinus kesiya Royle ex Gordon for Sawn timber production in Malawi Forests. 7(11):253. doi: 10.3390/f7110253.
- Patricia Denne, M. 1963. Fruit development and some tree factors affecting it. New Zealand Journal Of Botany 1(3):265-294. doi:10.1080/0028825X.1963.10428999.
- Priyadarsanan, D.R. 2000. Fig insects of Kerala. Records of the Zoological Survey of India. Director, ZSI, Calcutta, India.
- R Development Core Team. 2016. R: A Language and environment for statistical computing. In: R Foundation for statistical computing. Vienna, Austria.
- Shanahan, M. 2000. Ficus seed dispersal guilds: Ecology evolution and conservation implications. The University of Leeds Centre for Biodiversity and Conservation School of Biology, PhD Diss, Leeds, UK.
- Weiblen, G.D. 2002. How to be a fig wasp. Annual Review Of Entomology 47(1):299-330. doi:10.1146/annurev.ento.47.091201.145213.
- Wood, S.N. 2010. Generalized Additive Models: An introduction with R. CRC Press, Boca Raton, Florida, USA.
- Zeileis, A., Kleiber, C. and Jackman, S.,2008. Regression models for count data in R. Journal of statistical software, 27(8), pp.1–25.
- Zhao, G. and Ma, Y.,2016. Robust nonparametric kernel regression estimator. Statistics & Probability Letters, 116, pp.72–79.