
 ?Mathematical formulae have been encoded as MathML and are displayed in this HTML version using MathJax in order to improve their display. Uncheck the box to turn MathJax off. This feature requires Javascript. Click on a formula to zoom.
ABSTRACT
Color development in ‘Feutrell’s early’ fruit was used to determine the time of harvest, when color changes from dark green to fully orange take place during season of peak maturity. Ten fruits from each replication were harvested on visual observation of their skin color, and were subsequently made ready for biochemical analysis of color determination by using Chromameter. Dark green color to light green fruits were ordered in (1–5) order whereas light orange to deep orange were given (6–10) numbering orders. Triplicate determinations of all samples were used for all the laboratory analysis. Fruit-peel chlorophylls were recorded as more in fruits having color dark green which on the other hand, had gradually decreased in orange colored fruits. The carotenoids, however, have showed the opposite trend. Titratable acidity and ascorbic acid were observed as lessened in green coloration fruits, while the pH, total soluble solids (TSS), total dissolved salts (TDS), and sugar values showed an increasing tendency in orange-colored fruits. Values of reducing sugars and antioxidants were noted as decreased in orange colored fruits while anthocyanins were increased in that produce. Nonetheless, phenolic contents, flavonoids and flavonols were not significantly affected in coloration. Dark green to light green fruits possessed more titratable acidity, ascorbic acid, antioxidant as well as phenolic contents, and were more useful from nutritional point of view. Light orange to deep orange colored fruits had more sweetness, palatability, and tastiness to appeal increased consumer’s acceptance.
Introduction
Modern citrus industry of the world requires quality fruits contained in smart (active and intelligent) packaging materials. Whereas, domestic fruit markets mostly rely on the fruit visual maturity index. Visual maturity index in fruit is complicated one involving judgment of external peel coloration and internal pulp changes like total soluble solids, acidity, sugars level and juice percentage (Thompson, Citation2014). Citrus, being a non-climacteric fruit, faces ripening only on tree and fruits maturation depends on visual observations conducted in the field. For export purposes, minimum standard of quality parameters like juice percentage, soluble solids as well as TSS: acid ratio are followed before harvesting is done (Lado et al., Citation2014). Meanwhile domestic market of citrus fruit depends on fresh fruit consumers’ preference which mostly based on fruit peel coloration regarding fruit maturation.
Citrus fruit maturation was determined by judging the coloration of peel in ancient times, which still exists in modern age to appeal increased consumer acceptance. Peel coloration is fruit quality attributes which defines fruit taste, sweetness and deliciousness (Sites and Reitz, Citation1950). Diversity in peel coloration is directly correlated with fruit types, maturity stage and growing locality. Wide range of color tones within a species during maturation stage has delayed harvesting time with more fruit drop, and glut in markets upon bulk quantity arrival. In mandarin, ‘Feutrell’s Early’ fruit has short duration and represents increased peel color variation like dark green to full red or orange color at peak season, with attaining adequate maturity index. Delay in harvesting leads to more fruit drop. Color of peel is a visual observation on field as well as marketing. In both ways, growers suffer either by harvesting produce with less developed color, or to delay harvesting with more fruit drop and market glut with other citrus fruit competition (Nawaz et al., Citation2019c).
Color is being widely used as an indicator of maturity in citrus fruits that possess variation with relation to growing locations, climatic conditions, and diurnal temperature (Cronje et al., Citation2013; Porras et al., Citation2014). In warm regions, citrus peel coloration is lighter and changes slowly (Mesejo et al., Citation2012). In tropics, citrus shows inability to change color and maturity index of fruit does not depend on color (Steward & Wheaton, Citation1973). In the world, commercial color index for harvesting of citrus fruit depends upon the citrus variety with environmental conditions at different locations. It is a fact that external peel coloration in citrus fruit represents internal changes, hence, is not a good indicator to be used in harvesting. To justify this logic, mandarin fruits show variability in coloration with relation to internal quality maturity indexes (Tadeo et al., Citation2008). In mandarin, high variability in maturity indices is based on coloration and TSS: acid ratio may vary in different locations. Coloration of peel at harvest stage is one of the parameter of maturity indexes to be used as a tool of commercial marketing. Other maturity indices such size of fruits, shape index, blemishes scars outer skin, biotic damages of pests-diseases as well abiotic factors like wind scratches and stem damage and other physiological disorders are mostly visual-based fruit quality standards (Nawaz et al., Citation2018, Citation2019c) which are applied worldwide. Similarly, fruit internal characteristics like sugars, acids, and polyphenols along with antioxidants are also concealed quality parameters that require standard laboratory techniques and procedures for accurate determination.
Variability in peel color from green to red or orange at peak maturity time in ‘Feutrell’s Early’ fruit is a rising trend in commercial orchards, which has forced the growers to delay the harvesting stage. Now, it is time to investigate peel coloration correlation with fruit internal quality parameters. In this context, the present research endeavors are based on fruit peel coloration at maturity time with fruit internal changes in ‘Feutrell’s Early’ cultivar.
Materials and Methods
The research effort regarding colors development in ‘Feutrell’s Early’ peel and juice biochemical quality parameters were performed in 2018 growing season.
Fruit Selection Based on Color
10 fruits of Feutrell’s Early at maturity time on 30 November were harvested on visual color based from individual plant and three plants were selected in each replication (total nine plants) growing at Citrus Research Institute, Sargodha, Pakistan. A criterion was used to harvest dark green to fully red color attained fruits. Then in laboratory, Chromameter (Osaka, Japan, Konica Minolta) was used for recording color of fruits by arranging dark green to fully red color by given in order of 1–10 arrangements accordingly which shown in in result and discussion section. Fruits were rearranged on Chromameter value (a) for further analysis at department of Horticulture, Pir Mehr Ali Shah – Arid Agriculture University Rawalpindi, Pakistan. Chromameter parameter (a) shows green tinge (−ve) and red (+ve), value (b) indicates blue color in (−ve) and yellowness in (+ve). L is luminosity whose range near to (0) depicts blackness and to (100) stands for color lightness or whiteness. Value (C) stands for chromaticity which decides color purity with range near to (0) represents grayness and with (60) or above value to show vivid color. Value (h) is hue angle that rotate in a circle of 360° with near to 120° to show green color and 90° or below red or orange (Nawaz et al., Citation2020).
Table 1. Chroma meter value of ‘Feutrell’s Early’ (Fruit 1–10) color based.
Chlorophyll and Carotenoids Measurement
Peel of fruits (1–10) was used for chlorophylls and carotenoids measurement. Sample of 1 g of each fruit peel was ground in 10 mL acetones (80% v/v) and filtered supernatants were taken (3 mL) in glass cuvette . Finally, absorption of each samples at wavelength of 663, 645, and 470 nm on Spectrophotometer (Model: SP-3000 plus Optima, Japan) was recorded. Total chlorophyll, chlorophylls a and b and carotenoids were calculated by using equation as described by Lichtenthaler and Wellburn (Citation1983) and Sumanta et al. (Citation2014).
Total Chlorophyll = 20.2 A645 + 8.02 A663
Chlorophyll a (C a) = 11.75 A663 – 2.350 A645
Chlorophyll b (C b) = 18.61 A645– 3.960 A663
Total carotenoids = 1000 A470– 2.270 C a – 81.4 C b/227
Fruit Juice Extraction
Electrical juicer was used to extract juice from fruits and then filtered to avoid any ingredients of seed for biochemical analysis (Nawaz et al., Citation2019b).
pH, TSS and TDS Measurement
Hanna pH meter (Model: HI 2211 pH/ORP meter) was used to measure pH. Portable Refractrometer (Model: FG-103) was used to measure TSS (0brix). EC meter (model: Cond. 720) was used for measuring TDS (mgL−1) of juice (Nawaz et al., Citation2019d).
Titratable Acidity (TA)
Titration method for TA (g/100 mL of juice) as explained by Nawaz et al., (20019b) was used. Fruit juice of 10 mL quantity was taken and added with 40 ml distilled water to make solution up to a volume of 50 ml. Ten milliliter was then taken from already prepared diluted 50 mL volume (1-juice: 5-dH2O) and added with 2–3 drops of phenolphthalein as an indicator before being titrated against (0.1N) Sodium hydroxide (NaOH) till pink color appeared. Sodium hydroxide (0.1N) was prepared freshly by dissolving 4 g of NaOH pellets in 1000 mL of distilled water and properly shaken to be mixed before use on a magnetic stirrer.
Ascorbic Acid Measurement
Five milliliter juice and 5 mL HCl (1%) was grounded and poured into Eppendrop tube. It was then centrifuged at 10,000 rpm for 10 min. After centrifugation, 0.3 mL mixture was taken and added 2.7 mL dH2O and measured absorbance at wavelength 243 nm on Spectrophotometer.
Sugar Estimation
Sugars from juice were estimated by following standard techniques described by Nawaz et al. (Citation2019a) and Nawaz et al. (Citation2019b).
Reducing Sugar
Ten milliliter juice was taken in 250 mL beaker and added 10 mL Potassium oxalate (7%) and 25 mL Lead acetate (2%) and made its volume up to 250 mL with dH2O. Fehling solutions 10 mL (5 mL of each A and B) were used to titrate against prepared sample with gentle warm until red precipitated appeared. Fehling A was prepared by dissolving 69.3 g of copper sulfate pentahydrate in 1000 mL distilled water and Fehling B by dissolving 100 g of Sodium hydroxide anhydrous and 345 g of Sodium Potassium tartrate (KNaC4O4H3) in 1000 mL of distilled water.
Total Sugar
Twenty-five milliliter of prepared sample (250 mL of reducing sugar) was taken in beaker. Beaker was then added with 20 mL dH2O as well as 5 mL concentrated HCl and kept in dark for overnight. Next day, the solution earlier was added with 2–3 drops of phenolphthalein indicator and NaOH before being titrated against Fehling solution. Method was similar to that of reducing sugars, from this point onwards (after titration).
Non-Reducing Sugar
It was calculated from total sugar to reducing sugar as given formula.
Total Phenolic Contents (TPC)
TPC were measured through Folin-Ciocalteu method by following the procedure adopted by (Miliauskas et al., Citation2004). One milliliter of juice was taken in volumetric flask and added 10 mL Methanol (85% v/v) and well shaken. After 1 h, plant extract of quantity 1 mL was taken and poured into another 50 mL volumetric flask and added 5 mL of FC Reagent (10% v/v). Just after 2–8 min later, 4 mL of Sodium carbonate (7%) were added and kept the sample for half an hour to develop blue color. Absorbance was finally checked at 765 nm. Similarly, a blank sample without plant extract (5 mL FC Reagent + 4 mL Sodium carbonate) was also prepared. Nawaz et al. (Citation2019b) described standard curve of gallic acid equivalent (GAE) and expressed as mg of GAE/100 mL of juice or peel FW.
Total Flavonoids Contents (TFC)
TFC were measured by following procedure of Nongalleima et al. (Citation2017). Pure ethanol based plant extract (1:10) was prepared. One milliliter of plant extract was taken in glass cuvette and added 0.1 mL of each Aluminum chloride (10%) and Sodium acetate (10%) and also added 1.2 mL of dH2O. Kept samples for 2 h in dark and then checked absorbance at 415 nm. Similarly, a blank sample without plant extract (0.1 mL AlCl3 + 0.1 mL sodium acetate + 1.3 mL dH2O) was also prepared. Standard curve of quercetine as described by Nawaz et al. (Citation2019b) was used for measuring TFC.
Total Flavonols Contents (Tfoc)
Tfoc were measured by following procedure of Miliauskas et al. (Citation2004). Pure ethanol based plant extract (100 µg/mL) was prepared. Plant extract of quantity 0.5 mL was taken in glass cuvette and added 0.5 mL of Aluminum chloride (20%) and 1.5 mL of Sodium acetate (10%). Kept samples for 2.5 h in dark and then checked absorbance at 440 nm. Standard curve of quercetine as described by Nawaz et al. (Citation2019a) was used to calculate TFoC.
Total Anthocyanins
Lee et al. (Citation2005) method was used for measuring total anthocyanin content. Pure ethanol based plant extract (1:10) was prepared. Potassium chloride (0.025M) with pH = 1.00 and Sodium Acetate (0.4M) with pH = 4.00 were prepared. Plant extract of quantity 0.2 mL was taken in glass cuvette and added with 2.00 mL of Potassium chloride (pH = 1.00). Separately, plant extract of quantity 0.2 mL was taken in glass cuvette and added with 2.00 mL of Sodium acetate (pH = 4.00). Both samples absorbance were checked at 510 nm and at 700 nm also. In blank sample, simple distilled water (3.00 mL) was used and expressed as milligram of Cyanidine 3-glucoside/L or kg (mg C3GL−1 or kg−1).
Antioxidant Activity (DPPH)
Antioxidant activity (DPPH inhibition or scavenging %) was measured by standard procedure described by Thaipong et al. (Citation2006). Pure ethanol based plant extract (1:2 ratio) was prepared. Plant extract of quantity 0.1 mL was taken in glass cuvette and added with 2.9 mL of DPPH working solution. Samples were kept for half an hour in light inside the laminar chamber, before checking their absorbance at 515 nm on Spectrophotometer (Model: SP-3000 plus Optima, Japan). Stock solution was prepared by dissolving 24 mg DPPH in 100 mL of pure ethanol. Working solution was prepared by checking absorbance value 0.980 ± 0.2 at wavelength 517 nm by adding pure ethanol in stock solution until absorbance value reached near 0.980 ± 0.2. Blank sample (without plant extract) was prepared by adding 0.1 mL ethanol and 2.9 mL working solution and absorbance was noted just after preparation at 515 nm wavelength.
Statistical Analysis
Experiment was performed in three biological replicates by using analysis of variance technique. Ten fruits were randomly harvested from individual plant in each replication. LSD test with 5% significance level, on Statistix 8.1 software was used to compare parameters. Triplicate determination of all samples was performed for carrying out biochemical analysis (Nawaz et al., Citation2019a, Citation2019b).
Results and Discussions
Fruit color development in ‘Feutrell’s Early’ fruits imitated significant change, as explicated and conversed under.
Coloring Based Fruit Arrangement
Color-based data for analysis is shown in .
Feutrell’s Early fruits were arranged on coloring basis from dark green to fully red color by given in order of 1–10 arrangements accordingly. Dark green peel color fruits were ordered as number 1 and completely or deep red were marked as 10. Fruits numbering order from 1 to 10 was organized on peel coloration as such (1 = dark green and 10 = fully orange, fruit No. 1 to 5 possessed dark green to very light green and fruit No. 6 to 10 represented light orange to deep orange color.
Chlorophylls and Carotenoids in Peel
Chlorophylls and carotenoids in order (1–10) fruits peel are shown in .
Figure 1. Chlorophylls and carotenoids Feutrell’s Early’ peel (Fruit 1–10).
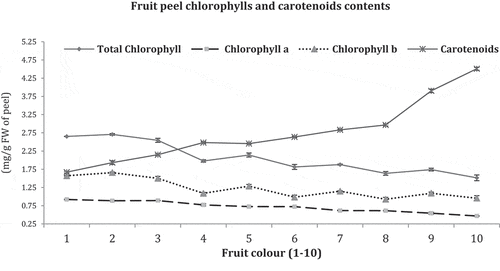
Total chlorophyll, chlorophyll (a) and chlorophyll (b) maximum contents were recorded in dark green colored fruit (2.65, 0.92 and 1.57 mg/g) and minimum in deep orange color (1.52, 0.47, and 0.96 mg/g), respectively. Converse to chlorophylls, more carotenoid contents were noted in deep orange colored fruits (4.51 mg/g) and minimum in dark green fruits (1.67 mg/g). Progressive reduction in chlorophyll contents in peel from dark green to deep orange colored fruits were seen whereas an inverse development was observed in carotenoids level.
Chlorophylls contents disintegrated during citrus fruit color development on attaining maturation, and this phenomenon was seen in fruit (1–10) on decreasing trend from dark green to deep orange colored fruit of Feutrell’s Early. Converse to chlorophylls contents, carotenoid contents in peel of fruit (1–10) gradually increased in fruit coloration stages and attained maximum level in mature fruit of deep orange color (No.10). These contents are indispensable pigments which are commonly functioned in photosynthetic activities and also defend plant components from harmful consequence of cosmological radiation and oxidative pressure (Gitelson et al., Citation2002; Young and Britton, Citation1993). In citrus peel, chlorophylls function as fortification against destructive consequence of heat and solar pollution (UV) (Josse et al., Citation2000; Rissler and Pogson, Citation2001). Likewise, carotenoids contents work as to stabilize proteins during growth and development of fruit (Simkin et al., Citation2008). Both chlorophylls and carotenoids in citrus peel also perform function of antioxidants and regulate the age of fruits on tree. Fruit color development on attaining maturity index is directly linked with carotenoids and sugars accumulation with chlorophylls and acid contents degradation (Giovannoni, Citation2001). In present findings, more carotenoids were found in orange color fruits having lesser chlorophylls contents. Coloration in citrus fruits ranged from green to orange (red or yellow) is attributed with degradation of chlorophylls and buildup of carotenoids in peel (Liu et al., Citation2006). Earlier or late fruit coloration in citrus peel is correlated with the rate of chlorophylls degradation and carotenoids accumulation (Baldwin, Citation1993); which vindicated the current study.
Fruit Biochemical Quality (Acids)
Biochemical value parameters are shown in .
Table 2. Biochemical properties (acids) in ‘Feutrell’s Early’ (Fruit 1–10) color based.
Fruit juice pH was noted as the maximum in orange colored fruit No. 9 (4.01) and minimum in dark green fruit No. 1 (3.54). TSS was observed maximum in deep orange colored fruit No. 10 (10.55 °birx) and minimum in green colored fruit No.2 (9.00 °birx). TA was found maximum in dark green colored fruit No.1 (0.51 g/100 mL) and gradually decreased up to minimum in fruit No. 8 (medium orange) to 10 (deep orange) (0.41 g/100 mL). Ascorbic acid was found as more in green colored fruit No. 2 (50.41 mg/100 mL) and gradually reduced in color change order as well as less in deep orange colored fruit No. 10 (42.22 mg/100 mL). TDS was measured as the maximum in deep orange colored fruit No.10 (1454 mgL−1) and slightest in dark green colored fruit No.1 (1236 mgL−1).
Color development from dark green colored to deep orange fruits gradually decreased the TA and ascorbic acid, whereas orange colored fruits had shown an increasing tendency of pH, TSS, and TDS values. Acidity and ascorbic acid contents were found as lessened in fully matured citrus fruit (Hardy and Sanderson, Citation2010) but acidity diminished in mandarin on impending to maturity phase (Thapa and Gautam, Citation2002). During the phase of fruit color development, acids are rapidly used in respiration (TCA cycle). Decreasing level of acidity reduced ascorbic acid level in juice (Rokaya et al., Citation2016) and on maturity; it changed to 2-3-dioxy-L-gluconic acid by dropping L-ascorbic acid (Mapson, Citation1970). In citrus juice, acids are degraded in citrus juice at maturity (Giovannoni, Citation2001) that resulted in reduction of ascorbic acid contents and TA in orange peel coloring fruits, with increasing level of pH, TSS, and TDS along with more sugars accretion was also observed. TSS characterizes approximately 10% of acid like malic, citric and oxalic and 10% of nitrogenous compounds such as amino acids, in addition to bulk amount of sugars 70–80% (Davies and Albrigo, Citation1994). Orange colored fruit (No. 10) contained more TSS level which matched with additional sugars and subsequently higher TDS level as well, and all this was observed in present study. Orange colored fruits have shown a significant increased level of sugars, total soluble solids and TDS and decreased contents of TA and ascorbic acids and vice versa level were observed in green fruits.
Fruit Biochemical Quality (Sugars)
Biochemical quality sugars parameters are accessible in .
Figure 2. Fruit sugars level on color development.
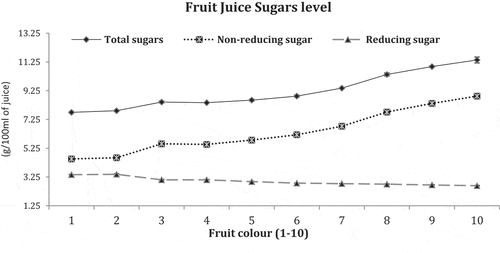
Fruit juice both total and non-reducing sugars were found maximum in deep orange colored fruit No.10 (11.39 and 8.87 g/100mL) and minimum in dark green fruit No.1 (7.75 and 4.51 g/100 mL), respectively whereas reducing sugar showed an opposite tendency and was found maximum in green colored fruit No. 2 (3.44 g/100 mL) and minimum in deep orange colored fruit No. 10 (2.64 mg/100 mL).
Sugars like total and non-reducing were steadily improved on fruit color development and showed an increasing trend on the fruits having full/deep orange coloration. Maturing fruit changed peel color with conversion of reducing to non-reducing sugars and subsequently started decreased in orange colored fruits. At initial ripening stage sugar level remains lower with a gradual increase at full maturity (Hardy and Sanderson, Citation2010). Sugar/acid ratios regulate citrus fruit maturation process and upon attaining ripening stage after fruit growth and development, sugars level increased with reduction of acid level (Thompson, Citation2014). In current findings, more sugars were accrued in deep orange colored fruit (No.10) with less TA. Similarly, TSS characterizes near 80 percent of sugars including sucrose, glucose, and fructose and was noted as larger in deep orange colored fruit (No. 10) to strengthen that the color development in peel also increases citrus fruit sugar level. Oxidation and reduction progression during peel coloration has transformed sugar from reducing to non-reducing. Reducing sugar has a unrestricted ketone or aldehyde group (Charlotte and Kathleen, Citation2013), which serves as agent in reducing sugar in ripening fruits to cut its level by altering to non-reducing sugar. Reducing sugar was extra recorded in dark green fruit (No. 1) which gradually reduced in orange fruits.
Total Phenolic Contents
TPC are represented in .
Figure 3. Total phenolic contents in both peel and juice of fruit color (1–10).
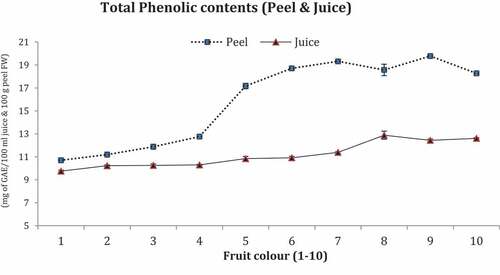
Maximum phenolic contents were recorded in peels of fruit No.7 and 9 (20.0 mg of GAE/100 mL each) and minimum in peel of fruit No.1 and 2 (11.0 mg of GAE/100 mL each) whereas the juice contents of fruit No. 8 to 10 possessed maximum TPC (13.00 mg of GAE/100 mL) and minimum values were in fruit No. 1 and 2 (10.0 mg of GAE/100 mL each).
Total phenolic contents were recounted unlike in citrus fruits which were achieving maturity index at dissimilar periods (Webb et al., Citation2007). Citrus fruits peel (1–10) increasing trend of TPC during color development was shown and more found in fruits with orange color. Juice TPC persisted non-significant in dark green to deep orange coloring fruits. TPC in present study showed an irregular level in fruit in juice and slightly increased in peel upon touching orange coloring. These conclusions are in link with the findings of Mokhtar et al. (Citation2014).
Total Flavonoids Contents
TFC are shown in .
Figure 4. Total flavonoids contents both in fruit peel and juice of color based (1–10).
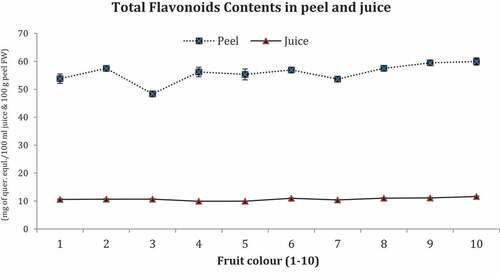
Maximum TFC were recorded in peels of deep orange colored fruit No.10 (60.0 mg of quer.eqal./100 mL) and minimum in peel of green colored fruit No.3 (48.0 mg of quer.equl/100 mL) whereas the juice contents of fruit No.10 possessed maximum TFC (12.00 mg of quer.equl./100 mL) and minimum in fruit No.4 (10.0 mg of quer.equl/100 mL).
TFC were slightly differed in peel as well as juice of fruits (1–10) with an increasing trend in orange color. Citrus fruit during maturing stages possessed different levels of polyphenols (Ferguson et al., Citation1999) and minor difference was detected in TFC of ‘Feutrell’s Early’ fruit during color development stage. TFC were quantified as more in citrus peel than juice, which attained its maximum level in matured fruits (Lattanzio, Citation2003). Deep orange colored fruit (No.10) possessed higher level of TFC, both in peels and juice. Citrus flavonoids include hesperidin (quercetine or rutin), flavonols (quercetin) as well as flavones (tangeritin) and imparted resistance against oxidative pressure and solar radioactivity (UV) injuries. They also act as physiological regulators, chemical messengers, and inhibitors of cell cycle (Galeotti et al., Citation2008). It is typically originated in peel tinctures and changes fruit color expansion to yield yellow or red/orange peel coloration. Citrus polyphenols have antioxidant activity toward free radicals, particularly the flavonoids possessed more ability to capture electrons, block or inhibit and scavenge free radicals (Del-Rio et al., Citation1997). Fruit color (1–10) both in peel and juice possessed same level of flavonoids from dark green to orange color, which suggested neither increase nor decrease in flavonoids during color development stage. More flavonoids in citrus peel enabled fruit resistance against frost hardiness, drought resistance, freezing tolerance, and working as heat accrual (Samanta et al., Citation2011).
Total Flavonols Contents
TFoC are presented in .
Figure 5. Total flavonols contents in Feutrell’s ‘Early peel and juice (1–10).
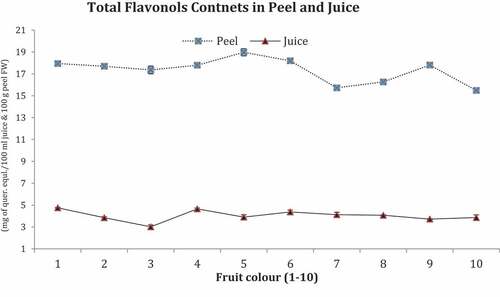
Maximum TFoC were recorded in peels of fruit No.5 (18 mg of quer.eqal./100 mL) and minimum in peel of fruit No.7 and 10 (16 mg of quer.equl/100 mL each) whereas in juice contents non-significant different in TFoC in all fruits. However, maximum TFoC were found in fruit No. 1, 4, 6, and 10 (5.0 mg of quer.equl./100 ml) and minimum in fruit No. 3 (3.0 mg of quer.equl/100 ml).
TFoC showed non-significant differences both in peel and juice of fruits (1–10). In fruit juice, flavonols act as antioxidants and protect ascorbic acid from oxidation stress (Herrmann, Citation1976). Bioavailability of flavonols contents in fruits predisposed by plant growth pattern, seasons, light, and ripening stages (Aherne and O’Brien, Citation2002) but in fruit (1–10) have same level of flavonols both in peel and juice as fruit color based maturity has no influenced on any trend of increasing or decreasing. In plants, flavonols are potential antioxidants to reduce oxidative stress and provided protection against reactive oxygen species (Nakabayashi et al., Citation2014) and more found in citrus peel to protect it against biotic and abiotic stresses.
Total Anthocyanins
Anthocyanins are shown in .
Figure 6. Total Anthocyanins both in peel and juice of fruit color (1–10).
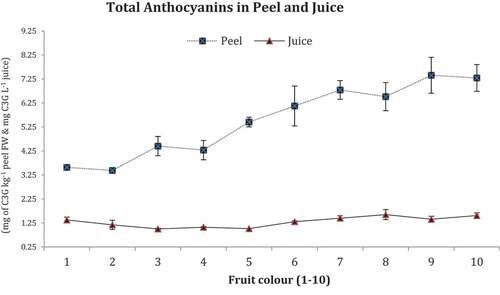
Maximum anthocyanins were documented in peels of deep orange colored fruit No. 10 (7.29 mg C3G kg−1) and minimum in peel of dark green fruit No. 1 (3.57 mg C3G kg−1) whereas in juice contents of fruit No. 10 possessed maximum TFoC (1.56 mg C3GL−1) and minimum in fruit No. 3 (1.0 mg C3GL−1).
Total anthocyanins displayed more substantial mounting trend in dark green color (fruit No. 1) to deep orange color (fruit No.10) whereas slight differences in color change in juice content. Maximum total anthocyanin contents were described in matured fruit (Arakawa et al., Citation1985) as indicated in fully orange colored fruit (No.10) in present findings and more in color fruits like oranges (Lee, Citation2002). Peel has pigments to develop color in citrus fruits with more anthocyanins (Rapisarda et al., Citation2009). Citrus fruit has comparatively fewer anthocyanins level in juice which was further reduced in immature fruit juice. Anthocyanins enriched red/orange and yellow color in fruit outer skin and more recorded in deep orange colored fruits and are grouped in polyphenols and commonly stored in fruit peel, leaves and flowers petals (Winkel-Shirley, Citation2001). In citrus, extra anthocyanins were observed in blood oranges and mandarin fruit peel attained maximum level upon developing full orange or yellow coloring.
Antioxidant Activities
Antioxidant activities are presented in .
Figure 7. Antioxidant activity (Inhibition % of DPPH) in peel and juice (1–10) fruits.
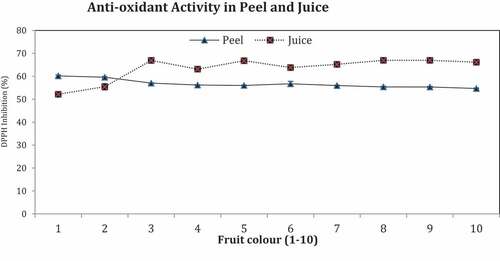
Antioxidant activity (DPPH inhibition) was recorded to be maximum in peel of fruit No. 1 and 2 (60% each) and found as the minimum in fruit No. 8, 9, and 10 (55% each) whereas in juice maximum inhibition percentage was recorded in fruit No. 3, 5, 8, and 9 (67% each) and minimum in fruit No.1 (52%).
Antioxidant has ability to inhibit or prevents oxidation of a substrate. Antioxidant activity (DPPH inhibition %) showed a decreasing trend in peel and rising in juice of ‘Feutrell’s Early’ upon attaining deep orange coloring. Difference in antioxidant activity and polyphenols in citrus fruits due to achieving different maturity index at unalike periods (Webb et al., Citation2007), as were seen in present study of fruits (1–10). Polyphenols in citrus fruit changed during color development (Ferguson et al., Citation1999) and brought changes in antioxidant activities of fruits. Lessening of ascorbic acid during color change as perceived in fruit (1–10) has reduced antioxidant activity. Immature fruits possessed more acidity and ascorbic acid with more antioxidant activity as observed in dark green fruits. Ascorbic acid has positive correlation with antioxidant activity and both were found maximum in dark green color with a reducing trend in orange color. These outcomes were in same link with work of (Gardner et al., Citation2000; Zyaigzne et al., Citation2009; Rekha et al., Citation2012).
Conclusion
Citrus peel coloration is used as an indicator in maturity of fruit in both, at field during harvesting and in market for consumer’s acceptance. More variability in coloration exists in mandarin fruit; and other internal quality parameters are also used to indicate maturation. ‘Feutrell’s Early ’cultivar has a short period of harvesting after maturity but shows more variation in peel color development. In dark green to light green fruits, additional acidity and ascorbic acid contents along with antioxidants were found with a decreasing trend in orange colored fruits. Sugars, soluble solids and TDS showed an increasing trend in orange peel coloring fruits. Polyphenols such as TFC and TFoC were not changed in coloration whereas TPC and anthocyanins were increased in fruits having orange color. Color is thus, a good maturity indicator from sweetness point of view, but of no use regarding assessment of the fruit’s nutritional aspects. Present study findings will be used in future as mandarin maturity indicators, encompassing coloration and internal quality aspects.
Acknowledgments
HEC, Pakistan for awarding PhD fellowship (315-18852-2AV3-109), Agriculture Department, Punjab Government for granting study leave, Department of Horticulture, PMAS-Arid Agriculture University, Rawalpindi for facilitating Laboratory work and Citrus Research Institute Sargodha for providing fruit samples, all of their services/contributions are highly acknowledged.
Related Research Data
References
- Aherne, S.A., and N.M. O’Brien. 2002. Dietary flavonols: Chemistry, food content, and metabolism. Nutrition 18(1):pp.pp.75–81. doi: 10.1016/S0899-9007(01)00695-5.
- Arakawa, O., Y. Hori, and R. Ogata. 1985. Relative effectiveness and interaction of ultraviolet‐B, red and blue light in anthocyanin synthesis of apple fruit. Physiol. Plant 64(3):pp.pp.323–327. doi: 10.1111/ppl.1985.64.issue-3.
- Baldwin, E. 1993. Citrus fruit, p. 107–149.
- Charlotte, P.W., and C. Kathleen. 2013. Essential Biochemistry. 3rd Ed. Wiley. 626. ISBN 978–1118083505
- Cronje, P.J., G.H. Barry, and M. Huysamer. 2013. Canopy position affects pigment expression and accumulation of flavedo carbohydrates of ‘Nules Clementine’mandarin fruit, thereby affecting rind condition. J. Am. Soc. Horticul. Sci. 138(3):pp.217–224.
- Davies, F.S., and L.G. Albrigo. 1994. Fruit quality, harvesting and postharvest technology. In: Davies, F.S., Albrigo, L.G. (Eds.), CropProduction Science in Horticulture. CAB International, pp. 202–224.
- Del-Rio, J.A., B.G. Obdulio, J. Castillo, F.R. Marin, and A. Ortuno. 1997. Uses and properties of citrus flavonoids. J. Agricul. Food Chem. 45(12):4505–4514.
- Ferguson, I., R. Volz, and A. Woolf. 1999. Preharvest factors affecting physiological disorders of fruit and its potential application under Florida packing system. Plant Dis. 89:pp.834–840.
- Galeotti, F., E. Barile, P. Curir, M. Dolci, and V. Lanzotti. 2008. Flavonoids from carnation (Dianthus caryophyllus) and their antifungal activity. Phytochem. Letters 1(1):pp.44–48.
- Gardner, P.T., T.A. White, D.B. McPhail, and G.G. Duthie. 2000. The relative contributions of vitamin C, carotenoids and phenolics to the antioxidant potential of fruit juices. Food Chem. 68(4):pp.471–474.
- Giovannoni, J. 2001. Molecular biology of fruit maturation and ripening. Annu Rev Plant Biol 52(1):pp.725–749.
- Gitelson, A.A., Y. Zur, O.B. Chivkunova, and M.N. Merzlyak. 2002. Assessing carotenoid content in plant leaves with reflectance spectroscopy. Photochem. Photobiol. 75(3):pp.272–281.
- Hardy, S., and G. Sanderson. 2010. A procedural manual for citrus maturity testing. NSW Department of Industry and Investment, Australia.
- Herrmann, K. 1976. Flavonols and flavones in food plants: A review. Int. J. Food Sci. Tech. 11(5):pp.433–448.
- Josse, E.M., A.J. Simkin, J. Gaffé, A.M. Labouré, M. Kuntz, and P. Carol. 2000. A plastid terminal oxidase associated with carotenoid desaturation during chromoplast differentiation. Plant Physiol. 123(4):pp.1427–1436.
- Lado, J., M.J. Rodrigo, and L. Zacarías. 2014. Maturity indicators and citrus fruit quality. Stewart Postharvest Rev 10(2):pp.1–6.
- Lattanzio, V. 2003. Bioactive polyphenols: Their role in quality and storability of fruit and vegetables. J. App. Bot 77(5/6):pp.128–146.
- Lee, H.S. 2002. Characterization of major anthocyanins and the color of red-fleshed budd blood orange (Citrus sinensis). J. Agric. Food Chem. 50(5):pp.1243–1246.
- Lee, J., R.W. Durst, and R.E. Wrolstad. 2005. Determination of total monomeric anthocyanin pigment content of fruit juices, beverages, natural colorants, and wines by the pH differential method: Collaborative study. J AOAC Int 88(5):pp.1269–1278.
- Lichtenthaler, H.K., and A.R. Wellburn. 1983. Determinations of total carotenoids and chlorophylls a and b of leaf extracts in different solvents. Biochem. Soc. Trans 11:591–592.
- Liu, Y., P. Tang, N. Tao, Q. Xu, P. Shu-Ang, X. Deng, K. Xiang, and R. Huang. 2006. Fruit coloration difference between Fengwan, a late-maturing mutant and its original cultivar Fengjie72-1 of navel orange (Citrus sinensis Osbeck). J. Plant Phys. Mol. Bio. 32(1):p.31.
- Mapson, L.W. 1970. In: Hulme, A.C. (Ed.), The Biochemistry of Fruits and Their Products Vol. 1. Academic Press, London, pp.369–384.
- Mesejo, C., G. Gambetta, A. Gravina, A. Martinez‐Fuentes, C. Reig, and M. Agusti. 2012. Relationship between soil temperature and fruit colour development of ‘Clemenpons’ Clementine mandarin (Citrus clementina Hort ex. Tan). J. Sci. Food Agric. 92(3):pp.520–525.
- Miliauskas, G., P.R. Venskutonis, and T.A. Van Beek. 2004. Screening of radical scavenging activity of some medicinal and aromatic plant extracts. Food Chem. 85(2):pp.231–237.
- Mokhtar, S.I., P.C. Leong, L.E. Ven, and N.A.A. Aziz. 2014. Total phenolic contents, antioxidant activities and organic acids composition of three selected fruit extracts at different maturity Stages. J. Trop. Resour. Sustain. Sci. 2:pp.40–46.
- Nakabayashi, R., K. Yonekura‐Sakakibara, K. Urano, M. Suzuki, Y. Yamada, T. Nishizawa, F. Matsuda, M. Kojima, H. Sakakibara, K. Shinozaki, et al. 2014. Enhancement of oxidative and drought tolerance in Arabidopsis by overaccumulation of antioxidant flavonoids. Plant J. 77(3):pp.367–379.
- Nawaz, R., N.A. Abbasi, I.A. Hafiz, and A. Khalid. 2019a. Color-break effect on Kinnow (Citrus nobilis Lour x Citrus deliciosa Tenora) fruit‘s internal quality at early ripening stages under varying environmental conditions. Sci. Hortic. 256:2019) 108514.
- Nawaz, R., N.A. Abbasi, I.A. Hafiz, and A. Khalid. 2019d. Increasing level of abiotic and biotic stress on Kinnow fruit quality at different ecological zones in climate change scenario. Environ. Exp. Bot. 171 (2020). 103936.
- Nawaz, R., N.A. Abbasi, I.A. Hafiz, and A. Khalid. 2020. Impact of climate variables on growth and development of Kinnow fruit (Citrus nobilis Lour x Citrus deliciosa Tenora) grown at different ecological zones under climate change scenario. Sci. Hortic. 260:108868. (online available in October 2019).
- Nawaz, R., N.A. Abbasi, I.A. Hafiz, A. Khalid, and T. Ahmad. 2018. Economic analysis of citrus (Kinnow mandarin) during on-year and off-year in the Punjab Province. Pak. J Hortic 5(250):pp.2376–0354.
- Nawaz, R., N.A. Abbasi, I.A. Hafiz, A. Khalid, and T. Ahmad. 2019c. Impact of climate change on kinnow fruit industry of Pakistan. Agrotechnology 8(186):p.2.
- Nawaz, R., N.A. Abbasi, I.A. Hafiz, Z. Khan, M.R. Khan, and A. Khalid. 2019b. IMPACT OF PEEL COLORATION ON INTERNAL QUALITY OF KINNOW MANDARIN (Citrus nobilis Lour x Citrus deliciosa Tenora) AT EARLY RIPENING STAGE. World J. Bio. Biotech. 4(1):pp.7–17.
- Nongalleima, K., T. Ajungla, and C.B. Singh. 2017. Phytochemical, total phenolic, total flavonoid and total flavonol content estimation in Citrus macroptera Montruz. J. Med. Plants 5(3):pp.114–118.
- Porras, I., J.M. Brotons, A. Conesa, and F.J. Manera. 2014. Influence of temperature and net radiation on the natural degreening process of grapefruit (Citrus paradisi Macf Cultivars Rio Red and Star RubyScientia Horticulturae. 173:pp.45–53.
- Rapisarda, P., S. Fabroni, S. Peterek, G. Russo, and H.P. Mock. 2009. Juice of new citrus hybrids (Citrus clementina Hort. ex Tan.× C. sinensis L. Osbeck) as a source of natural antioxidants. Food Chem. 117(2):pp.212–218.
- Rekha, C., G. Poornima, M. Manasa, V. Abhipsa, J.P. Devi, V.H.T. Kumar, and T.R.P. Kekuda. 2012. Ascorbic acid, total phenol content and antioxidant activity of fresh juices of four ripe and unripe citrus fruits. Chemi. Sci. Trans. 1(2):pp.303–310.
- Rissler, H.M., and B.J. Pogson. 2001. Antisense inhibition of the beta-carotene hydroxylase enzyme in Arabidopsis and the implications for carotenoid accumulation, photoprotection and antenna assembly. Photosyn. Res. 67(1–2):pp.127–137.
- Rokaya, P.R., D.R. Baral, D.M. Gautam, A.K. Shrestha, and K.P. Paudyal. 2016. Effect of altitude and maturity stages on quality attributes of mandarin (Citrus reticulata Blanco). Am. J. Plant Sci. 7(06):p.958.
- Samanta, A., G. Das, and S. Das. 2011. Roles of flavonoids in plants. Int. J. Pharm. Sci. Tech. 6:12–35.
- Simkin, A.J., H. Moreau, M. Kuntz, G. Pagny, C. Lin, S. Tanksley, and J. McCarthy. 2008. An investigation of carotenoid biosynthesis in Coffea canephora and Coffea arabica. J. Plant Physiol. 165(10):pp.1087–1106.
- Sites, J.W., and H.J. Reitz. 1950. The variation in individual Valencia oranges from different locations of the tree as a guide to sampling methods and spot-picking for quality. Part II. Titratable acid and the soluble solids/titratable acid ratio of the juice. Proc Ser. Soc. Hort. Sci 55:pp.73–1.
- Stewart, I., and T.A. Wheaton. 1973. Carotenoids in citrus. In Proceedings of 1st International Citrus Congress. (Vol. 3, pp. 325–330.)
- Sumanta, N., C.I. Haque, J. Nishika, and R. Suprakash. 2014. Spectrophotometric analysis of chlorophylls and carotenoids from commonly grown fern species by using various extracting solvents. Res. J. Chem. Sci. 2231:p.606X.
- Tadeo, F.R., M. Cercos, J.M. Colmenero‐Flores, D.J. Iglesias, M.A. Naranjo, G. Rios, E. Carrera, O. Ruiz‐Rivero, I. Lliso, R. Morillon, et al. 2008. Molecular physiology of development and quality of citrus. Adv. Bot. Res. 47:pp.147–223.
- Thaipong, K., U. Boonprakob, K. Crosby, L. Cisneros-Zevallos, and D.H. Byrne. 2006. Comparison of ABTS, DPPH, FRAP, and ORAC assays for estimating antioxidant activity from guava fruit extracts. J. Food Comp. Analy 19(6–7):pp.669–675.
- Thapa, B.B., and D.M. Gautam. 2002. Preharvest application of gibberellic acid and maturity stages on shelf life of mandarin orange. J. Inst. Agric. Anim. Sci. 23:pp.41–47.
- Thompson, A.K. 2014. Harvest maturity and methods (Chapter 2 and postharvest treatments (Chapter 4). Postharvest technology of fruits and vegetables. Vol. 95. Blackwell Science, pp.35–37.
- Webb, L., P. Whetton, and E.W.R. Barlow. 2007. Modeled impact of future climate change on phenology of wine grapes in Australia. Aus. J. Grape Wine Res. 13:pp. 165–75.
- Winkel-Shirley, B. 2001. Flavonoid biosynthesis: A colorful model for genetics, biochemistry, cell biology, and biotechnology. Plant Physiol. 126:pp. 485–493.
- Young, A., and G. Britton. 1993. Carotenoid in Photosynthesis. 1st. Chapman and Hall, London. p. pp. 498.
- Zyaigzne, G., D. Karklina, D. Seglina, and I. Krasnova. 2009. Antioxidants in various citrus fruit juices. Chemine Technologija. 3(52):pp. 56–61.