
 ?Mathematical formulae have been encoded as MathML and are displayed in this HTML version using MathJax in order to improve their display. Uncheck the box to turn MathJax off. This feature requires Javascript. Click on a formula to zoom.
ABSTRACT
In the present study, morphological traits, organic acids, sugars, total phenols, total flavonoids, total anthocyanins, total anthocyanidins, antioxidant activity and color parameters such as lightness(L*), Chroma (c*) and hue angle (h°) were investigated in 11 local and introduced fig cultivars cultivated in Moroccan climate. Since only limited information on that topic is available in the literature, this study was performed in order to compare local clones with some of introduced varieties based on their morphological and biochemical attributes. Results showed highly significant differences among genotypes. The cultivar ‘Kadota’ had the most promising morphological traits. Reducing sugars levels were slightly similar among all cultivars. Thus, glucose varied from 5.55 ± 0.27 to 29.94 ± 0.81 g.kg−1 dw, while fructose amounts were in the range of 6.23 ± 0.28–28.15 ± 0.78 g.kg−1 dw. ‘Palmera’ exhibited the highest level of Malic acid (4.99 ± 0.2 g.kg−1). The latter was predominant in all cultivars. Total phenols, flavonoids and total anthocyanins were, generally, abundant in dark-colored cultivars, while total proanthocyanidins were dominant in light-colored ones. The local cultivars ‘Fassi’ and ‘Noukali’ contained the highest amounts of total phenols and total anthocyanins, respectively (524.74 ± 35.9mg GAE 100 g−1 dw and 23.77 ± 6.41 cyanidin-3-rutinoside/100 gdw). Free radical scavenging activity (DPPH and ABTS) was, generally, higher in light-colored figs, while, ferric reducing ability (FRAP) was generally higher in dark skin-colored cultivars. The study confirmed the effectiveness of combining morphological and biochemical analyses in fig assessment and its use pre-breeding programs of the species in Morocco.
Introduction
The fig (Ficus carica L.) is one of the oldest known fruit tree species (Flaishman et al., Citation2008). It is whispered to be the first domesticated tree of the Neolithic Revolution, about athousand years before the cereals (Hirst, Citation1996). Fig tree belongs to Moraceae family, which comprises more than 800 species of trees, making the Ficus genus one of the most populous in number of species of all plant genera (Pourghayoumi et al., Citation2017; Veberic and Mikulic-Petkovsek, Citation2016).
Figs are an important crop worldwide due to its increasing international trade, as consumers seek continuously fresh quality products of less familiar fruits and one of the most abundant fruits in the Mediterranean diet for dry and fresh consumption (Viuda-Martos et al., Citation2015; Wojdyło et al., Citation2016).
The Mediterranean is an important center of fig growth from time immemorial (Aljane and Ferchichi, Citation2009). It’s also the main world’s fig production with Turkey as aleader in the world with 269, 064 tons accounting for 26.8% of total world production. The top five producers (in addition to Turkey) include Egypt (201 709 t), Morocco (85 172 t), Algeria (81 768 t) and Iran (71 848 t) combined, supplying almost 70% of the world’s fig market (FAOSTAT, average production between 1994–2017).
Due to its nutritional value and health benefit, the fig importance is likely to continue worldwide (Viuda-Martos et al., Citation2015). It constitutes amajor natural source of bioactive compounds in the health-promoting Mediterranean diet for millennia, since they are among various agroecosystems. They are an excellent source of bioactive compounds that have attracted substantial interest in the last three decades. The fig potential health-promoting properties are related essentially to its high contents in sugar, trace minerals, fibers, vitamins and antioxidant capacity provided mainly by phenolic compounds (Gordon, Citation1996; Halliwell, Citation1996; Feskanich et al., Citation2000; Haegele et al., Citation2000; Michels et al., Citation2000; Eberhardt et al., Citation2000; Sagar and Kumar, Citation2010; Duman et al., Citation2018). Actually, figs contain higher amounts of phenolics than red wine and tea, which are two well-publicized sources of phenolic compounds (Vinson et al., Citation1998).
Northern Morocco, identified in historical sources as afig cultivation area, is still today one of the most important fig cultivation regions (Hssaini et al., Citation2019), which contains alarge number of typical local varieties. In this area, figs are manually harvested at the firm-mature stage, generally, in the period from July to October. Some of the most common cultivars cultured in Morocco are ‘Nabout’, ‘Ghoudan’, ‘El-Quoti Lbied’, ‘Fassi’ and ‘Noukali’. These latter were basically assessed using morphological and molecular markers. However, and to the best of our knowledge, there is no studies yet that included physiobiochemical marker in the assessment of these varieties. Furthermore, there are very few studies in the literature that compare Moroccan clones to international varieties from different geographical localities by combining morphological and physiobiochemical traits.
Hence, this study is acomparative analysis of morphological and primary and secondary compounds in five local clones and six introduced varieties of fig fruit (Ficus carica L.). This work is designed to compare local clones with some of introduced varieties based on their morphological and biochemical attributes that can provide additional information that may be of great importance in fig selection and program breeding.
Materials and Methods
Plant Material
For this study were chosen five local and six introduced cultivars belonging to an ex-situ collection of fig trees (). The genotypes were planted in complete randomized block in the experimental station relevant to the national institute for agricultural research of Meknes (INRA) in the north of Morocco (x = 511600; y = 370250; z = 480m). Fruits were randomly harvested during their maturity period of August–September (). Figs were considered fully ripened when the receptacle had three-fourths reddish-purple coloration and when they were easily separated from the twig. They were picked randomly at different positions around the canopy and at height of 160 cm.
Table 1. Cultivars names and their geographical origins
The whole fruits were cut and frozen at −80°c until lyophilization. Triplicate lots of fig fruits from each genotype were grounded to a powder using an IKA A11 Basic Grinder (St. Louis, MO) at room temperature.
Morphological Assessment
Fig plant samples were assessed using 11 quantitative descriptors established by International Plant Genetic Resources Institute (IPGRI) (International Plant Genetic Resources Institute (IPGRI), Citation2003). The measurements concerned the geometrical traits of fruit, stalk, neck and ostiole and the peel thickness using a digital caliper (Digital Caliper 68,202,ML Tools and Equipment, Burlingame, CA). Fifteen replications per sample were considered. Skin color measurements were obtained from two spots located on opposite sides of the equatorial region of the fruit using an NH310 colorimeter (Shenzhen 3NH Technology, China). The mean of the two measurements was considered as one replicate. Chromatic analysis was carried out following the CIE (Commission International de l’Eclairage) system of 1976. Fifteen replications per sample were considered.
Profile of Sugars and Organic Acids
Procedure Extraction
The samples (0.5 g) were extracted with 5 mL of Milli-Q water by incubation for 30 min under ultra-sonication. Next, the slurry was centrifuged at 15,000 g for 20 min (Sigma 3–18 K; Sigma, Osterode am Harz, Germany), and the supernatant was filtered through a 0.45 µm Millipore filter and used for analysis. All extractions were carried out in triplicate.
Identification of Sugars and Organic Acids
The chromatographic analysis was carried out according to Hernández et al. (Citation2016). Thus, 10 µL of extract were injected into a Hewlett-Packard HPLC Series 1100 (Wilmington DE, USA) with an autosampler and an UV detector, set at 210 nm and coupled with a refractive index detector (HP 1100, G1362A). A column (Supelcogel TM C-610H column 30 cm x 7.8 mm) and apre-column (Supelguard 5cm x4.6mm; Supelco, Bellefonte, PA) were used for the analyses of both organic acids and sugars. The elution buffer consisted of 0.1% phosphoric (V/V) at a flow rate of 0.5mL min−1, and organic acid absorbance was measured at 210 nm using a diode-array detector (DAD). The same HPLC conditions (elution buffer, flow rate, and column) were used for the analysis of sugars. The detection was conducted using a refractive index detector (RID). Standards of organic acids and sugars were obtained from Sigma (St.Louis, MO). Calibration curves were used for the quantification of organic acids and sugars showing good linearity (r2 ≥ 0.999). The results were expressed as g kg−1 of dry weight (dw).
Antioxidant Activity
The antioxidant activity (AA) has been evaluated using methanolic extracts of sample [MeOH/water; 80/20%; v:v; HCl (1% V/V)] with different assays divided into two basic groups depending on the methodology: (i) the free radical scavenging activity was tested by using two assays: DPPH (radical 2,2-diphenyl-1-picrylhydrazyl) (Brand-Williams et al., Citation1995) and ABTS (Re et al., Citation1999) and (ii) the ferric reducing ability (FRAP assay) (Re et al., Citation1999). The AA was expressed as mmol Trolox equivalent/g of dry weight (mmol TE/g dw). The mixtures absorbance was measured, respectively, at 515, 734 and 593 nm using a spectrophotometer (ThermoSpectronic Heγiosγ, England).
Total Polyphenols Analysis
Total polyphenols content (TPC) was determined using Folin-Ciocalteu reagent (Singleton et al., Citation1999). Absorption was measured using a spectrophotometer (ThermoSpectronic Heγios γ, England). TPC was expressed asmg of gallic acid equivalents (GAE) per 100 g of dry weight (dw).
Total Flavonoid Analysis
Total flavonoid content was measured using the colorimetric method with aluminum chloride (Barreira et al., Citation2008). The absorbance was read at 510 nm and results were expressed as (+)-catechin equivalent (CE) per 100 g dw.
Total Anthocyanins Analysis
Total anthocyanin content (TAC) was measured with the pH differential absorbance method as described by Cheng and Breen (Citation1991). Briefly, absorbance of the extract was measured at 520 and 700 nm in buffers at pH 1.0 (hydrochloric acid–potassium chloride, 0.2 M) and pH 4.5 (acetic acid–sodium acetate, 1 M). Results were calculated according to the equation mentioned next and converted to milligrams of cyanidin 3-rutinoside equivalent per 100 g of dry weight.
where A is the is absorbance reading calculated as follow: A = (A520–A700)pH 1.0 − (A520–A700)pH 4.5, MW is the molecular weight of cyanidin 3-rutinoside = 595.5 g/mol and ɛ is the extinction coefficient of cyanidin 3-rutinoside (28840 L.mol–1 .cm–1)
Total Proanthocyanidins Content
Total proanthocyanidin content was determined based on acid hydrolysis and color formation (Porter et al., Citation1985). The mixture absorbance was measured at 540 nm. Results expressed inmg cyaniding equivalent per 100 gusing to the following equation:
where A: absorbance of the extract, MW: molar weight of cyanidin (287 g/mol), DF: dilution factor, ɛ: molar extinction coefficient of cyanidin (34700 L/(mol·cm)), and l – pathlength (cm).
Statistical Analysis
Since we used different measure, data were standardized (µ = 0 and a σ = 1) so they can have a comparable scale. Data analysis was performed using SPSS v22. Analysis of variance was performed to test significant differences among the samples collected. The differences in the content levels of the analyzed primary and secondary metabolites were estimated with Duncan new multiple range (DMRT) test. Canonical correlation was performed to assess the correlation between morphological and biochemical data. Principal component analysis was carried out using correlation matrix to better understand the patterns of variability among the accessions.
Result and Discussion
Ripening Period
The ripening process in fig is, generally, rapid, lasting several days (). In this study, figs were, generally, harvested during August to early September, with significant differences in their ripening periods. Compared to local clones, the introduced varieties had a long harvest time and ripened early. The varieties ‘Snowden’ and ‘Cuello Dama Blanca’ ripened from the first day of August until the last week of the month. Similarly, ripening process of the other introduced varieties ends by the beginning of August; however, it starts 5 days late. Local clones had a very short harvesting period. They reach their ripening stage during the second decade to the last week of August. Only the local cultivar ‘Ghoudan’ lasts to the first week of September. During the harvest time, the average air temperature was about 27°C with important rainfall (26.4 mm) during the last decade of August. Intense solar radiation was observed during the second decade of August and the first decade of September ().
Table 2. Harvest time and monthly meteorological data from August to early September 2017 in Northern Morocco, Meknes (Ain-Taoujdate experimental station-INRA)
Morphological Traits
All variations in the fruit geometrical characteristics were significant at p < .001 level (). The variety ‘Kadota’ had the heaviest fruit (61.53 ± 10.4 g) followed by ‘Breval Blanca’ and ‘Snowden’ which the average weights were, respectively, 46.44 ± 10.7 and 44.03 ± 10.9 g.The latter recorded the highest height and width that were, respectively, in the range of 42.94–25.87 mm and 50.85–31.54 mm. Besides other criteria, the weight is the most important fruit dimension, and fruit prices depend particularly on this (Pérez-Sánchez et al., Citation2016). ‘Fassi’ had the highest fig stalk (10.58 ± 3.5 mm) while ‘kadota’ had the highest stalk width (6.59 ± 1.1 mm). The fruit neck was long in the cultivars ‘Kadota’ (9.17 ± 3.1mm) and ‘Palmeras’ (7.28 ± 0.1 mm) and short in ‘Fassi’ (2.29 ± 3.4 mm) whereas it was absent in others such as ‘Ghoudan’, ‘Nabout’ and ‘Palmeras’. The fruit geometrical traits are important in the fig fresh consumption. Hence, small fruits are, generally, used for canning, whereas big ones are consumed as fresh. Moreover, the fruit reflect the proper maintenance of the tree (Tamboli et al., Citation2015). The ostiole was, generally large in heavy fruits such as ‘Kadota’ and ‘Palmeras’ (7.69 ± 1.2 and 5.81 ± 1.2 mm, respectively). During maturity period, the ostiole provides entry for fungal decay and moisture loss. It also provides an entryway for insects that vector diseases such as endosepsis that spread to healthy fruits (Michailides and Morgan, Citation1998; Crisosto et al., Citation2011). ‘Breval Blanca’ and ‘Nabout’ had the thick-skinned fruit which the average values were, respectively, 8.35 ± 1.5 and 5.91 ± 1 mm. Overall, the inventory of plant material based on morphological traits is important for managing genetic resources, maintaining the existing genetic variability, and establishing agermplasm collection (Podgornik et al., Citation2010). Authors stress the relevance of morphological assessment in the selection and breeding programs of cultivars, and claim such analysis should be performed before biochemical or molecular studies are carried out (Djordjević et al., Citation2014; Khadivi et al., Citation2018; Khadivi-Khub et al., Citation2012; Podgornik et al., Citation2010).
Table 3. Morphological traits of fig cultivars (Mean ± SD)
Skin Color
The fig skin color showed a high significant variability among cultivars (). The cultivars ‘Palmeras’, ‘Breval Blanca’ and ‘Nabout’ had the lightest colored figs which the chromatic coordinates L* and c* were higher than other cultivars. The hue angle (h°) was generally lower than 4° in the dark-colored cultivars ‘Ghoudan’, ‘Noukali’ and ‘snowden’, while it was in the range 95.72 ± 9–115.7 ° ±15.4 for the light-colored cultivars. The fig skin color is the most visual parameter that growers and consumers use to test the quality and optimum stage of maturity in fresh figs (Pérez-Sánchez et al., Citation2016). In fact, the variation in fig skin color is dependent on the antioxidant compounds and their amounts, particularly anthocyanins which were found to be the predominant pigments in figs (Kuś et al., Citation2014). Therefore, skin color evaluation using these coordinates is of great importance in fig quality assessment. Several studies highlighted the importance of these descriptors by exploring potential correlations between color coordinates and antioxidant compounds (Rodov et al., Citation2012; Sedaghat and Rahemi, Citation2018; Viuda-Martos et al., Citation2015).
Figure 1. Box and whisker plot of fig skin chromatic coordinates of studied cultivars (L*: lightness; c*: Chroma; h°: Hue angle). Breval B: ’Breval Blanca’; CDB: ‘Cuello Dama Blanca’; EQL PS20: ‘El Quoti Lbied PS20ʹ; White A: ‘White Adriatic’
Sugar Content
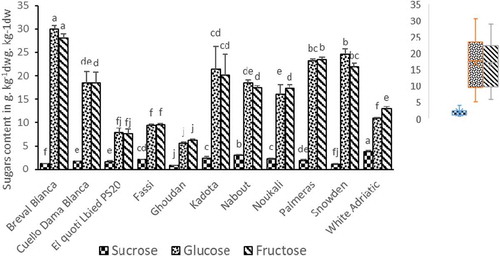
Individual sugars amount in the whole figs are shown in . Glucose and fructose levels in all cultivars were important and very close, while, only minor concentrations of sucrose were detected. The glucose varied between 5.55 ± 0.27 g.kg−1dw (‘Ghoudan’) and 29.94 ± 0.81 g.kg−1dw (‘Breval Blanca’). For fructose, values varied sensitively among varieties from 6.23 ± 0.28 g.kg−1 dw (“Ghoudan”) to 28.15 ± 0.78 g.kg−1 dw (“Breval Blanca”). In general, glucose levels were slightly higher than fructose levels in figs. Nevertheless, there were varieties such as ‘Fassi’, ‘Ghoudan’, ‘Noukali’, ‘Palmeras’ and ‘White Adriatic’ that showed fructose levels higher than glucose (). These results showed the variet al influence on the glucose/fructose ratio in figs. This aspect is of great importance since fructose is 80% sweeter than sucrose (Wojdyło et al., Citation2016). Therefore, a lower glucose/fructose ratio indicates higher sweetness of the fruit. The results are in agreement with those of Wojdyło et al. (Citation2016) and Veberic and Mikulic-Petkovsek (Citation2016). The minor amounts in sucrose are probably due to anabolic processes and respiration during fruit development. They might also be relevant to the hydrolysis of sucrose into fructose and glucose during fruit ripening (Melgarejo et al., Citation2003; Vemmos et al., Citation2013). Generally, the amounts of sugars in fig are comparable to those detected in some other fruits, such as apples and strawberries (Veberic and Mikulic-Petkovsek, Citation2016).
Figure 2. Content levels of individual sugars (g.kg−1dw) in whole fruit of 11fig cultivars. Average values ± standard deviation are presented statistically significant differences (p < .05) among cultivars are presented over error bars (a-j). Box and whisker plots were used to show the distribution of adata set
Organic Acids
Malic acid was the predominant organic acid in all samples and recorded high levels compared to citric acid (). The cultivar “Palmeras” exhibited the highest value of malic acid (4.99 ± 0.2 g.kg-1), followed by “White Adriatic”, “Cuello Dama Blanca” and “Breval Blanca” which on average contained, respectively, 3.74 ± 0.14, 2.6 ± 0.3 and 2.55 ± 0.04 g.kg−1 dw. Citric acids ranged from 1 ± 0.02 (“White Adriatic”) to 0,31 ± 0,04 (“El Quoti Lbied PS20”) (). Overall, organic acids, were lower in dark-colored fig cultivars. The findings are in agreements with results reported by Colaric et al. (Citation2005) and Pereira et al. (Citation2017). According to the same authors, malic and citric acid have been identified as the major organic acids in figs. Notwithstanding, succinic, fumaric, shikimic, and oxalic acids have been also detected but in minor amounts. In addition to sugars; fruit sweetness is also correlated to organic acids. Even in minor amounts, the latter can influence the taste of fruit and decrease indeed their sweetness (Colaric et al., Citation2005). Compared to some fruits, such as sweet cherries, peaches or apricots, the amounts of citric and malic acids in figs are generally lower (Colaric et al., Citation2005; Kafkas et al., Citation2007; Serradilla et al., Citation2011).
Figure 3. Organic acids content (g kg−1) of the whole fruits in 11 fig cultivars. Average values ± standard deviation are presented statistically significant differences (P < .05) among cultivars are presented over error bars (a-f). Box and whisker plots were used to show the distribution of adata set
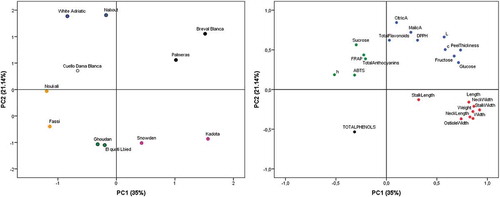
Figure 4. Loading plot and score plot after principal component analysis of the variables and individuals in the plane by two first principal components ((PC1 and PC2) with atotal variance of 56.14%). Each group was presented in different colors
Phenolic Compounds
Phenolic compounds were expressed on adried weight basis and revealed highly significant variability among accessions (p < .05) (). All studied cultivars exhibited important level of total phenols (TP). However, TP was higher in dark-colored fig cultivars that are ‘Fassi’ (524.74 ± 35.9 mg GAE/100 g dw), ‘Noukali’ (478.64 ± 76.12 mg GAE/100 g dw) and ‘Snowden’ (42.52 ± 69.98 9mg GAE/100 gdw). Total flavonoids (TF) varied from 14.59 ± 7.6 (‘White Adriatic’) to 83.71 ± 10.5 mg CE/100 g dw (‘Kadota’) with an average of 37.71 ± 4.9mg CE/100 g dw. Generally, TF were slightly higher in light-colored figs. Flavonoids are one of the major groups of fig fruits polyphenols. They are commonly classified as “environmental compounds’’ because they are often produced in direct response to environmental conditions (Wojdyło et al., Citation2016). TP and TF results were similar to those reported in previous works (Çalişkan and Polat, Citation2012; Harzallah et al., Citation2016; Wojdyło et al., Citation2016). With the exception of ‘Breval Blanca’ and ‘White Adriatic’ (24.8 ± 2.48 and 19.63 ± 3.93mg cyanidin-3-rutinoside eq/100g dw, respectively), total anthocyanins were higher in dark-colored figs such as ‘Noukali’ (23.77 ± 6.41mg cyanidin-3-rutinoside eq/100 g dw), ‘Fassi’ (14.88 ± 5.37 mg cyanidin-3-rutinoside eq/100 g dw) and ‘Ghoudan’ (11.16 ± 7.03 mg cyanidin-3-rutinoside eq/100g dw). On the other hand, minor levels of total proanthocyanidins (TPA) were detected in samples and were in the range of 0.82 ± 0.5–6.64 ± 1.9 cyaniding eq/100g dw. Overall, TPA are slightly higher in light-colored figs. The results were higher than those reported in red wine and tea (Aljane and Ferchichi, Citation2009). However, they were close to those found in strawberry (Häkkinen et al., Citation1999), apricots, peaches (Tomás-Barberán et al., Citation2013), apple and persimmon (Veberic et al., Citation2008). The results are comparable with those reported in previous works (Gu et al., Citation2004; Kamiloglu and Capanoglu, Citation2013).
Table 4. Phenolic compounds (Total phenols, flavonoids, anthocyanins, and total proanthocyanidins) of studied cultivars
Antioxidant Activity
Results of antioxidant activity (AA) showed a highly significant variability (p < .001) among cultivars regarding the three essays (). The free radical scavenging activity (FRSA) based on DPPH essay showed an important AA. Thus, the highest values were recorded by ‘Nabout’ (88.1 ± 3.37 mmol TE/g dw) and ‘Breval Blanca’ (83.16 ± 6.93 mmol TE/g dw), while ‘El Quoti Lbied’ and “Snowden” exhibited the lowest values (14.28 ± 1.42 and14.76 ± 1.61 mmol TE/g dw respectively) (). In ABTS essay, the cultivar “Noukali” (8.04 ± 0.3 mmol TE/g dw) showed the highest FRSA, followed by “Breval Blanca” and “Fassi” (6.41 ± 0.66 and 5.96 ± 0.52 mmol TE/g dw, respectively). Minors concentrations were exhibited by the cultivars ‘Palmeras’, ‘Snowden’ and ‘Ghoudan’, which the average values did not exceed 1.8 mmol TE/g dw. The FRSA based on DPPH and ABTS essays was higher in light-colored fig cultivars (). In the other hand, with the exception of the cultivar ‘Nabout’ (10.65 ± 0.18 TE/g dw), the ferric reducing was higher in dark-colored cultivars such as ‘Noukali’ and ‘Fassi’ which the average values were, respectively, 7.44 ± 2.2 and 6.06 ± 0.9 mmol TE/g dw. However, the lowest ferric reducing ability was recorded by the cultivars “El Quoti Lbied” and “White Adriatic” (1.09 ± 0.04 and 1.97 ± 0.88 mmol TE/g dw respectively) (). The results are consistent with those of Solomon et al. (Citation2006), Ercisli et al. (Citation2012) and Veberic and Mikulic-Petkovsek (Citation2016). However, free radical scavenging activity (DPPH) levels were higher than those described in similar studies (Ercisli et al., Citation2012; Pande and Akoh, Citation2010; Slatnar et al., Citation2011; Veberic et al., Citation2008). Generally, the findings confirm those have proven that fig phytochemicals can affect processes that alter the development of tumor cells because its high antioxidant capacity (Vinson et al., Citation2005).
Table 5. Free radical scavenging activity (DPPH and ABTS) and ferric reducing ability (FRAP) (mean ±SE in mmol TE/g dw) of studied cultivars
Correlation between Biochemical and Morphological Traits
The biochemical constituent data (set 1), and morphological traits data (set 2) were analyzed via Canonical Correlation analysis (CCA). The method allows to examine the highest correlation possible between two data sets. The full model is statistically significant with a Wilk’s λ = 0.065 and p < .0001 (). Therefore, by rejecting the null hypothesis supposing that the first set of variables is independent from thesecond set of variables, we conclude that there was probably arelationship between biochemical and morphological variables. Furthermore, the Wilk’s λ was very small, which means that the proportion of variance shared between the two sets of variables and across all canonical functions is 1- λ = 93.5%. Therefore, the full model is statistically significant and has what may be considered a very large size effect. reveals that the relationship between biochemical and morphological markers is largely captured by the first three variates that explained 89.63% of the variance within the functions (). Looking for the function 1 coefficients, we see that relevant biochemical compounds were the organic acid, FRSA (ABTS), total anthocyanins, fructose and the chromatic coordinates lightness (L*) and Chroma (c*). While the fruit weight, length, width, neck dimension, and stalk width were the most contributor in the morphological traits (). Indeed, combining biochemical and morphological characters, was worthy, since it can provide information on variables that are potentially important in assessing fig genotypes. Significant and strong correlated traits can be used to predict other ones and could be considered of importance for characterization and the discrimination and of fig genotypes.
Table 6. Analysis of variance (Wilk’s test) and canonical correlations of biochemical components and morphological traits. The highest ones are in bold
Table 7. Canonical variates and related statistics
Principal Component Analysis
Principal components analysis (PCA) was performed on all variables studied in order to assess and distinguish each of the eleven cultivars (Fig.4). The results presented herein showed that fruit geometrical traits, glucose, fructose and FRSA (ABTS and FRAP) were explained by the first principal component (PC1) of the PCA, which accounted for 35% of the total variance. In the other hand, organic acids, Chroma (c*), the hue angle (h°), DPPH essay, lightness coordinate (L*), sucrose and total phenols, flavonoid and total anthocyanins were explained by the second principal component (PC2) that accounted about 21% of total inertia. The cultivars ‘Breval Blanca’ and ‘Palmeras’ had the brightest skin color and were descrimated, particularly, for their high amounts of Glucose, Fructose and total flavonoids. The latter may be recommended for jam transformation. ‘Kadota’ and ‘Snowden’ were mainly characterized by their fruit’s morphological traits. Particularly, ‘Kadota’ had the most important fruit geometrical attributes. However, these cultivars were negatively correlated to FRSA based on ABTS and FRAP essays and sucrose. The cultivars ‘Noukali’, ‘Fassi’, ‘Ghoudan’ and ‘El Quoti Lbied PS20ʹ were clustered in the same group based on their high amounts of total phenols. They can be particularly suggested for nutraceutical usage. ‘White Adriatic’ and ‘Nabout’ were particularly clustered based mainly on their high content of organic acids, sucrose, and total anthocyanins. The cultivar ‘Cuello Dama Blanca’ was closed to ‘White Adriatic’, ‘Nabout’ and ‘Noukali’, since they all had no fruit neck. They may be used for canning, whereas big ones like ‘Kadota’ may recommended for fresh consumption. However, he had a typical profile as he exhibited average values in almost all analysis ().
Conclusion
In the past decades, strong attention has been given to the combination of several descriptors of interest as an important quality parameter in fig selection. Morphological and biochemical traits seem to have attracted aparticular substantial interest, since some of them can be used to predict each other based on correlations between them. Selected fig cultivars in this study showed relatively important traits regarding the fig morphological and biochemical quality and the varietal effect. Morphological analysis revealed a high significant diversity within cultivars. The Italian variety ‘Kadota’ showed the highest fruit geometrical traits. In all cultivars, malic acid was predominant compared to citric acids. Fructose and glucose contents were slightly similar in all samples. Nevertheless, glucose was higher in some cultivars while fructose was abundant in others. Only minor amounts of sucrose were detected. Total phenols, flavonoids, and total anthocyanins were higher in dark-colored genotypes, while total proanthocyanidins were abundant in light-colored ones. Free radical scavenging using DPPH essay exhibited the highest antioxidant activity. The latter was also significantly important in light-colored figs. The multivariate analysis revealed five groups with couple cultivars in each. The genotype ‘Cuello Dama Blanca’ was typical distinguished from others, because of its particulars profile, since it exhibited average levels in almost all analysis. Organic acids, fructose, lightness (L), Chroma (c*) and free radical scavenging activity based on ABTS essay were the most relevant descriptors in biochemical analysis. On the other hand, fruit weight, sizes and stalk, and neck dimensions were highly discriminant in morphological analysis. These descriptors captured a high level a total variance within cultivars. Furthermore, their combination was confirmed to be significant and may have a large size effect in fig germplasm assessment. Therefore, they can be suggested as a powerful approach in fig selection. This work is a significant contribution in the selection of highly discriminant variables to optimize resources for a multivariate assessment of fig germplasm. It also confirmed the effectiveness of combining both morphological and biochemical descriptors in fig assessment.
Author’s contribution
Lahcen Hssaini designed the research, collected samples analyzed and interpreted the data and wrote the manuscript Jamal Charafi and Hafida Hanine provided the technical support for designing and conducting research as well as supervised the whole research process. Francisca Hernández performed the biochemical analyses. Rachid Razouk, Marie‐Laure Fauconnier and Said Ennahli performed the review and the statistical analysis.
Declaration of Interest
Declare conflicts of interest or state “The authors declare no conflict of interest”.
References
- Aljane, F., and A. Ferchichi. 2009. Assessment of genetic diversity among some southern Tunisian fig (Ficus carica L.) cultivars based on morphological descriptors. Jrd J. Agric. Sci. 5(1):1–16.
- Barreira, J.C., I.C.Ferreira, M.B.P. Oliveira, and J.A. Pereira. 2008. Antioxidant activities of the extracts from chestnut flower, leaf, skins and fruit. Food Chem. 107(3):1106–1113. doi: 10.1016/j.foodchem.2007.09.030.
- Brand-Williams, W., M.E. Cuvelier, and C.L. Berset. 1995. Use of afree radical method to evaluate antioxidant activity. Food Sci. Technol. (NY). 28(1):25–30.
- Çalişkan, O., and A.A. Polat. 2012. Morphological diversity among fig (Ficus carica L.) accessions sampled from the Eastern Mediterranean Region of Turkey. Turk. J.Agric. For. 36(2):179–193.
- Cheng, G.W., and P.J. Breen. 1991. Activity of phenylalanine ammonia-lyase (PAL) and concentrations of anthocyanins and phenolics in developing strawberry fruit. J.Am. Soc. Hortic. Sci. 116(5):865–869. doi: 10.21273/JASHS.116.5.865.
- Colaric, M., R. Veberic, F. Stampar, and M. Hudina. 2005. Evaluation of peach and nectarine fruit quality and correlations between sensory and chemical attributes. J.Sci. Food Agric. 85(15):2611–2616. doi: 10.1002/(ISSN)1097-0010.
- Crisosto, C.H., V. Bremer, and E. Stover. 2011. Fig (Ficus carica L.), p. 134–158. In: E. E. Yahia, (ed.). Postharvest Biology, and Technology of Tropical and Subtropical Fruits. Vol. 3, Cocona to Mango, Woodhead Publishing, Cambridge, UK
- Djordjević, B., V. Rakonjac, M.F. Akšić, K. Šavikin, and T. Vulić. 2014. Pomological and biochemical characterization of European currant berry (Ribes sp.) cultivars. Sci. Hortic. 165:156–162. doi: 10.1016/j.scienta.2013.11.014.
- Duman, E., M. Şimşek, and M.M. Özcan. 2018. Monitoring of composition and antimicrobial activity of fig (Ficus carica L.) fruit and seed oil. J.Agric. Processes Techol. 24(2):75–80.
- Eberhardt, M.V., C.Y. Lee, and R.H. Liu. 2000. Antioxidant activity of fresh apples. Nature 405:903–904.
- Ercisli, S., M. Tosun, H. Karlidag, A. Dzubur, S. Hadziabulic, and Y. Aliman. 2012. Color and antioxidant characteristics of some fresh fig (Ficus carica L.) genotypes from Northeastern Turkey. Plant Foods Hum. Nutr. 67(3):271–276. doi: 10.1007/s11130-012-0292-2.
- FAO. 2017. Food and Agriculture Organization. Retrieved from http://faostat3.fao.org/browse/Q/QC/E.
- Feskanich, D., R. G. Ziegler, D. S. Michaud, E. L. Giovannucci, F. E. Speizer, W. C. Willett, and G. A. Colditz. 2000. Prospective study of fruit and vegetable consumption and risk of lung cancer among men and women. J. Natl. Cancer Inst. 92:1812–1823.
- Flaishman, M.A., V. Rodov, and E. Stover. 2008. The fig: Botany, horticulture, and breeding. Horticultural Reviews-Westport Then NewYork. Hortic. Rev 34:113.
- Gordon, M. H. 1996. Dietary antioxidants in disease prevention. Nat. Prod. Rep. 13(4):265–273.
- Gu, L., M.A. Kelm, J.F. Hammerstone, G. Beecher, J. Holden, D. Haytowitz, D. Haytowitz, S. Gebhard, and R.L. Prior. 2004. Concentrations of proanthocyanidins in common foods and estimations of normal consumption. J.Nutr. 134(3):613–617. doi: 10.1093/jn/134.3.613.
- Haegele, A.D., C. Gillette, C. O’Neill, P. Wolfe, J. Heimendinger, S. Sedlacek, and H.J. Thompson. 2000. Plasma xanthophyll carotenoids correlate inversely with indices of oxidative DNA damage and lipid peroxidation. Cancer Epidemiol. Prev. Biomarkers. 9(4):421–425.
- Häkkinen, S., M. Heinonen, S. Kärenlampi, H. Mykkänen, J. Ruuskanen, and R. Törrönen. 1999. Screening of selected flavonoids and phenolic acids in 19 berries. Food Res. Int. 32(5):345–353. doi: 10.1016/S0963-9969(99)00095-2.
- Halliwell, B. 1996. Antioxidants in human health and disease. Annu. Rev. Nutr. 16(1):33–50. doi: 10.1146/annurev.nu.16.070196.000341.
- Harzallah, A., A.M. Bhouri, Z. Amri, H. Soltana, and H. Hammami. 2016. Phytochemical content and antioxidant activity of different fruit parts juices of three figs (Ficus carica L.) varieties grown in Tunisia. Indian Crops Prd. 83:255–267. doi: 10.1016/j.indcrop.2015.12.043.
- Hernández, F., L. Noguera‐Artiaga, F. Burló, A. Wojdyło, A.A. Carbonell‐Barrachina, and P. Legua. 2016. Physico‐chemical, nutritional, and volatile composition and sensory profile of Spanish jujube (Ziziphus jujuba Mill.) fruits. J.Sci. Food Agric. 96(8):2682–2691. doi: 10.1002/jsfa.7386.
- Hirst, K., 1996. Fig trees and archaeology. The history of the domestication of fig trees. About.com Archaeology. http://archaeology.about.com/od/domestications/a/fig_ trees.htm
- Hssaini, L., H. Hanine, R. Razouk, S. Ennahli, A. Mekaoui, and J. Charafi. 2019. Characterization of local fig clones (Ficus carica L.) collected in Northern Morocco. Fruits 74(2):55–64. doi: 10.17660/th2019/74.2.1.
- International Plant Genetic Resources Institute (IPGRI). 2003. Descriptors for fig (Ficus carica L.). IPGRI, Rome.
- Kafkas, E., M. Koşar, S. Paydaş, S. Kafkas, and K.H.C. Başer. 2007. Quality characteristics of strawberry genotypes at different maturation stages. Food Chem. 100(3):1229–1236. doi: 10.1016/j.foodchem.2005.12.005.
- Kamiloglu, S., and E. Capanoglu. 2013. Investigating the invitro bioaccessibility of polyphenols in fresh and sun‐dried figs (F icus carica L.). Int. J.Food Sci. Nutr. 48(12):2621–2629.
- Khadivi, A., R. Anjam, and K. Anjam. 2018. Morphological and pomological characterization of edible fig (Ficus carica L.) to select the superior trees. Sci. Hortic. 238:66–74. doi: 10.1016/j.scienta.2018.04.031.
- Khadivi-Khub, A., Z. Zamani, and M.R. Fatahi. 2012. Multivariate analysis of Prunus subgen. Cerasus germplasm in Iran using morphological variables. Genet. Resour. Crop Evol. 59(5):909–926. doi: 10.1007/s10722-011-9733-2.
- Kuś, P.M., F. Congiu, D. Teper, Z. Sroka, I. Jerković, and C.I.G. Tuberoso. 2014. Antioxidant activity, color characteristics, total phenol content and general HPLC fingerprints of six Polish unifloral honey types. Food Sci. Technol. 55(1):124–130.
- Melgarejo, P., F. Hernandez, J.J. Martinez, J. Sánchez, and D.M. Salazar. 2003. Organic acids and sugars from first andsecond crop fig juices. Acta Hortic. 605:237–239.
- Michailides, T.J., and D.P.P. Morgan. 1998. Spread of endosepsis in Calimyrna fig orchards. Phytopathology. 88(7):637–647. doi: 10.1094/PHYTO.1998.88.7.637.
- Michels, K. B., E. Giovannucci, K. J. Joshipura, B. A. Rosner, M. J. Stampfer, C. S. Fuchs, G. A. Colditz, F. E. Speizer, and W. C. Willett. 2000. Prospective study of fruit and vegetable con- sumption and incidence of colon and rectal cancers. J. Natl. Cancer Inst. 92:1740–1752.
- Pande, G., and C.C. Akoh. 2010. Organic acids, antioxidant capacity, phenolic content and lipid characterisation of Georgia-grown underutilized fruit crops. Food Chem. 120(4):1067–1075. doi: 10.1016/j.foodchem.2009.11.054.
- Pereira, C., M. López Corrales, A. Martín, M.D.C. Villalobos, M.D.G. Córdoba, and M.J. Serradilla. 2017. Physicochemical and nutritional characterization of brebas for fresh consumption from nine fig varieties (Ficus carica L.) grown in Extremadura (Spain). J.Food Qual. doi:10.1155/2017/6302109.
- Pérez-Sánchez, R., M.R. Morales-Corts, and M.A. Gómez-Sánchez. 2016. Agromorphological diversity of traditional fig cultivars grown in centralwestern Spain. Genetika. 48(2):533–546. doi: 10.2298/GENSR1602533P.
- Podgornik, M., I. Vuk, I. Vrhovnik, and D. Mavsar. 2010. Asurvey and morphological evaluation of fig (Ficus carica L.) genetic resources from Slovenia. Sci. Hortic. 125(3):380–389. doi: 10.1016/j.scienta.2010.04.030.
- Porter, L.J., L.N. Hrstich, and B.G. Chan. 1985. The conversion of procyanidins and prodelphinidins to cyanidin and delphinidin. Phytochemistry 25(1):223–230. doi: 10.1016/S0031-9422(00)94533-3.
- Pourghayoumi, M., D. Bakhshi, M. Rahemi, A. Noroozisharaf, M. Jafari, M. Salehi, R. Chamane, and F. Hernandez. 2017. Phytochemical attributes of some dried fig (Ficus carica L.) fruit cultivars grown in Iran. Agric. Conspec. Sci 81(3):161–166.
- Re, R., N. Pellegrini, A. Proteggente, A. Pannala, M. Yang, and C. Rice-Evans. 1999. Antioxidant activity applying an improved ABTS radical cation decolorization assay. Free Radic. Biol. Med. 26(9–10):1231–1237. doi: 10.1016/S0891-5849(98)00315-3.
- Rodov, V., Y. Vinokur, and B. Horev. 2012. Brief postharvest exposure to pulsed light stimulates coloration and anthocyanin accumulation in fig fruit (Ficus Carica L.). Postharvest Biol. Technol. 68:43–46.
- Sagar, V.R., and P.S. Kumar. 2010. Recent advances in drying and dehydration of fruits and vegetables: A review. J.Food Sci. Technol. 47(1):15–26. doi: 10.1007/s13197-010-0010-8.
- Sedaghat, S., and M. Rahemi. 2018. Effects of physio-chemical changes during fruit development on nutritional quality of fig (Ficus carica L.var.‘Sabz’) under rain-fed condition. Sci. Hortic. 237:44–50. doi: 10.1016/j.scienta.2018.04.003.
- Serradilla, M.J., M. Lozano, M.J. Bernalte, M.C. Ayuso, M. López-Corrales, and D. González-Gómez. 2011. Physicochemical and bioactive properties evolution during ripening of ‘Ambrunés’ sweet cherry cultivar. J.Food Sci. Technol. 44(1):199–205.
- Singleton, V. L., R. Orthofer, and R. M. Lamuela-Raventos. 1999. analysis of total phenols and other oxidation substrates and antioxidants by means of folin-ciocalteu reagent. Methods Enzymol 299:152–178.
- Slatnar, A., U. Klancar, F. Stampar, and R. Veberic. 2011. Effect of drying of figs (Ficus carica L.) on the contents of sugars, organic acids, and phenolic compounds. J.Agric. Food Chem. 59(21):11696–11702. doi: 10.1021/jf202707y.
- Solomon, A., S. Golubowicz, Z. Yablowicz, S. Grossman, M. Bergman, H.E. Gottlieb, A. Altman, Z. Kerem, and M.A. Flaishman. 2006. Antioxidant activities and anthocyanin content of fresh fruits of common fig (Ficus carica L.). J.Agric. Food Chem. 54(20):7717–7723. doi: 10.1021/jf060497h.
- Tamboli, B.D., D.D. Sawale, P.B. Jagtap, R.U. Nimbalkar, and S.R. Teke. 2015. Effect of micronutrients on yield and fruit quality of fig on Inceptisol. Indian J.Hort. 72(3):419–422. doi: 10.5958/0974-0112.2015.00082.1.
- Tomás-Barberán, FA, D Ruiz, and D Valero, Rivera D, Obón C, Sánchez-Roca C, Gil MI. 2013. Health Benefits from Pomegranates and Stone Fruit, Including Plums, Peaches, Apricots and Cherries, p. 125–167. In: M. Skinner, D. Hunter (eds.). Bioactives in Fruit: Health Benefits and Functional Foods. John Wiley & Sons, Ltd, Oxford, UK
- Veberic, R., M. Colaric, and F. Stampar. 2008. Phenolic acids and flavonoids of fig fruit (Ficus carica L.) in the northern Mediterranean region. Food Chem. 106(1):153–157. doi: 10.1016/j.foodchem.2007.05.061.
- Veberic, R., and M. Mikulic-Petkovsek. 2016. Phytochemical composition of common fig (Ficus carica L.) cultivars, p. 235–255. In: M.S.J. Simmonds, V.R. Preedy, (eds.). Nutritional composition of fruit cultivars. 1st ed. American Press, London, UK.
- Vemmos, S.N., E. Petri, and V. Stournaras. 2013. Seasonal changes in photosynthetic activity and carbohydrate content in leaves and fruit of three fig cultivars (Ficus carica L.). Sci. Hortic. 160:198–207. doi: 10.1016/j.scienta.2013.05.036.
- Vinson, J.A., L. Zubik, P. Bose, N. Samman, and J. Proch. 2005. Dried fruits: Excellent invitro and invivo antioxidants. J.Am. Coll. Nutr. 24(1):44–50. doi: 10.1080/07315724.2005.10719442.
- Vinson, J.A., Y. Hao, X. Su, and L. Zubik. 1998. Phenol antioxidant quantity and quality in foods: Vegetables. J.Agric. Food Chem. 46(9):3630–3634. doi: 10.1021/jf980295o.
- Viuda-Martos, M., X. Barber, J.A. Perez-Alvarez, and J. Fernandez-Lopez. 2015. Assessment of chemical, physico-chemical, techno-functional and antioxidant properties of fig (Ficus carica L.) powder co-products. Ind. Crop. Prod. 69:472–479. doi: 10.1016/j.indcrop.2015.03.005.
- Wojdyło, A., P. Nowicka, A.A. Carbonell-Barrachina, and F. Hernández. 2016. Phenolic compounds, antioxidant and antidiabetic activity of different cultivars of Ficus carica L. fruits. J.Func. Foods. 25:421–432. doi: 10.1016/j.jff.2016.06.015.
- Yahia, E.M. 2011. Postharvest biology and technology of tropical and subtropical fruits, p. 260–266. Cocoa to mango. Vol. 3. Woolhead Publishing Limited, Cambridge CB22 3HJ, UK.