
 ?Mathematical formulae have been encoded as MathML and are displayed in this HTML version using MathJax in order to improve their display. Uncheck the box to turn MathJax off. This feature requires Javascript. Click on a formula to zoom.
ABSTRACT
Drying of plums to prunes is an important postharvest processing step, as it results in a product with higher nutrient density, increased shelf life, and significantly greater antioxidant and fiber content. However, due to the waxy layer present on the plums surface having low permeability toward moisture, plum dries very slowly which is an energy-demanding process. Therefore, to breakdown waxy layer on the surface and enhancement of skin moisture diffusivity, two genotypes (V91074 and V95141) of Yellow European Plums (YEPs) were dipped in 1% (w/v) of Ascorbic Acid (AA), Citric Acid (CA), and Potassium Meta-bisulfite (KMS) solution for 1 min at 40°C. The pretreated YEPs were dried at three different temperatures (50°C, 60°C, and 70°C) until a final moisture content of approximately 30% (wet basis) was reached. It was observed that treated samples (AA and KMS) dried faster as compared to untreated samples, except for CA treatment where no significant difference in drying time was observed. One model cannot be selected for describing the thin layer drying characteristics of YEPs. Five out of 11 models used were found to be a perfect fit for genotype V91074 and genotype V95141, respectively. Pretreatment had a significant effect on effective moisture diffusivity (Deff). Deff for untreated and treated plum samples ranged between 4.6 × 10⁻¹¹ to 8.6 × 10⁻¹¹ (m2/s) and 4.9 × 10⁻¹¹ to 9.1 × 10⁻¹¹ (m2/s). The drying temperature had a significant effect on phenolic content and antioxidant activity, whereas no significant effect of pretreatment was observed.
Introduction
Consumption of fruits and vegetables (F&Vs) not only promotes health but also protects humans from various chronic diseases such as cancer, neurological, and cardiovascular disorders (Choi et al., Citation2007). F&Vs exhibit these health beneficial effects due to the presence of various bioactive compounds such as vitamins, minerals, fibers antioxidants, and polyphenols (Spada et al., Citation2008). Specifically, European plums (Prunus domestica L.) are categorized as functional food or nutraceutical, as they are rich in carbohydrates, vitamins such as A, B1, B,2 and C, calcium, magnesium, iron, and potassium, while they are also low in fat and calorie. Although plums are rich in nutraceuticals and bioactive compounds, these fruits have a shorter shelf-life, limiting their market availability. Due to their high moisture content (≥80% wet basis (w.b.)), plums are considered highly perishable commodities, making them more susceptible to physical, chemical, and microbial damage (Dowling, Citation2014; Orsat et al., Citation2006). Various preservation techniques can be employed to increase the shelf life of the product such as drying, canning, freezing, food irradiation, vacuum packing, and preserving in form of syrup (Jangam, Citation2011). Of all, dehydration is a comparatively efficient and least expensive method that can be used to reduce the microbial growth by reducing water activity of the product and in turn enhancing product shelf life.
Drying is commonly used in the plum industry for the production of prunes. The quality of the final product, i.e. prunes depends upon the type of dehydration method used (Sacilik et al., Citation2006). The selection of an appropriate drying method is vital, as it can also have an adverse impact on the nutritional and physical attributes of the dried product. The choice of suitable drying method for a specific food product depends on various factors such as the type of product, heat sensitivity, physical and chemical characteristics, dryer availability, overall energy consumption, and most importantly cost of dehydration and final quality of the product (Jangam et al., Citation2010). Traditional dehydration methods such as sun drying and solar drying are the most frequently used method for prunes production. Poor quality product and contamination losses due to rodents, birds, and microbes are the major issues associated with these techniques. So, to overcome these issues and to provide an alternative to traditional drying, conventional drying method such as hot air drying can be utilized.
Plum drying is a time-consuming and energy-intensive process, due to the presence of the waxy layer on the fruit surface, which reduces the water permeability. But the efficiency of the chosen drying method can be enhanced by using certain chemical pretreatment, which increases the moisture diffusivity of the waxy layer (Doymaz and Pala, Citation2002; Tarhan, Citation2007). These chemical pretreatments not only enhance the drying rates but also results in a product with excellent sensory and organoleptic properties by reducing the detrimental effect of enzymatic and non-enzymatic reactions which results in browning, coupled with reduced drying time, energy consumption, and cost. Several studies for dehydration of plums using chemical pretreating have been reported such as Goyal et al. (Citation2007) who used potassium metabisulfite for drying of plums in a tunnel dryer, Doymaz (Citation2004a) used ethyl oleate, and Menges and Ertekin (Citation2006) used 2% sodium hydroxide. In all of these studies, it was observed that chemically pretreated plums dried faster as compared to blanched and untreated plums.
In this study, two genotypes of Yellow European Plums (YEPs) were dried after pretreatment with potassium metabisulfite, citric acid, and ascorbic acid. The genotype used in this study was selected based on the results obtained in a previous study (Brar, Citation2017). Moreover, due to its commercial acceptability based on color, size, and texture, genotype (V91074) was suggested by the growers and genotype (V95141) was one of the genotypes that showed the lowest total phenolic activity. Hence, the objective of this study was to evaluate the drying kinetics of two-genotype of YEPs and select the best suitable chemical pretreatment method that can preserve the nutritional value of the product, enhance the functionality of the product, and result in a commercially acceptable golden dried prune.
Material and Methods
Fruits and Chemicals
Two genotypes of YEPs were studied, V91074 and V95141 obtained from the University of Guelph’s Breeding Program at Vineland (Vineland, Ontario, Canada). The fresh YEPs were stored at 4°C prior to analysis. Folin-Ciocalteu reagent, sodium bicarbonate (NaHCO3), gallic acid, methanol, 2,2-diphenyl-1-picrylhydrazyl (DPPH), 2,4,6-Tri(2-pyridyl)-s-triazine (TPTZ), formic acid, ammonium formate, and neo-chlorogenic acid were obtained from Sigma Aldrich (Sigma-Aldrich Canada Co., Oakville, Ontario, Canada), whereas methanol, sodium acetate, potassium metabisulfite, sodium hydroxide (NaOH), hydrochloric acid (HCl), ferric chloride, and chlorogenic acid were obtained from Thermo Fisher Scientific (Thermo Fisher Scientific Company, Ottawa, Ontario, Canada). Ascorbic acid and Citric acid were obtained from Phyto Technology Laboratories (Shawnee Mission, KS, United States).
Sample Preparation
Prior to analysis, the plums were washed, patted dry with a towel, sliced in half, and pitted. Initial moisture content, wet basis (w.b.), of the plums was estimated by the oven-dry method at 105°C for 24 h (AACC, Citation1986). The moisture content was calculated using EquationEq. 1(1)
(1) .
where Mi is the initial mass of the plum (g), and Mf is the final mass of the plum after 24 h (g). The initial moisture content for genotype V91074 and V95141 were 83.82% and 88.99%, respectively.
Chemical Treatment
Fresh pitted plums were dipped in 1% (w/v) of ascorbic acid (AA), citric acid (CA), and potassium metabisulfite (KMS) solution made with double-distilled water for 1 min at 40°C (). The selection of the chemicals, dipping temperature, time, and their concentration was based on the available literature (Doymaz, Citation2004a; Goyal et al., Citation2007). In particular, ascorbic acid and sulfites are increasingly used as enzyme inhibitors, bleaching agents, and reducing agents (Piližota and Šubarić, Citation1998; Taylor et al., Citation1986). These chemicals can control enzymatic browning by reacting directly with an enzyme or by indirect inhibition of polyphenol oxidase (PPO) (Piližota and Šubarić, Citation1998). There are very few studies that have used lower concentration and lower dipping temperature for chemical pretreatment (Goyal et al., Citation2007; Kingsly et al., Citation2007). A critical consideration made during the selection of chemical concentration was not to impart acidity and off-flavors that might affect the organoleptic properties (i.e. taste, texture, and aroma) of the dried plums. Moreover, the selection of these pretreatment combinations was in accord with the expectations of various small and farm level plum producers and processors, as using a higher concentration of these chemicals will not be cost-effective and consumer-friendly.
Table 1. Experimental design for chemical pre-treatment and their dipping temperature and time
Drying Experiment
Chemically pretreated and control (without pretreatment) plum samples were dried in a conventional hot-air dryer at three temperatures 50°C, 60°C, and 70°C until a final moisture content of ~30% w.b. was reached. The weight of the plum samples was measured every 2 h. The dried samples were frozen at −25°C (Insignia Chest Freezer NS-CZ35WH7-C) for 24 h and then further dried in a freeze dryer (Martin Christ GmbH, ALPHA 1-2LDplus Freeze Dryer) for 48 h to obtain samples for chemical analysis. All drying experiments were conducted in triplicates for statistical validity.
Color Measurements
Color measurements were obtained using a Chroma meter (Konica Minolta SpectraMagic NX, CR-400 Tokyo, Japan). The color was measured at various points on the skin of the plum every 2 h during drying. The Chroma meter defines color in terms of CIE L*, a*, b* values. Where L* is whiteness or brightness/darkness, a* is redness/greenness, and b* is yellowness/blueness. Color change (ΔE) was calculated using EquationEq. 2(2)
(2) (Singh et al., Citation2013).
where the subscript f denotes the value for the fresh sample and the subscript d is the value for dried samples.
Calculation of Effective Diffusivity
The effective diffusivity for plum samples was estimated by using Fick’s diffusion equation for particles having slab geometry (EquationEq. 3(3)
(3) ). As plums were dried after slicing, for this study, the samples were assumed to have a slab geometry. Shrinkage is assumed to be equal in all dimensions. The equation for Fick’s diffusion used to estimate effective diffusivity can be expressed as (Maskan et al., Citation2002):
Where Deff is the effective moisture diffusivity (mm2s−1), MR is the dimensionless moisture ratio, t is time in hours, and L is Length of the slab in millimeters.
Mathematical Modeling
The effects of dehydration time, temperature, and treatment on the drying kinetics were evaluated using 11 theoretical and semi-theoretical models () (Henderson and Pabis, Citation1961; Karathanos, Citation1999; Liu and Bakker-Arkema, Citation1997; Overhults et al., Citation1973; Sharaf-Eldeen et al., Citation1980, Citation1979; Verma et al., Citation1985; Wang and Singh, Citation1978; Yagcioglu et al.,Citation1999; Zhang and Litchfield, Citation1991).
Table 2. Mathematical models used to evaluate the drying kinetics of plum genotype
k is drying constant; n, a, b, h, c, and g are the drying coefficients, whose value depends on the model used, t is the drying time, and MR is the moisture ratio (EquationEq. 4)(4)
(4) .
where Mi is the initial moisture content, M0 is the moisture content at time t, and Me is the equilibrium moisture content which can be neglected in the case of convective drying. Therefore, EquationEq. 4(4)
(4) reduces to
Various statistical parameters, such as Root Mean Squared Error (RMSE) (EquationEq. 6(6)
(6) ), Reduced Sum Square Error (SSE) (EquationEq. 7
(7)
(7) ), and correlation coefficient (R2) (EquationEq. 8
(8)
(8) ), were used as criteria to determine the closeness of fit for the model curves.
where n is the number of observations, MRipred is predicted MR at time ti, and MRiexp is the measured value of MR at time ti.
where is the mean experimentally measured value of MR.
Preparation of Methanolic Extract
For extraction purposes, hot air-dried plum (control and pretreated) samples were evaluated. Fresh, pitted plums and hot air-dried plums were frozen at −25°C for 24 h and dried in a freeze dryer (Martin Christ GmbH, ALPHA 1- 2LDplus Freeze Dryer) for 48 h. Later, the freeze-dried samples were powdered using a blender (Magic Bullet Single Shot, MB-IM301/3-02). Two grams of dried plum sample mixed with 20 mL of methanol were then placed in a water bath set at 70°C for 90 min. For heat reflux extraction, this temperature offers increased extraction yield with little to no degradation at 90 min (Spigno et al., Citation2007). The homogenates were then centrifuged (Servall Enclosed Superspeed Centrifuge, Type SS-4) at 10,000 rpm for 10 min, the supernatants were then collected and filtered through a 0.45-µm filter, and stored at 3°C for further analysis. This membrane pore size was chosen as it rejects molecules of weights greater than 1000 units, which is ideal for the separation of polyphenols which have a molecular weight between 164.2 and 448.4 units (Nawaz et al., Citation2006).
Determination of Total Phenolic Content
Total Phenolic Content (TPC) was determined using a modified protocol by Dinardo et al. (DiNardo et al., Citation2019a). A quantity of 1 mL of methanolic plum extract was mixed with 7.5 mL double-distilled water and 0.5 mL Folin-Ciocalteu reagent. After 5 min, 1 mL of 7.5% Na2CO3 solution was added and the solution was then vortexed and stored in the dark at room temperature for 90 min. The sample absorbance was measured at 765 nm with a spectrophotometer (Thermo Scientific GENESYS 20, Thermo Fisher Scientific, Inc. Ottawa, Ontario, Canada). TPC in the methanolic extract was quantified using a standard curve (EquationEq. 9(9)
(9) ) (r2 = 0.9951) created from various concentrations (1, 2, 3, 5, 10 mg/mL) of gallic acid prepared in methanol. The amount of TPC was expressed in terms of gallic acid equivalents (GAE) in mg per g dry weight (DW).
where ‘y’ is the sample absorbance at 765 nm and ‘x’ is the gallic acid concentration in mg/mL.
Scavenging Activity on 2,2-diphenyl-1-picrylhydrazyl (DPPH) Radicals
The free radical scavenging activity of plum extracts on DPPH radicals was measured according to a modified method proposed by Dinardo et al. (DiNardo et al., Citation2019b). A 50-µL aliquot of methanolic plum extract was added to 1.5 mL DPPH solution (3.94 mg/100 mL methanol). Free electrons present in DPPH get paired off in the presence of antioxidants and the absorption decreases as the result of the extinction of DPPH’s purple color. Decolorization was determined by measuring the sample absorption at 517 nm in the spectrophotometer after 20 min. Scavenging activity on DPPH radicals was expressed as the percentage (%) inhibition using the following EquationEq. 10(10)
(10) :
where Abscontrol is the absorption of the blank sample at 517 nm and Abssample is the absorption of the methanolic plum extract at 517 nm.
Determination of Ferric Reducing Antioxidant Potential (FRAP)
The ferric reducing antioxidant potential (FRAP) method measures the antioxidants' ability to reduce colorless ferric complex (Fe3+-tripyridyltraizine) to blue colored ferrous complex (Fe2+ -tripyridyltraizine) at a low pH. The change in the absorbance of the samples is directly proportional to the reducing power of the antioxidants present (Dowling, Citation2014). Antioxidants present in the methanolic plum extracts were estimated using a modified method of Routray et al. (Routray et al., Citation2014). Fresh FRAP reagent was made using 300-mM sodium acetate buffer (pH 3.7), 10-mM TPTZ prepared in 40-mM HCl, and 20-mM ferric chloride mixed in a 10:1:1 volume ratio, respectively. A standard curve was plotted using various concentrations of ascorbic acid prepared in methanol (1, 2, 3, 5, 10 mg/mL) versus its absorbance at 595 nm. The standard curve for ascorbic acid (EquationEq. 11(11)
(11) ) (r2 = 0.9786) was used in the quantification of FRAP, recorded in terms of ascorbic acid equivalent (AAE) per g fresh sample.
where ‘y’ is the absorbance at 595 nm and ‘x’ is the ascorbic acid concentration in mg AAE/g sample. Twenty microliters of methanolic extract was mixed with 1000 µL of double-distilled water and 2 mL of FRAP reagent and incubated in a 37°C water bath for 30 min. Following incubation, the absorbance of the sample was read in a spectrophotometer (BIO-RAD Microplate Reader, Model 3550) at 595 nm.
High-Performance Liquid Chromatography (HPLC)
For quantification of ascorbic acid, neo-chlorogenic acid, and chlorogenic acid in the extracts, high-performance liquid chromatography (HPLC) was used (DiNardo et al., Citation2018). A Beckman Coulter System Gold instrument (Fullerton, CA, USA) was used and consisted of a 166 UV detector, set at 280 nm, a 126 solvent pump, and a 508 refrigerated auto-sampler set at 12°C. Chromatographic analysis was performed using 32 Karat Software (Version 1.3). Phenolic compounds were separated using a reversed phase C18 Gemini-NX (5 µm, 150 mm x 4.6 mm) column (Phenomenex, Inc., Torrance, CA, USA), fitted with a 4 mm x 3 mm guard column (Phenomenex, Inc., Torrance, CA, USA). The mobile phase was composed of solvent buffer A (10 mM formic acid in water, pH 3.5, with NaOH) and buffer B (5 mM ammonium formate in methanol). The solvent gradient was as follows: 0–1 min 100% buffer A, 1–5 min 0–30% buffer B, 5–8.5 min 30–70% buffer B, 8.5–14 min 70–100% buffer B. UV detection was conducted at 280 nm. A flow rate of 1 mL/min was used with 20 µL of sample injected. Chromatographic peaks were identified based on the retention time of standard compounds of ascorbic acid, neo-chlorogenic acid, and chlorogenic acid () (Brar, Citation2017) (DiNardo et al., Citation2019a). Standard solutions for each compound were prepared in methanol and diluted to various concentrations between 2.5 and 100 µg/mL. Phenolic compounds in methanolic extracts were quantified using the respective standard curve equation () which were plotted as area under the curve versus concentration (µg/mL).
Table 3. Phenolic compounds and their corresponding equations for the quantification of total phenolics with retention time
Figure 1. HPLC chromatogram of V91074. Ascorbic acid (peak 1), Neo-chlorogenic acid (peak 2), and chlorogenic acid (peak 3)
Statistical Analysis
The analytical part of the study included the effects of pretreatment drying on color, phenolic content, antioxidant scavenging activity, and FRAP. Duncan Tukey Honestly Significantly Different (HSD) test and Analysis of Variance (ANOVA) were conducted to determine the significance of pretreatment method and genotype on color, phenolic content, scavenging activity, and FRAP. Values reported in this paper for total phenolic content, DPPH, and FRAP are the averages of three replicates ± standard deviation. All statistical analyses were conducted using JMP software version 11 (SAS Institute Inc., Cary, NC, USA).
Results and Discussion
Drying Kinetics
For all genotypes and chemical pretreatments studied, it was observed that moisture ratio decreased continuously with drying time, whereas drying rate increased with an increase in the drying temperature () and (Figure F1-F8 supplementary figures). It is clear from and figures F1-F8 (supplementary figures) that drying temperature has a significant effect on drying time. An increase in drying temperature resulted in a decrease in drying time. Goyal et al. (Citation2007) reported a similar result, where a reduction of 11% in drying time was observed with an increase in drying temperature during thin-layer drying of plums in a tunnel dryer. Moreover, similar observations for effect of drying temperature on drying time were also reported for peach slices (Kingsly et al., Citation2007), onion slices (Sarsavadia et al., Citation1999), and soybean and white beans (Hutchinson and Otten, Citation1983). The pretreatments were also observed to have an effect on the drying rate. Plum samples treated with AA and KMS solution prior to drying were found to have shorter drying time as compared to untreated plum (control) samples, except for CA treated samples where no significant difference was observed (Figure F3-F5, supplementary figures). In most plum samples, a decrease in moisture ratio by at least 10% was observed for samples treated with AA and KMS. This increase in moisture loss in treated plums can be attributed to increase in permeability of the waxy layer present on the surface of the plum samples resulting in higher mass transfer across membranes (Kingsly et al., Citation2007). Similar observation for increased mass transfer due to chemical pretreatment has been reported for drying of peaches (Kingsly et al., Citation2007), apricots (Pala et al., Citation1996), and mulberries (Doymaz, Citation2004b).
Figure 2. Drying Kinetics of Pretreated and untreated Genotype V97074 and V95141 with Ascorbic Acid dried at 50°C
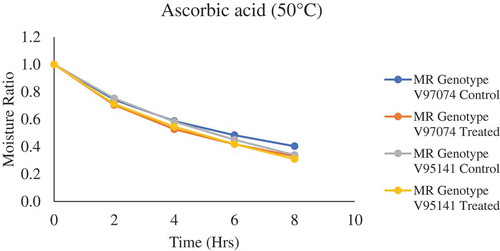
It can be observed that in and Citation1–Citation8 supplementary figures, there was no constant rate period, but a falling rate period was seen during dehydration of plums slices. This can be attributed to the quick removal of water, as there was no free moisture available at the surface before drying. This shows that the molecular diffusion (vapor diffusion) or capillary forces is the dominant mechanism that governs the internal mass transfer during drying of plums, resulting in the movement of moisture from the interior wet region to the surface from where it gets evaporated (Piga et al., Citation2004; Toğrul and Pehlivan, Citation2004). Variability in moisture ratio was observed for each pretreatment with respect to genotype; this trend can be attributed to multiple factors such as inherent dissimilarity in chemical composition, initial moisture content, and variation in shape and size of the plum genotypes. Also, a small variation in moisture ratio was observed among each respective genotype. Similar results were observed by Dowling (Dowling, Citation2014), during the dehydration of YEPs. This variation can be ascribed to alteration in skin permeability and aforementioned factors such as dissimilarity in chemical composition. High moisture loss was observed in plum samples treated with KMS when dried at 50°C and 70°C followed by AA and CA. When drying at 60°C, AA resulted in higher moisture loss followed by KMS and CA. From the results of the analysis of variance (ANOVA), it was observed that variety and temperature are significant factors, which affect the drying time and moisture ratio, whereas treatment had no significant effect on the moisture ratio and drying time. Doymaz (Doymaz, Citation2004) observed that change in concentration of the chemical pretreatment, during drying of apricots, had a significant effect on drying time. A higher concentration of chemical pretreatment resulted in lower drying time. Further studies are required to understand the effect of different chemical concentrations and dipping temperature on the drying behavior of plums slices.
Mathematical Modeling of Drying Curves
Various theoretical, semi-theoretical, and empirical models have been widely and effectively used for analyzing the thin-layer drying characteristics of various agricultural products such as grapes, figs, plums peaches (Doymaz, Citation2004a; Kingsly et al., Citation2007; Toğrul and Pehlivan, Citation2004), and highbush blueberry leaves (Routray et al., Citation2014). Moisture ratio data obtained in this study for plums pretreated with AA, CA, and KMS and dried under three different temperatures were fitted with 11 thin-layer drying models () ( and ). The corresponding values for R2, RMSE, and SSE obtained for various models and fitted for different pretreatment and temperature of hot-air drying are presented in and Table T1-T8 (supplementary tables). Selection criteria for a model that best described the drying kinetics for pretreated plums, at various temperatures, were based on the highest R2, lowest RMSE, and lowest SSE values. Highlighted data in Table T4 and Table T1-T8 (Supplementary tables) indicate the model selected for that pretreated plums dried at different temperatures. R2 value more than 0.99 was observed in each of the following selected thin-layer drying models indicating the goodness of fit (Goyal et al., Citation2007; Kingsly et al., Citation2007). These findings are summarized in . Also, for most of the treated and untreated samples, moisture ratio data obtained in this study cannot be fitted with Modified Henderson & Pabis. As for most of the samples dried, drying time was less than 8 h, but this model requires at least six data points for drying time, i.e., more than 8 h.
Table 4. Results of statistical analysis on thin-layer drying of two varieties of plums pretreated with Citric Acid at 50°C
Table 5. Selected thin-layer drying model for each genotype pretreated with CA, AA, and KMS and dried at 50°C, 60°C, and 70°C
Figure 3. Drying kinetic model fitting to the drying curve for plum genotype V91074 (control) dried at 50°C
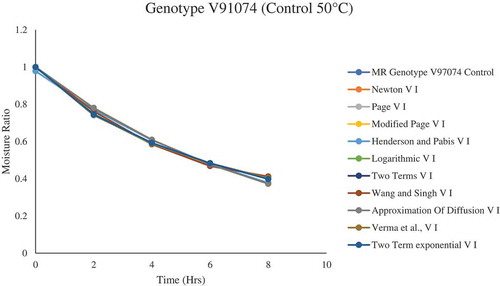
Figure 4. Drying kinetic model fitting to the drying curve for plum genotype V91074 (Treated) dried at 50°C
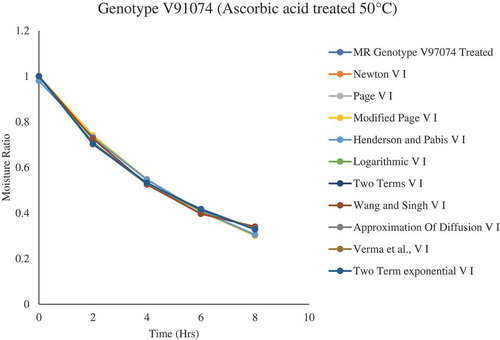
Due to genotypic variation, one thin-layer drying model cannot be selected to describe the drying kinetics for all the dried plum samples. Various models exhibited to be a perfect fit for describing the drying characteristics of plums (). Overall, for genotype V91074, Verma et al., Page, and two-term were selected to describe the drying behavior of plums samples treated and non-treated with CA, AA, and KMS, whereas, for genotype V95141, Wang and Singh and Logarithmic were selected. Similar observation has been reported by Doymaz (Doymaz, Citation2004), Kingsly et al. (Citation2007) and Goyal et al. (Citation2007) where they selected the Logarithmic model for describing the drying behavior of apricot, peach, and plum slices.
Color Analysis
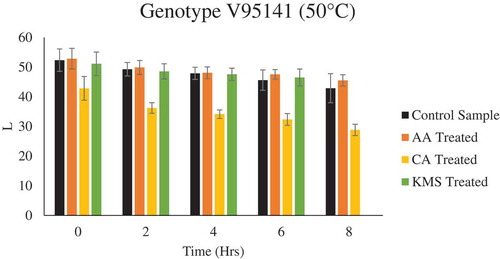
It was observed that drying conditions affected the final color of the plum samples. Regardless of pretreatment, drying at elevated temperature resulted in thermal degradation which attributed to darker color products. A slight increase in L* values for pretreated plums for both varieties was observed as compared to untreated plums, when dried at a lower temperature (i.e. 50°C) ( & ), whereas no significant difference in L* values for both pretreated and untreated plums for both varieties were observed during drying at 60°C and 70°C (Figure F9-F12 supplementary figure). In case of a* and b* value, with respect to treatment, no significant difference was observed in pretreated and untreated plums for both the genotypes, whereas with respect to temperature, a significant difference was observed. A similar trend was observed in case of ∆E, drying at elevated temperature resulted in higher ∆E, regardless of pretreatment. Similar results were reported by Tarhan (Tarhan, Citation2007) and Singh et al. (Singh et al., Citation2013), during drying of plums and potato slices, where they observed drying at high temperature attributed to darker colored products.
Figure 5. Color Analysis (L* value) for Genotype V97074 pretreated with AA, CA, and KMS at 50°C
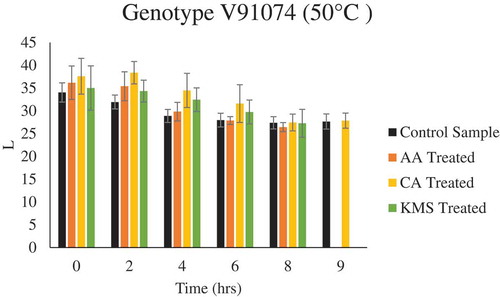
Figure 6. Color Analysis (L* value) for Genotype V95141 pre-treated with AA, CA, and KMS at 50°C
Effective Moisture Diffusivity
One objective of this study was to estimate the effective moisture diffusivity of YEPs during thin-layer drying, which has not been previously studied. The mechanism of water transport during food dehydration, which follows falling rate drying period, can be described by Fick’s second law of unsteady-state diffusion (EquationEquation 3)(3)
(3) (Crank, Citation1979). The effective moisture diffusivity was calculated by using the method of slopes (Doymaz, Citation2004; Maskan et al., Citation2002). Values of Deff for treated and untreated plum samples are summarized in . Deff for untreated and treated plum samples ranged between 4.1 × 10⁻¹¹ to 8.6 × 10⁻¹¹ (m2/s) and 4.9 × 10⁻¹¹ to 9.1 × 10⁻¹¹(m2/s), respectively. With respect to treatment, AA-treated samples exhibited higher Deff as compared to other pretreatments. A significant effect of pretreatment on moisture diffusivity was observed. This can be attributed to a partial breakdown of waxy layer present on the plum samples, thus resulting in an increase in mass transfer across the membrane (i.e. increase in permeability). Similar results for an increase in Deff for treated samples have been reported during drying of plums, peaches, and apricots (Doymaz, Citation2004, Citation2004a; Kingsly et al., Citation2007). Treatment with citric acid and ascorbic acid increased the permeability of cell membrane and leads to an increase in water diffusivity. Citric acid is considered as an organic acid and used as a preservative in fruits and vegetables. It accelerates the drying rate because in acidic conditions, pectin of fruits and vegetables solubilizes and helps in the removal of water. On the other hand, ascorbic acid is considered as an antioxidant that reduces the o-quinones to colorless dihydroxyphenols and forms a barrier to diffusion into the product; thus, it could not provide sufficient penetration to the cellular matrix at a higher temperature (Deng et al., Citation2017). Thus, pretreatment with acids gavea higher Deff values as compared to the untreated samples.
Table 6. Effective Moisture Diffusivity coefficient for treated and untreated plums samples
Variability in Deff values for treated and untreated plum samples with respect to genotype was observed. Moreover, with an increase in temperature, variation in Deff values was observed in each genotype. For most of the treated and untreated plums samples, Deff value increased with increasing temperature from 50°C to 60°C whereas, for the increase in temperature from 60°C to 70°C, most of the Deff values decreased (). This change can be ascribed to numerous factors such as variation in shape and size of the plum genotypes, initial moisture content, and chemical composition. Moreover, hindrance to water movement through skin layer is an important factor during the dehydration of plums having intact skin (Sabarez and Price, Citation1999). It is well established that skin of fresh plums covered with protective layer, waxy and hydrophobic in nature, would offer substantial interruption in moisture loss, particularly during early stages of drying (Storey and Price, Citation1999). However, as drying advances, presumably, internal resistance becomes the foremost aspect that hinders the water movement (Sabarez and Price, Citation1999). During plum dehydration, variation in Deff value with respect to drying time was observed (). At the initial stage of drying, Deff values increased with time; however, after reaching a maximum point, a decrease was observed as drying progressed. This trend can be ascribed to change in pore size or porosity of the material as drying alters the pore size reducing the movement of moisture from the interior to the surface (Karathanos et al., Citation1990). Similar results for the decrease in effective moisture diffusivity with time were observed by (Azzouz et al., Citation2002) during dehydration of ethyl-oleate-treated grapes. The reason for the decrease in Deff value can be ascribed to pretreatment with ethyl oleate which disrupts the waxy layer present on the surface of the fruit and increased the moisture transfer and drying rate initially. Also, similar trends for the decrease in effective moisture diffusivity with respect to time during drying of food material have been reported by Raghavan et al. (Citation1995).
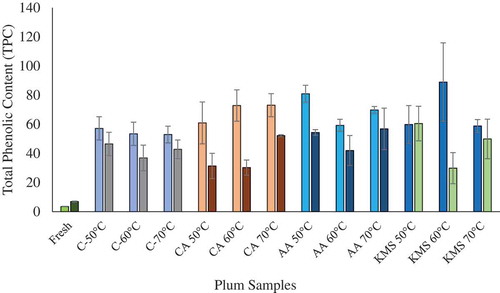
Figure 7. Total Phenolic Content (TPC) for treated and untreated Genotype V91074 and V95141 dried at 50°C, 60°C, and 70°C
Determination of Total Phenolic Content (TPC)
The selection of suitable drying method is generally considered an important postharvest step as it affects the shelf life and physio-chemical properties of the product. One of the objectives of this study was to maintain and/or enhance the nutritional content of the YEPs during drying of treated and untreated plum samples. Phenolics, a well-recognized group of plant secondary metabolites, are responsible for demonstrating various medicinal and physiological roles in animals and plants (Manach et al., Citation2005). Estimation of TPC in fresh and processed (dried) samples is a significant criterion that can be used to determine the effect of processing conditions on the chemical composition of the product. For genotype V91074, TPC for fresh, untreated, and treated plums ranged from 3.51 ± 0.17 mg GAE/g FW to 88.96 ± 26.95 mg GAE/g DW, whereas, for genotype V95141, TPC ranged from 6.94 ± 0.35 mg GAE/g FW to 60.48 ± 11.87 mg GAE/g DW ( and Supplementary Table T9). A similar range of 2.11 to 8.70-mg GAE/g FW, for TPC, was reported by Dowling (Dowling, Citation2014), during drying of YEPs. A significant difference in TPC among each genotype was observed. TPC for fresh genotype V95141 was higher as compared to V91074, whereas, in case of dried plums, genotype V91074 showed higher TPC when compared to V95141. This trend can be due to the presence of significant genotypic variation resulting in a difference in their chemical and physical characteristics. Drying resulted in a significant increase in TPC for both treated and untreated plums, when compared to fresh samples (). Similar results for an increase in TPC for dried plums as compared to fresh plums have been reported by Stacewicz-Sapuntzakis et al. (Stacewicz-Sapuntzakis et al., Citation2001) during plum drying. Moreover, Dowling (Dowling, Citation2014) reported an increase by at least 200% in the bio-availability of TPC during the drying of plums. This significant difference in TPC can be ascribed to the concentration of bio-active compounds in dried plums as compared to fresh (Stacewicz-Sapuntzakis et al., Citation2001). As thermal processing of plums results in the degradation of heat-sensitive nutrients such as anthocyanins, catechins, and few phenolic compounds due to cell disruption by activation of PPO. Still, TPC in prunes is higher as compared to fresh plums, as dehydration concentrates the ingredients even with concurrent partial degradation of these constituents (Donovan et al., Citation1998). Furthermore, in a study conducted by the United States Department of Agriculture (USDA), a significant difference in nutrient content was observed in the case of dried fruits and fresh fruits (McBride, Citation1999). Results from this study concluded that dried fruits have greater nutrient density, fiber content, significantly greater phenolic, and antioxidant activity when compared to fresh fruits. For most of the samples, drying at 50°C resulted in a slight increase in TPC for both treated and untreated samples (), whereas drying at 60°C resulted in lower TPC for most of the treated plums, when compared to samples dried at 50°C and 70°C. This can be attributed to greater enzymatic activity, as in case of drying at 60°C, plums are exposed to a higher temperature for a longer period, whereas drying at elevatedtemperature results in less drying time leading to less enzymatic activity (Raynal et al., Citation1989; Vega-Gálvez et al., Citation2009). No significant difference in TPC was observed with respect to pretreatment after analysis of Duncan Tukey HSD test results. This might be attributed to the lower concentration of pretreatment used. However, the ascorbic acid treatment showed promising results, as higher TPC was observed in AA treated samples as compared to other treatments. From ANOVA results (supplementary Figure F13), the coefficient of determination R2 = 0.82 is in reasonable agreement with adjusted R2 = 0.63, indicating that this model can be used for estimation of TPC.
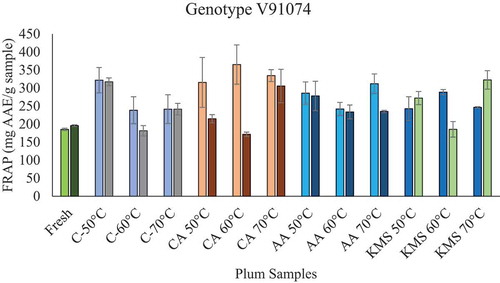
Figure 8. FRAP activity for treated and untreated Genotype V91074 and V95141 dried at 50°C, 60°C, and 70°C
Determination of Radical Scavenging Activity (DPPH)
Various assays can be applied for determining the antioxidant activity of the sample; these are categorized into two ways: assays based on hydrogen atom transfer and electron transfer (Dudonné et al., Citation2009). FRAP measures the antioxidant ability, present in the sample, to reduce the ferric complex (Fe3+) to ferrous complex (Fe2+), whereas DPPH measures the ability of the antioxidants to donate a hydrogen atom to DPPH radical (Benzie and Strain, Citation1996; Sanchez-Moreno, Citation2002). Therefore, these two methods were selected to determine the antioxidant capacity of plum samples.
The scavenging activity of fresh, untreated, and treated plums is summarized in . For genotype V91074, scavenging activity for fresh, untreated, and treated plums ranged from 44.51 ± 3.44 (%) to 88.11 ± 0.16 (%), whereas for genotype V95141, scavenging activity ranged from 50.93 ± 6.90 (%) to 88.26 ± 0.29 (%). A significant increase in scavenging activity in the genotypes was observed for both treated and untreated samples, when compared with fresh samples. Drying resulted in an increase in scavenging activity by at least 60% for both genotypes, when compared to fresh plums. Similar results for an increase in scavenging activity have been reported during drying of plums (Dowling, Citation2014; Piga et al., Citation2003), and highbush blueberry leaves (Routray et al., Citation2014). This increase can be ascribed to an increase in the bio-availability of the antioxidants. Moreover, dehydration at elevated temperatures may have led to the formation of new products, which have higher antioxidant activity (Piga et al., Citation2003). Similar results for higher antioxidant activity during drying of plums at high temperature (85°C) have been reported by Piga et al. (Piga et al., Citation2003). They reported that the formation of Maillard reaction products (MRPs) by a chain-breaking type mechanism resulted in an increase in antioxidant activity.
Table 7. Antioxidant scavenging activity of fresh, untreated, and treated Yellow European plums
From ANOVA results (supplementary Figure F14), the coefficient of determination R2 = 0.98 is in good accord with adjusted R2 = 0.96, indicating that this model can be used for the estimation of antioxidant content. Results from the Duncan Tukey HSD test showed that there is no significance difference in scavenging activity for both genotypes studied. Moreover, no significant difference with respect to treatment was observed, which might be attributed to the lower chemical concentration of pretreatment and dipping time. Further studies are required to investigate the effect of various combinations of dipping time and concentration on the antioxidant activity of YEPs.
Determination of Ferric Reducing Antioxidant Potential (FRAP)
FRAP is another method used in this study to measure the antioxidant capacity of plums. For genotype V91074, FRAP activity for fresh, untreated, and treated (CA, AA, and KMS) plums ranged from 185.4 ± 3.42 mg AAE/g sample to 365.16 ± 54.51 mg AAE/g sample, respectively (and supplementary Table T10), whereas, for genotype V95141, scavenging activity ranged from 196.8 ± 2.24 mg AAE/g sample to 322.56 ± 25.65 mg AAE/g sample, respectively. An increase in FRAP activity in most of the samples for both genotypes was observed in untreated and treated samples, when compared to fresh samples (). This increase can be attributed to an increase in the bioavailability of antioxidants. Furthermore, other factors such as an increase in reducing sugars and the formation of MRPs can be responsible for this increase in antioxidant activity (Dowling, Citation2014; Madrau et al., Citation2009). Similar results for an increase in bioavailability (i.e. increase in antioxidant activity) were observed N. Miletic et al. (Miletić et al., Citation2013) and Piga et al. (Piga et al., Citation2003) during plum drying. With respect to treatment, no significant difference was observed. However, a slight variation in FRAP activity was observed in treated samples for both the genotypes (). Drying at a higher temperature resulted in an increase FRAP activity for some treated samples, whereas, in other treated samples, a decrease was observed. This difference in FRAP activity for treated samples can be due to genotypic variation, or due to a loss of antioxidant constituents of the sample. From ANOVA results (supplementary Figure F15), the coefficient of determination R2 = 0.59 is not in good agreement with adjusted R2 = 0.15, indicating that this model is not suitable for the estimation of antioxidant content. The results from this study showed that phenolic content and antioxidant content in both genotypes after treatment did not result in the same effect.
HPLC Quantification
Plums are considered as a functional food or nutraceutical because of their high phenolic and antioxidant activity. Major phenolic compounds present in plums that have been reported in literature are neo-chlorogenic acid, chlorogenic acid, ascorbic acid (DiNardo et al., Citation2019b; Donovan et al., Citation1998; Piga et al., Citation2003; Singh et al., Citation2011), which were quantified in this study (). Many phenolic compounds present in plums are concentrated on the skin, predominantly anthocyanins, cyanidin 3-rutinoside, and peonidin 3-rutionside, etc. During thermal processing, phenolic compounds present in skin degrades more rapidly as compared to ones present in the pulp (Stacewicz-Sapuntzakis et al., Citation2001). In this study, it was observed that neo-chlorogenic acid was the highest, followed by ascorbic acid and chlorogenic acid. Similar observation for neo-chlorogenic acid being the predominant phenolic compound in plums has been reported by Piga et al. (Piga et al., Citation2003), Fang et al. (Fang et al., Citation2002), and Del Caro et al. (Del Caro et al., Citation2004), during plum drying. Overall, drying at high temperature (70°C), a decrease in ascorbic acid content for untreated (control) and treated plums for both genotypes was observed. This trend can be due to the thermal and oxidation sensitive nature of ascorbic acid. With respect to genotype, a slight variation in ascorbic content for treated and untreated plums was observed. For genotype V91074, samples treated with AA resulted in higher ascorbic acid content as compared to other pretreatments, whereas, in genotype V95141, CA-treated samples resulted in high ascorbic acid content when compared to fresh and other pretreatments. This variation can be ascribed to dissimilarity in their physio-chemical characteristics. Except for samples treated with AA and CA in genotype V91074, neo-chlorogenic acid, and chlorogenic acid for all treated and untreated samples decreased with an increase in temperature. This can be attributed to increase in PPO activity. Cell destruction occurs more rapidly at higher drying temperatures resulting in the release of PPO. Moreover, denaturation of these enzymes occurs at higher drying temperature resulting in a higher rate of oxidation of phenolic compounds.
Table 8. HPLC analysis of total ascorbic acid, neo-chlorogenic acid, and chlorogenic acid content in fresh, Control, and Pretreated dried YEPs
Conclusion
The effect of three different pretreatments 1% citric acid, 1% ascorbic acid, and 1% potassium metabisulfite (KMS), on two genotypes of Yellow European Plums was investigated. The YEPs were dipped in the chemical solutions for 1 min and then were dried in hot air at 50°, 60°, and 70°C. Falling rate period was observed during dehydration. A single drying model could not be used to describe the drying behavior of the plums studied; therefore, five models (Verma et al., and two-term, Wang and Singh, Page and Logarithmic), were selected which fit the drying kinetics of YEPs. Drying temperature had an important effect on the color of the treated and untreated samples, whereas no significance effect of pretreatment was observed. Hot-air drying improved the nutritional properties of the plums by increasing the bioavailability of the nutrients. An increase in total phenolic content, antioxidant scavenging activity, and ferric reducing antioxidant potential was observed for treated and untreated plums over fresh plums. No significant effect of pretreatment was observed in this study on total phenolic content, antioxidant scavenging activity, and ferric-reducing antioxidant potential. However, the ascorbic acid treatment showed promising results, indicating it to be used in place of KMS, as it will be phased out soon from the food industry.
Supplemental Material
Download Zip (102.4 KB)Acknowledgments
The authors would like to thank OMAFRA for a research grant through the OMAFRA-UofG program to Subramanian and the support of the Ontario Tender Fruit Marketing Board (OTFMB) and Niagara Peninsula Fruit and Vegetable Grower’s Association (NPFVGA).
Supplementary material
Supplemental data for this article can be accessed here.
References
- AACC. 1986. Approved methods of the American assn. of cereal chemists, American association of cereal chem. Method 66-50. In: Approved methods of the AACC. 10th ed. St. Paul, Minn.: AACC.
- Azzouz, S., A. Guizani, W. Jomaa, and A. Belghith. 2002. Moisture diffusivity and drying kinetic equation of convective drying of grapes. J. Food Eng. 55:323–330. doi: 10.1016/S0260-8774(02)00109-7.
- Benzie, I.F., and J.J. Strain. 1996. The ferric reducing ability of plasma (FRAP) as a measure of “antioxidant power”: The FRAP assay. Anal. Biochem. 239:70–76. doi: 10.1006/abio.1996.0292.
- Brar, H.S. 2017. Physio-chemical changes occurring during the dehydration of yellow European plums (Prunus domestica L.) into Golden-dried Prunes (Masters dissertation).
- Choi, Y., H.-S. Jeong, and J. Lee. 2007. Antioxidant activity of methanolic extracts from some grains consumed in Korea. Food Chem. 103:130–138. doi: 10.1016/j.foodchem.2006.08.004.
- Crank, J. 1979. The mathematics of diffusion. Ely House, London: Oxford university press.
- Del Caro, A., A. Piga, I. Pinna, P.M. Fenu, and M. Agabbio. 2004. Effect of drying conditions and storage period on polyphenolic content, antioxidant capacity, and ascorbic acid of prunes. J. Agric. Food Chem. 52:4780–4784. doi: 10.1021/jf049889j.
- Deng, L.Z., A.S. Mujumdar, Q. Zhang, X.H. Yang, J. Wang, Z.A. Zheng, … H.W. Xiao. 2017. Chemical and physical pretreatments of fruits and vegetables: Effects on drying characteristics and quality attributes–a comprehensive review. Crit. Rev. Food Sci. Nut. 59(9):1408–1432. doi: 10.1080/10408398.2017.1409192.
- DiNardo, A., H.S. Brar, J. Subramanian, and A. Singh. 2019a. Optimization of microwave‐assisted extraction parameters and characterization of phenolic compounds in yellow European plums. Can. J. Chem. Engg. 97(1):256–267. doi: 10.1002/cjce.23237.
- DiNardo, A., J. Subramanian, and A. Singh. 2018. Investigation of antioxidant content and capacity in yellow European plums. Int. J. Of Fruit Sci. 18(1):99–116. doi: 10.1080/15538362.2017.1381873.
- DiNardo, A., J. Subramanian, and A. Singh. 2019b. Intensification of phenolic extraction from yellow European plums by use of conventional, microwave-, and ultrasound-assisted extraction, p. 1–14. In: Separation Sci and Tech. 55(3):523-536
- Donovan, J.L., A.S. Meyer, and A.L. Waterhouse. 1998. Phenolic composition and antioxidant activity of prunes and prune juice (Prunus domestica). J. Agric. Food Chem. 46:1247–1252. doi: 10.1021/jf970831x.
- Dowling, C. 2014. The polyphenolic composition and antioxidant capacity of yellow European plums (Prunus domestica L.) and novel golden prunes. Guelph, ON, University of Guelph, MSc. Thesis.
- Doymaz, I. 2004. Effect of pre-treatments using potassium metabisulphide and alkaline ethyl oleate on the drying kinetics of apricots. Biosyst. Engg. 89:281–287. doi: 10.1016/j.biosystemseng.2004.07.009.
- Doymaz, İ. 2004a. Effect of dipping treatment on air drying of plums. J. Food Eng. 64:465–470. doi: 10.1016/j.jfoodeng.2003.11.013.
- Doymaz, İ. 2004b. Pretreatment effect on sun drying of mulberry fruits (Morus alba L.). J. Food Eng. 65:205–209. doi: 10.1016/j.jfoodeng.2004.01.016.
- Doymaz, I., and M. Pala. 2002. The effects of dipping pretreatments on air-drying rates of the seedless grapes. J. Food Eng. 52:413–417. doi: 10.1016/S0260-8774(01)00133-9.
- Dudonné, S., X. Vitrac, P. Coutière, M. Woillez, and J.-M. Mérillon. 2009. Comparative study of antioxidant properties and total phenolic content of 30 plant extracts of industrial interest using DPPH, ABTS, FRAP, SOD, and ORAC assays. J. Agric. Food Chem. 57:1768–1774. doi: 10.1021/jf803011r.
- Fang, N., S. Yu, and R.L. Prior. 2002. LC/MS/MS characterization of phenolic constituents in dried plums. J. Agric. Food Chem. 50:3579–3585. doi: 10.1021/jf0201327.
- Goyal, R., A. Kingsly, M. Manikantan, and S. Ilyas. 2007. Mathematical modelling of thin layer drying kinetics of plum in a tunnel dryer. J. Food Eng. 79:176–180. doi: 10.1016/j.jfoodeng.2006.01.041.
- Henderson, S., and S. Pabis. 1961. Grain drying theory I. Temperature effect on drying coefficient. J. Agril Engg. Res. 6:169–174.
- Hutchinson, D., and L. Otten. 1983. Thin‐layer air drying of soybeans and white beans. Int J. Food Sci. Technol. 18:507–522. doi: 10.1111/j.1365-2621.1983.tb00292.x.
- Jangam, S.V. 2011. An overview of recent developments and some R&D challenges related to drying of foods. Drying Technol. 29:1343–1357. doi: 10.1080/07373937.2011.594378.
- Jangam, S.V., C.L. Law, and A.S. Mujumdar. 2010. Drying of foods, vegetables and fruits. ISBN- 978-981-08-6759-1. Singapore.
- Karathanos, V., G. Villalobos, and G. Saravacos. 1990. Comparison of two methods of estimation of the effective moisture diffusivity from drying data. J. Food Sci. Technol. 55:218–223.
- Karathanos, V.T. 1999. Determination of water content of dried fruits by drying kinetics. J. Food Eng. 39:337–344. doi: 10.1016/S0260-8774(98)00132-0.
- Kingsly, R.P., R.K. Goyal, M.R. Manikantan, and S.M. Ilyas. 2007. Effects of pretreatments and drying air temperature on drying behaviour of peach slice. Int J. Food Sci. Technol. 42:65–69. doi: 10.1111/j.1365-2621.2006.01210.x.
- Liu, Q., and F. Bakker-Arkema. 1997. Stochastic modelling of grain drying: Part 2. Model development. J. Agril. Engg. Res. 66:275–280. doi: 10.1006/jaer.1996.0145.
- Madrau, M.A., A. Piscopo, A.M. Sanguinetti, A. Del Caro, M. Poiana, F.V. Romeo, and A. Piga. 2009. Effect of drying temperature on polyphenolic content and antioxidant activity of apricots. Eur. Food Res. Technol. 228:441. doi: 10.1007/s00217-008-0951-6.
- Manach, C., A. Mazur, and A. Scalbert. 2005. Polyphenols and prevention of cardiovascular diseases. Curr. Opin. Lipidol. 16:77–84. doi: 10.1097/00041433-200502000-00013.
- Maskan, A., S. Kaya, and M. Maskan. 2002. Hot air and sun drying of grape leather (pestil). J. Food Eng. 54:81–88. doi: 10.1016/S0260-8774(01)00188-1.
- McBride, J. 1999. High-ORAC foods may slow aging. Agric. Res. 47:14–17.
- Menges, H.O., and C. Ertekin. 2006. Thin layer drying model for treated and untreated Stanley plums. Energy Conv. Managem. 47:2337–2348. doi: 10.1016/j.enconman.2005.11.016.
- Miletić, N., O. Mitrović, B. Popović, V. Nedović, B. Zlatković, and M. Kandić. 2013. Polyphenolic content and antioxidant capacity in fruits of plum (Prunus domestica L.) cultivars “Valjevka” and “Mildora” as influenced by air drying. J. Food Qual. 36:229–237. doi: 10.1111/jfq.12035.
- Nawaz, H., J. Shi, G.S. Mittal, and Y. Kakuda. 2006. Extraction of polyphenols from grape seeds and concentration by ultrafiltration. Sep. Purif. Technol. 48:176–181. doi: 10.1016/j.seppur.2005.07.006.
- Orsat, V., V. Changrue, and G. Raghavan. 2006. Microwave drying of fruits and vegetables. Stewart Postharvest. Rev. 6, 4-9(2):1–7.
- Overhults, D., G. White, H. Hamilton, and I. Ross. 1973. Drying soybeans with heated air. Trans. ASAE. 16:112–0113. doi: 10.13031/2013.37459.
- Pala, M., T. Mahmutoǧlu, and B. Saygi. 1996. Effects of pretreatments on the quality of open‐air and solar dried apricots. Mol. Nut. Food Res. 40:137–141.
- Piga, A., A. Del Caro, and G. Corda. 2003. From plums to prunes: Influence of drying parameters on polyphenols and antioxidant activity. J. Agric. Food Chem. 51:3675–3681.
- Piga, A., I. Pinna, K.B. Özer, M. Agabbio, and U. Aksoy. 2004. Hot air dehydration of figs (Ficus carica L.): Drying kinetics and quality loss. Int J. Food Sci. Technol. 39:793–799. doi: 10.1111/j.1365-2621.2004.00845.x.
- Piližota, V., and D. Šubarić. 1998. Enzymatic browning of foods. Food Tech. Biotech. 36:219–227.
- Raghavan, G. S. V., T. N. Tulasidas, S. S. Sablani, and H. S. Ramaswamy. 1995. A method of determination of concentration dependent effective moisture diffusivity. Drying Technology 13(5–7):1477-1488.
- Raynal, J., M. Moutounet, and J.M. Souquet. 1989. Intervention of phenolic compounds in plum technology. 1. Changes during drying. J. Agric. Food Chem. 37:1046–1050. doi: 10.1021/jf00088a050.
- Routray, W., V. Orsat, and Y. Gariepy. 2014. Effect of different drying methods on the microwave extraction of phenolic components and antioxidant activity of highbush blueberry leaves. Drying Tech. 32:1888–1904. doi: 10.1080/07373937.2014.919002.
- Sabarez, H.T., and W.E. Price. 1999. A diffusion model for prune dehydration. J. Food Eng. 42:167–172. doi: 10.1016/S0260-8774(99)00115-6.
- Sacilik, K., A.K. Elicin, and G. Unal. 2006. Drying kinetics of Üryani plum in a convective hot-air dryer. J. Food Eng. 76:362–368. doi: 10.1016/j.jfoodeng.2005.05.031.
- Sanchez-Moreno, C. 2002. Methods used to evaluate the free radical scavenging activity in foods and biological systems. Revista De Agaroquimica Y Tecnologia De Alimentos 8:121–137.
- Sarsavadia, P., R. Sawhney, D. Pangavhane, and S. Singh. 1999. Drying behaviour of brined onion slices. J. Food Eng. 40:219–226. doi: 10.1016/S0260-8774(99)00058-8.
- Sharaf-Eldeen, Y., J. Blaisdell, and M. Hamdy. 1980. A model for ear corn drying. Trans. ASAE. 23:1261–1265. doi: 10.13031/2013.34757.
- Sharaf-Eldeen, Y., M. Hamdy, H. Keener, and J. Blaisdell. 1979. Mathematical description of drying fully exposed grains. ASAE Paper o:79-3034.
- Singh, A., G.R. Nair, J. Rahimi, Y. Gariepy, and V. Raghavan. 2013. Effect of static high electric field pre-treatment on microwave-assisted drying of potato slices. Drying Technol. 31:1960–1968. doi: 10.1080/07373937.2013.805142.
- Singh, A., K. Sabally, S. Kubow, D.J. Donnelly, Y. Gariepy, V. Orsat, and G. Raghavan. 2011. Microwave-assisted extraction of phenolic antioxidants from potato peels. Molecules. 16:2218–2232. doi: 10.3390/molecules16032218.
- Spada, P.D., G.G.N. de Souza, G.V. Bortolini, J.A. Henriques, and M. Salvador. 2008. Antioxidant, mutagenic, and antimutagenic activity of frozen fruits. J. Med. Food. 11:144–151. doi: 10.1089/jmf.2007.598.
- Spigno, G., L. Tramelli, and D.M. De Faveri. 2007. Effects of extraction time, temperature and solvent on concentration and antioxidant activity of grape marc phenolics. J. Food Eng. 81:200–208. doi: 10.1016/j.jfoodeng.2006.10.021.
- Stacewicz-Sapuntzakis, M., P.E. Bowen, E.A. Hussain, B.I. Damayanti-Wood, and N.R. Farnsworth. 2001. Chemical composition and potential health effects of prunes: A functional food. Crit. Rev. Food Sci. Nutr. 41:251–286. doi: 10.1080/20014091091814.
- Storey, R., and W.E. Price. 1999. Microstructure of the skin of d’Agen plums. Sci. Hortic. 81:279–286. doi: 10.1016/S0304-4238(99)00024-2.
- Tarhan, S. 2007. Selection of chemical and thermal pretreatment combination for plum drying at low and moderate drying air temperatures. J. Food Eng. 79:255–260. doi: 10.1016/j.jfoodeng.2006.01.052.
- Taylor, S.L., N.A. Higley, and R.K. Bush. 1986. Sulfites in foods: Uses, analytical methods, residues, fate, exposure assessment, metabolism, toxicity, and hypersensitivity. Adv. Food Res. 30:1–76.
- Toğrul, İ.T., and D. Pehlivan. 2004. Modelling of thin layer drying kinetics of some fruits under open-air sun drying process. J. Food Eng. 65:413–425. doi: 10.1016/j.jfoodeng.2004.02.001.
- Vega-Gálvez, A., K. Di Scala, K. Rodríguez, R. Lemus-Mondaca, M. Miranda, J. López, and M. Perez-Won. 2009. Effect of air-drying temperature on physico-chemical properties, antioxidant capacity, colour and total phenolic content of red pepper (Capsicum annuum, L. var. Hungarian). Food Chem. 117:647–653. doi: 10.1016/j.foodchem.2009.04.066.
- Verma, L.R., R. Bucklin, J. Endan, and F. Wratten. 1985. Effects of drying air parameters on rice drying models. Trans. ASAE. 28:296–0301. doi: 10.13031/2013.32245.
- Wang, C., and R. Singh. 1978. A single layer drying equation for rough rice. ASAE paper.
- Yagcioglu, A., A. Degirmencioglu, and F. Cagatay (1999) Drying characteristics of laurel leaves under different conditions. Proceedings of the 7th International congress on agricultural mechanization and energy, Adana, 565-569.
- Zhang, Q., and J. Litchfield. 1991. An optimization of intermittent corn drying in a laboratory scale thin layer dryer. Drying Tech. 9:383–395. doi: 10.1080/07373939108916672.