
ABSTRACT
Northeast India is known for its diverse nature of soil, climate, and topography that supports rich banana diversity. Banana (Musa sp.) is the second most important fruit crop in India due to its availability throughout the year, taste along with the nutritive and medicinal value. Thus, the genetic diversity of banana resources is essential for present and future food. This study aimed to determine the comparative genetic variation among 14 non-commercial edible banana cultivars of Assam, India, by using 50 different morphological characters with ISSR markers. Morphological data were analyzed hierarchical clusters and principal coordinates which showed to cluster all the accessions into two distinct groups and subsequently into four subgroups. Furthermore, ISSR markers revealed the average percentage of polymorphism. A total of 62 bands were detected of which 56 bands showed polymorphism using seven primers. The highest number of the band was detected with the primer UBC-843 and the lowest number of the band was observed with UBC-848. The genetic similarity index was prepared using Jaccard’s similarity coefficient and the range of genetic similarity was from 0.28 to 0.77 with 0.51 of average. Dendrogram produced from the cluster analysis showed the clear division of the genotypes into two distinct clusters. Seven accessions of viz. Bharatmoni, Assamiya-malbhog, Gobin tulashi, Bokmoni, Bangali-malbhog, Katiya-jahaji, and Abor-malbhog were clustered in the first group. The second group included the accessions viz. Jatikol, Adeel, Guwahatia-kol, Fessa-monohar, Athiya kol, Ximalu-monohar, and Bogi-monohar. The Mantel test analysis also showed positive relationships between morphological traits and ISSR markers.
Introduction
The genus Musa L. embraces of all the cultivated bananas which are consumed by human and animals as a nutritious fruit since centuries. Present day’s cultivated edible bananas are mostly triploids that are originated from two wild diploid forms of Musa viz. Musa acuminata Colla (AA) and M. balbisiana Colla (BB) (Simmonds and Shepherd, Citation1955). The genus is found mainly in tropical humid forests and plains and considered to be originated from Southeast Asia (Ploetz et al., Citation2007; Ude et al., Citation2002). Adjacent to southeast Asia, the climate and soil types of Assam in the northeastern parts of India favors the growth of different varieties of Musa most of which are domesticated since long and for long time practice of hybridization at inter and intra-specific level by cultivators resulted in the occurrence of a number of cultivars in this region (Borborah et al., Citation2016a; Hore et al., Citation1992). Thus, an immense utilization of the fruits as nutritious food is prevalent among the localities of Assam.
The classification of Musa is generally carried out by the use of morphological descriptors and the ploidy status (Simmonds and Shepherd, Citation1955). Morphological descriptions for Musa L. germplasms using the descriptors of International Network for the Improvement of Banana and Plantain (INIBAP) provide useful information regarding the classification and characterization of cultivated bananas. Further, conferring local names with local dialects to the cultivars based on their morphological characteristics may result in a large number of synonyms while avoiding duplicity (Bhat and Jarret, Citation1995). Although the degree of relatedness among cultivars based on only the use of morphological parameters could be underrated. Therefore, in addition to the morphological characterization, various DNA-based marker techniques have been applied recently to classify and find out the genetic diversity of the Musa germplasms (Agoreyo et al., Citation2008; Barman et al., Citation2014; Brown et al., Citation2009; Jain et al., Citation2007). The inter simple sequence repeats (ISSR) is one of that DNA-based marker technique that has been successfully used to determine the genetic variations in the germplasms of Musa L. (Chowdhury et al., Citation2014; Kumar et al., Citation2017a; Rahman et al., Citation2012). In recent trends of phylogenetic analysis using molecular markers, ISSR markers have emerged as very useful due to its stability and advantage of microsatellites, i.e., simple sequence repeats. ISSR has an advantage over other molecular markers with its simplicity, fastness, reliability, low cost and most of all it does not require any prior sequence information (Huang and Sun, Citation2000; Sarma and Tanti, Citation2017).
Assam, a state of northeast India is bestowed with rich banana diversity. Very few popular commercial varieties like Chenichampa, Jahaji, Kachkol, etc. have been well characterized. However, a large number of traditional banana are still largely unexplored and noncommercialized (Borborah et al., Citation2016b, Citation2016c). Therefore, genetic diversity analysis and to establish the phylogenetic relationship would be a boon for bioprospection and further popularization of the underutilized banana resources of this region. The present investigation reported the comparison of different morphological traits and ISSR analyses for the comparative assessment of genetic variations among 14 accessions of underutilized cultivars of Musa L. from Assam, India.
Materials and Methods
Plant Materials
Extensive fieldwork involving the collection and documentation of members of Musa L. was conducted covering different agro-climatic zones of Assam, India (). Morphometric analysis was done in the field and the suckers were transferred to Gauhati University Botanical Garden for maintenance and conservation of the germplasm. Fresh leaf samples were collected from each accession and subjected to DNA extraction.
Table 1. List of Musa cultivars with vernacular names, genome groups along with coordinates and altitude of their collection sites
Assessment of Morphological Markers of Musa Accession
In this study, banana germplasm was collected from different agroclimatic zones of Assam viz., Upper Brahmaputra valley, Lower Brahmaputra Valley, Central zone, Barak Valley and Hill zone. Most of the morphological data were recorded in their natural habitat. Male inflorescences were used for recording the reproductive parameters. A total of 50 morphological markers were scored across 14 Musa genotypes. The morphological descriptors taken during the study were pseudostem height, pseudostem aspect, pseudostem color, underlying pseudostem, number of suckers, sap color, petiole length, blotches at the petiole base, blotches color, petiole canal leaf III, leaf blade length, leaf blade width, leaf blade base, the shape of leaf blade base, peduncle length, peduncle width, peduncle color, peduncle hairiness, bract apex, male bract shape, bract behavior before falling, male bract lifting, male bract length, male bract breadth, bract base shape, the color of bract external face, wax on the bract, bract color fading, male flower length, compound tepal basic color, free tepal appearance, free tepal apex, free tepal shape, filament color, anther color, stigma color, ovules, bunch shape, bunch appearance, rachis position, bract scars on rachis, number of hands per bunch, number of fingers per hand, length of the fruit, length of the fruit pedicel, the diameter of the fruit, transverse section of the fruit, fruit apex, remains of flower relicts at fruit apex and adherence of the fruit peel (Simmonds and Shepherd, Citation1955).
Mature plant with emerging inflorescence was taken for morphological characterization and scoring as this state is regarded as the maximum developmental state where most vegetative characters can be easily observable. A total of 50 morphological markers commonly available across 14 noncommercial banana cultivars were scored, each of the traits was evaluated using ranks ranging from 1 to 10. Traits related to color were examined using a standard color chart and for continuous quantitative characters, mean values were taken (IPGRI, Citation1996). Hierarchical cluster analysis and principal component analysis were carried out in SPSS software (version 22).
DNA Extraction and Quantification
For extraction of total DNA, tender leaf samples of 14 accessions of noncommercial Musa germplasm used in this study were taken, as young leaves are considered to be the best source for isolation of genomic DNA, due to a lesser amount of secondary metabolites as compared to mature leaves of the trees. Leaf tissues of 1.0 g were grounded into powder and DNA was recovered by modified cetyltrimethylammonium bromide (CTAB) method (Doyle and Doyle, Citation1987); by adding 1% polyvinyl pyrrolidone (PVP) and 1% β-mercaptoethanol (β-ME) to the extraction buffer to inhibit phenolic compound interruption, and extracted DNA was purified with RNase (Kumar et al., Citation2017b; Sambrook et al., Citation1989).
Extracted DNA was quantified by visual comparison with a DNA standard under UV light followed by electrophoresis on a 1% Agarose gel in 1X TAE buffer containing 0.5 mg/mL of ethidium bromide for 30 min by running 2 µL of DNA from each sample.
PCR Amplification for ISSR Analysis
PCR amplification was carried out for ISSR analysis using a panel of seven ISSR primers obtained from Operon Technologies Inc., CA, USA. The primers used in this study are listed in .
Table 2. List of ISSR primers with sequences
PCR amplification was performed in 25 µL reaction volume contained 50 ng of DNA template, 2.5 µl 1X assay buffer, 1 U Taq DNA polymerase, 0.2 mM dNTPs, 1.5 mM MgCl2, 5 pmol of primers using a Thermal Cycler (Bio-Rad, USA) for every primer. PCR ingredients were provided from Thermo-Technologies. PCR amplification conditions were as 94°C for 5 min followed by 35 cycles of 94°C (30 s)/42°C (45 s)/72°C (45 s), and a final extension at 72°C for 10 min. Separation of the amplification product was carried out in 1.5% agarose gel for 45 min in 80 V.
Data Analysis for Genetic Diversity
The ISSR bands were scored manually and converted to binary data as ‘1ʹ (band present) or ‘0ʹ (band absent). Only distinct reproducible, well-resolved and unambiguous bands showing polymorphism were used in the analysis. The number of polymorphic bands in the total number of bands was computed as % polymorphism, and PIC (polymorphic information content) values for each marker were calculated (Roldan-Ruiz et al., Citation2000). The pairwise genetic similarities among accessions were calculated from ISSR marker data using Jaccard’s coefficient (Jaccard, Citation1908). The resulting similarity matrix data were used to construct the dendrogram using the unweighted pair group method with arithmetical averages (UPGMA) method. All the analysis was performed using NTSYS-pc version 2.2 (Williams et al., Citation1990). Further, a two-way Mantel test was carried out to compare the two similarity matrix obtained from the morphological marker and ISSR-based molecular marker.
Results
Cluster Analysis of Musa Cultivars Based on Morphological Marker
A total of 50 morphological markers commonly available across 14 noncommercial underutilized banana cultivars of Assam (India) were scored. However, as two characters (transverse section of fruit and bunch shape) showed no polymorphism across all experimental cultivars, 48 traits have been used for further study. Morphological characteristic data for each genotype analyzed hierarchically to group them into different clusters and subclusters based on the similarity matrix. The dendrogram constructed using the morphometric markers was distinctly divided into two clusters. Cluster I further subdivided into four subclusters; Ia, which comprised of Assamiya-malbhog and Ximalu-monohar; subcluster Ib included three cultivars (Bharatmoni, Katiya-jahazi, and Bangali-malbhog); while both Ic and Id included only one cultivar each, i.e.,, Guwahatiya-kol and Adeel kol respectively. In contrast, Cluster II was divided into three subclusters. Subcluster IIa included Athiya-kol, Bogi-monohar and Bokmoni, IIb included Abor-monohar, Fessa monohar, and Gobin tulshi, while IIc included only a single cultivar (Jati kol) ().
Figure 1. Cluster analysis of 14 noncommercial Musa accessions based on the 50 morphological markers
Two-Dimensional Principal Component Analysis
Two-dimensional PCA was performed using 14 banana accession based on 48 different morphometric markers. The cluster analysis was mostly correlated with PCA.
The principal component analysis (PCA) was carried out to investigate the various traits that played a key role in phenotypic diversity among the banana cultivars. Ten principal components (PCs) were observed with the Eigen values of more than 1. Original Eigen values were the factor variances since the factor analysis was carried out on the basis of the correlation matrix, the variables were standardized, meaning that each variable had a variance of 1, and the total variance was equal to the number of variables used in the analysis.
PC1–PC10 contributed variations of 38.60%, 15.12%, 11.50%, 7.12%, 5.68%, 5.29%, 4.57%, 3.73%, 3.46%, and 2.45% respectively with cumulative contribution of 97.52% variations. It was revealed that the first eight PCs jointly accounted for 91.61% (>90%) of the total variations among all the experimental cultivars. Out of all, 48 morphological descriptors revealed notably major contribution to PC1.
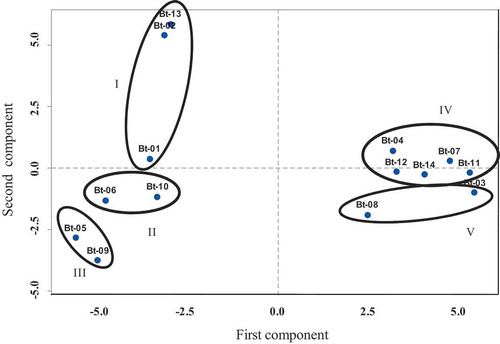
The two-dimensional PCA revealed the presence of five groups. Group I comprises Bharatmoni, Bokmoni, and Bengali malbhog. Group II and Group III include two accessions each namely Abor-monohar, Assamiya-malbhog and subsequently Gobin tulshi, Katiya-jahaji. Banana accessions Adeel kol, Ximolu monohar, Bogi monohar, Guwahatiya kol, and Athiya kol were included in Group IV. Group V, on the other hand, encompasses two banana accessions Jatikol and Fessa monohar ().
Figure 2. Two-dimensional PCA analysis of bannana accession based on 50 different morphometric markers
ISSR Marker Analysis
A panel of seven primers was selected to determine the genetic variations of 14 banana cultivars (Son et al., Citation2013). Only distinct and well-resolved bands were scored as absent or present for each of the ISSR primers with 14 Musa accessions. A total of 62 bands were detected of which 56 bands were polymorphic (89.66%). The highest number of the band was detected by the primer UBC-843 with an average PIC value of 0.38 and the lowest number of the band was observed by UBC-848 with an average PIC value of 0.41. PIC values were calculated for each primer, the PIC values range from 0.34 to 0.47 with a mean average of 0.4 (; ).
Table 3. List of primers, number of amplified fragments showing percentage of polymorphism generated by ISSR markers
Figure 3. ISSR profiles for 14 noncommercial Musa accessions using primer A. UBC-812, B. UBC-814, C. UBC-818, D.UBC-836, E. UBC-840, F.UBC- 843, G.UBC −848; M = Molecular marker, Lanes 1. Bharatmoni(AAA), 2. Bokmoni, 3. Jatikol(AAB), 4. Adeel, 5. Gobin-tulashi(AAB), 6. Assamiya malbhog(AAB), 7. Guwahatiya kol, 8. Fessa-monohar(ABB), 9. Katiya jahaji(AAA), 10. Abor malbhog(AAB), 11. Athiya kol(BB), 12. Ximalu monohar(ABB), 13. Bangali malbhog(AAB), 14. Bogi monohar(ABB)
Cluster Analysis for ISSR Marker
A total of 56 polymorphic bands were used to estimate the Jaccard’s similarity coefficient and cluster analysis. Dendrogram produced from the cluster analysis showed the clear division of the genotypes into two distinct clusters. Seven accessions of M. acuminate × M. balbisiana,i.e.,, Bharatmoni, Assamiya-malbhog, Gobin tulashi, Bokmoni, Bangali-malbhog, Katiya-jahaji, and Abor-malbhog were clustered in the first group. The second group contained the accessions viz. Jatikol, Adeel, Guwahatia-kol, Fessa-monohar, Athiya kol, Ximalu-monohar, and Bogi-monohar (). Jaccard’s similarity values for all the banana accessions ranged from 0.28 to 0.77 with an average of 0.51 (). The lowest genetic similarity (0.28) was observed between Gobin tulashi and Athiya kol whereas the highest genetic similarity (0.77) was observed between Ximalu-monohar and Bogi-monohar.
Table 4. Mean of the ISSR-based pairwise genetic diversity estimates (GDEs) between 14 noncommercial banana cultivars using ISSR primers
Figure 4. UPGMA cluster analysis of 14 noncommercial Musa accessions based on ISSR data generated by seven primers
Three-Dimensional Principal Component Analyses
A relationship among the 14 accessions was detected by PCA based on ISSR data. The positions of the 3-D plot showed fundamentally consistent and exhibited a similar pattern of clustering of dendrogram that stipulated notable genetic variations among banana accessions. It was confirmed from ISSR markers that all the 14 accessions were fairly scattered on the plots of PCA reflecting a superior genetic base. PCA study revealed that banana accessions incorporated in specific clusters were grouped together in a PCA plot. The plot spotted in three-dimensional PCA was accordant with the clustering pattern of the dendrogram, which indicated that the accessions were relatively dispersed on PCA plots. Here, the 14 banana accessions were classified into four groups. Group I contains Guwahatiya kol, Ximolu monohar, Athia kol, Fessa monohar, Bogi monohar, Adeel kol, and Jati kol. Group II and IV include two banana accessions each viz, Bokmoni, Bangali malbhog, and Katiya jahaji, Abor malbhog. Group III comprises of Gobin tulshi, Bhartamoni and Assamiya malbhog ().
Figure 5. 3-D principal component analysis (PCA) of 14 noncommercial bananas showing relationships based on ISSR data
Further, the two-way mantel test was carried out using Ntsys Software Version 2.2 to compare the two similarity matrix obtained from the morphological marker and genotyping marker. A high value of matrix correlation was shown (0.80164). The Mantel test showed that morphological markers and molecular markers were correlated; thus, it could be manifested that morphological differences showed a positive correlation with the ISSR profiling.
Discussion
Since there is no particular season of flowering/fruiting time for Musa species, the field works have been carried out randomly throughout the year. However, it is observed that the flowering and fruiting in the genus occurs throughout the year but few comparatively prevalent during monsoon (June–September) as compared to the winter season. This observation is also in concordant with few earlier reports (Borborah et al., Citation2016b, Citation2016c, Citation2020).
Out of the 50 morphological traits, 17 traits were quantitative and 23 were qualitative where each trait scored from 1 to 10 scale (IPGRI-INIBAP/CIRAD, Citation1996). Morphological traits have been found as useful parameters for identifying 14 noncommercial banana cultivars, but their close genetic and morpho-environmental associations have been identified as a major obstacle that can be overcome with marker-based genotypical analysis (Rohlf, Citation2000). A similar study has been done on 16 Malaysian wild M. acuminata population using 46 morphological characters and also found out that the quantitative characters were unstable (Javed et al., Citation2002). A study conducted on 12 Brazilian banana accessions based on their morphological descriptors and RAPD markers showed that morphological descriptors can be used for the identification of varieties. However, the molecular markers reported clustering behavior similar to the morphological descriptors for some accessions as similar to our experiment (Jesus et al., Citation2009).
Molecular markers have been extensively used for the assessment of genetic diversity in Musa germplasm using different molecular techniques (Opara et al., Citation2010). However, ISSR marker-based phylogenetic analysis has been recognized as suitable for discrimination of Musa cultivars at the molecular level (Ortiz, Citation1997). In the present study, we have used the ISSR marker to study the genetic relatedness among 14 noncommercial banana accessions of Assam. ISSR marker system in our study showed polymorphisms of 89.66% which was adequate to distinguish the individuals precisely (Nahar et al., Citation2020). Each primer could generate polymorphism among the accessions, which may be due to mutation at priming sites. The level of divergence also related to the nature and the sequence repeat of the primers (Zietkiewicz et al., Citation1994). In our investigation, the overall results of ISSR analysis reflected the occurrence of remarkable diversity among 14 cultivars which is in agreement with some earlier reports (Opara et al., Citation2010; Wong et al., Citation2001).
A distance matrix was established for both morphological and molecular analysis and compared by the Mantel matrix correspondence test. Environmental parameters often play a strong role in morphological expressions in the plants, which may not be correlated sometimes with the molecular markers due to the changes at the non-coding sequences. This is the reason that makes these features comparatively less reliable and not sufficient enough for accurate differentiation among very close genotypes and the analysis of genetic relatedness (Opara et al., Citation2010).
However, phenotypic traits are always useful for easy identification, which can be exploited as an extensive approach for measuring genetic relatedness among different germplasm (Reddy et al., Citation2002). In this present investigation, the Mantel test confirmed the significant correlation between morphological and molecular markers. The result suggested that both the marker systems showed a similar level of genetic relations among the experimental banana cultivars. The strong correlation confirmed the presence of a multi-locus association between both the marker systems among these banana accessions. Here, ISSR markers were found to be efficient parameters of morphological variations (Marti et al., Citation2007). Our results suggested that ISSR analysis along with phenotypic assessment could be successfully employed to determine the genetic diversity and relatedness among banana cultivars with accuracy. Therefore, this approach based on morphological traits and molecular markers would be useful for breeding purposes and to improve the banana germplasm.
Conclusion
Gene pool provides a valuable resource for the improvement of the crops. Knowledge on the genetic background of banana elevated its use in future breeding and selection approaches. From the present investigation, it has been shown that all the accessions exhibit a wide variation in the morphological characters. The ISSR markers revealed high level of polymorphism in the experimental banana accessions. The PCA analysis and phylogenetic data obtained from the ISSR markers showed a significant relatedness among the large no Musa cultivars. Molecular technology, together with phenotypic traits can assist in overcoming the problems in developing superior banana cultivars. This study would be an effective approach for the selection of suitable banana germplasm of Assam for the further banana improvement program.
Acknowledgments
Funding support received from the Department of Biotechnology (DBT), Govt. of India, for the research project entitled “Collection, evaluation, documentation and conservation of banana genetic resources from north eastern region” vide sanction No. 102/I.F.D/SAN/1765-1767/2017-2018 dated 20. 07. 2017 is greatly acknowledged.
Additional information
Funding
References
- Agoreyo, B.O., K.D. Golden, and S.E. Brown. 2008. Analysis of genetic variability among plantain cultivars (Musa paradisiaca L.) using arbitrarily primed PCR technique. Afr. J. Biotechnol. 7:1041–1045.
- Barman, P., A.K. Handique, and B. Tanti. 2014. Tagging STMS markers to Fusarium wilt race-1 resistance in chickpea (Cicer arietinum L.). Indian J. Biotechnol. 13:370–375.
- Bhat, K.V., and R.L. Jarret. 1995. Random amplified polymorphic DNA and genetic diversity in Indian germplasm. Gen. Res. Crop Evol. 42:107–118.
- Borborah, K., K. Deka, D. Saikia, S.K. Borthakur, and B. Tanti. 2020. Habitat distribution mapping of Musa flaviflora Simmonds-a wild banana in Assam, India. Acta Ecol. Sinica. doi: 10.1016/j.chnaes.2020.02.
- Borborah, K., S.K. Borthakur, and B. Tanti. 2016a. Ornamentally important species of Musa L. (Musaceae) in Assam, India. J. Ecol. Taxo. Bot. 40:1–8.
- Borborah, K., S.K. Borthakur, and B. Tanti. 2016b. A new variety of Musa balbisiana Colla from Assam, India. Bangladesh. J. Plant Taxo 23(1):75–78.
- Borborah, K., S.K. Borthakur, and B. Tanti. 2016c. Musa balbisiana Colla-Taxonomy, Traditional knowledge and economic potentialities of the plant in Assam, India. Indian J. Trad. Knowledge 15(1):116–120.
- Brown, N., S. Venkatasamy, G. Khittoo, T. Bahorun, and S. Jawaheer. 2009. Evaluation of genetic diversity between 27 banana cultivars (Musa spp.) in Mauritius using RAPD markers. Afr. J. Biotechnol. 8:1834–1840.
- Chowdhury, U., B. Tanti, P. Rethy, and P.R. Gajurel. 2014. Analysis of genetic diversity of certain species of piper using RAPD-based molecular markers. Appl. Biochem. Biotechnol. 174(1):168–173.
- Doyle, J.J., and J.L. Doyle. 1987. A rapid DNA isolation procedure for small quantities of fresh leaf tissue. Phytochem. Bull. 9:11–15.
- Hore, D.K., B.D. Sharma, and G. Pandey. 1992. Status of banana in North-East India. J. Ecol. Taxo. Bot. 16(2):447–455.
- Huang, J., and S.M. Sun. 2000. Genetic diversity and relationships of sweet potato and its wild relatives in Ipomoea series Batatas (Convolvulaceae) as revealed by inter-simple sequence repeat (ISSR) and restriction analysis of chloroplast DNA. Theory Appl. Gen. 100:1050–1060.
- IPGRI-INIBAP/CIRAD. 1996. Descriptors for bananas (Musa spp.). International Plant Genetic Resources Institute (IPGRI, Rome, Italy; Montpellier; International Network for the Improvement of Banana and Plantain (INIBAP), Montpellier, France, p. 55. Centre de Cooperation Internationale en Recherche Agronomique pour le Development (CIRAD), France.
- Jaccard, P. 1908. Nouvelles recherches sur la distribution florale. Bull. Soc. Vaudoise Sci. Nat. 44:223–270.
- Jain, P.K., M.L. Saini, H. Pathak, and V.K. Gupta. 2007. Analysis of genetic variation in different banana (Musa species) variety using random amplified polymorphic DNAs (RAPDs). Afr. J. Biotechnol. 6(17):1987–1989.
- Javed, M.A., M. Chai, and R.Y. Othman. 2002. Morphological characterization of Malaysian wild banana Musa acuminata. Biotropia 18:21–37.
- Jesus, O.N., F.F. Cláudia, O.S. Sebastião, R.C. Terezinha, S.L. Taliane, and N.P. Kátia. 2009. Characterization of recommended banana cultivars using morphological and molecular descriptors. Crop Breed. Appl. Biotechnol. 9:164–173.
- Kumar, S., B. Tanti, B.L. Patil, and L. Sahoo. 2017b. RNAi-derived transgenic resistance to Mungbean yellow mosaic India virus in cowpea. PLoS ONE 12(10):e0186786. doi: 10.1371/journ.
- Kumar, S., B. Tanti, S.K. Mukherjee, and L. Sahoo. 2017a. Molecular characterization and infectivity of Mungbean Yellow Mosaic India virus associated with yellow mosaic disease of cowpea and mungbean. Biocat. Agri. Biotechnol. 11:183–191.
- Marti, J., J. Bort, and G.A. Slafer. 2007. Can wheat yield be assessed by early measurements of normalized difference vegetation index? Ann. Appl. Biol. 150:253–257.
- Nahar, S., L. Lahkar, M.A. Islam, D. Saikia, Z.M. Shandilya, L.R. Vemireddy, L. Sahoo, and B. Tanti. 2020. Genetic diversity based on osmotic stress tolerance-related morpho-physiological traits and molecular markers in traditional rice cultivars. Biologia. doi: 10.2478/s11756-020-004.
- Opara, U.L., D. Jacobon, and N.A. Al-Saady. 2010. Analysis of genetic diversity in banana cultivars (Musa cvs.) from the South of Oman using AFLP markers and classification by phylogenetic, hierarchical clustering and principal component analyses. J. Zhejiang Univ.-Sci. B (Biomed. Biotechnol.) 11(5):332–341.
- Ortiz, R. 1997. Morphological variation in Musa germplasm. Gene Res. Crop Evol. 44:393–404.
- Ploetz, R.C., A.K. Kepler, J.S. Daniells, and C. Nelson. 2007. Banana and plantains- an overview with emphasis on Pacific island cultivars. In: C.R. Elevistch. ed.. Species profile for Pacific island Agroforestry, pp. 1-26. Permanent Agricultural Resources, Holualon. Hawai. http://www.agroforestry.net/tti/Banana-plantain-overview.pdf
- Rahman, A., B. Tanti, G.C. Sarma, and J. Kalita. 2012. Genetic diversity of Persea bombycina from Goalpara district of Assam. India. Adv. Biol. Biotechnol. 3(1):20–24.
- Reddy, M.P., N. Sarla, and A.E. Siddiq. 2002. Inter simple sequence repeat (ISSR) polymorphism and its application in plant breeding. Euphytica 128:9–17.
- Rohlf, F.J. 2000. NTSYS-pc: Numerical Taxonomy and Multivariate Analysis System Version 2.1. Exeter Publishing Setauket, New York.
- Roldan-Ruiz, I., J. Dendauw, E. VanBockstaele, A. Depicker, and M.D. Loose. 2000. AFLP markers reveal high polymorphic rates in rye grasses (Lolium spp.). Mol. Breed 6:125–134.
- Sambrook, J., E.F. Fritschi, and T. Maniatis. 1989. Molecular cloning: A laboratory manual. Cold Spring Harbor Laboratory Press, New York.
- Sarma, B., and B. Tanti. 2017. Analysis of genetic diversity of certain species of Aristolochia using ISSR-based molecular markers. Cur. Life Sci. 3(4):47–53.
- Simmonds, N.W., and K. Shepherd. 1955. The taxonomy and origins of the cultivated bananas. J. Linnean Soc. London 55:302–312.
- Son, J.H., K.H. Kim, S. Shin, H.S. Kim, N.S. Kim, J.N. Hyun, S.I. Shim, C.K. Lee, K.G. Park, and C.S. Kang. 2013. ISSR-derived molecular markers for Korean wheat cultivar identification. Plant Breed. Biotechnol. 1(3):262–269.
- Ude, G., M. Pillay, and D. Nwakanma. 2002. Analysis of genetic diversity and sectional relationships in Musa using AFLP markers. Theoretical Appl. Gen. 104:1239–1245.
- Williams, J.G.K., A.R. Kubelik, and K.J. Livak. 1990. DNA polymorphisms amplified by arbitrary primers are useful as genetic markers. Nucleic Acids Res. 18:6531–6535.
- Wong, C., R. Kiew, J.P. Loh, L.H. Gan, O. Set, S.K. Lee, S. Lum, and Y.Y. Gan. 2001. Genetic diversity of wild banana Musa accuminata Colla in Malaysia as evidenced by AFLP. Ann. Bot. 88:1017–1025.
- Zietkiewicz, E., A. Rafalski, and D. Labuda. 1994. Genome fingerprinting by simple sequence repeat (SSR) – Anchored polymerase chain reaction amplification. Genomics 20:176–183.