
 ?Mathematical formulae have been encoded as MathML and are displayed in this HTML version using MathJax in order to improve their display. Uncheck the box to turn MathJax off. This feature requires Javascript. Click on a formula to zoom.
ABSTRACT
The correlation between the functional and chemical properties of U. kirkiana fruit pulp was studied. The functional and chemical properties of the fruit pulps were determined and data were analyzed by regression and principal component analysis (PCA) to show correlations and variances. Results showed a 51.4% variance, PC 1 had a 37.31% variance. PC 2 showed a 14.17% variance. Antioxidant activity (AOA), Cu, vitamin C, total titratable acid (TTA), and Mg had a positive variance in PC 1. TTA and pH were significant and correlated in PC 1. Titratable acidity and pH had a variability of 69% and 74%. Iron and Ca were significant and correlated in PC 2. Phosphorus and AOA were positively correlated. Pulp yield had a weak positive correlation with dry matter, Ca, K, and Zn content. Fruits from Bikita were grouped according to pH levels, AOA, Cu, vitamin C, TTA, and phosphorus content. Fruits in Kazangarare were high in Fe and Ca and grouped together. Magnesium content was significant in fruits obtained from Gokwe. Phosphorus and TTA had significant effect (p < 0.01; p < 0.05) on pulp yield. The results provide useful data about relationship, chemical composition variation of U. kirkiana fruit pulp obtained at the different regions of Zimbabwe.
Introduction
Uapaca kirkiana (Euphorbiaceae) fruit tree is an underutilized indigenous fruit tree (IFT) that is well adapted to the miombo ecological zone in sub-Saharan Africa (Akinnifesi et al., Citation2004; Bille et al., Citation2013; Nhukarume et al., Citation2010; Saka et al., Citation2004). In Zimbabwe, the fruit tree is mainly distributed in semi-arid and arid areas although it can grow in relatively wet areas (Chawafambira et al., Citation2020). The fruits ripen during October – February (Mithofer and Waibel, Citation2003) and are known by different names as wild loquat in English, msuku in Malawi, Tanzania, and Zambia, and mushuku, muzhanje or mahobohobo in Zimbabwe (Akinnifesi et al., Citation2004; Chawafambira et al., Citation2020). The fruit is oval shaped, containing seeds (Moombe et al., Citation2014), and a sweet yellowish pulp (Maroyi, Citation2013).
Of the five naturally occurring Uapaca spp in sub-Saharan Africa, U. kirkiana spp fruits are commonly consumed and provide a good source of sugar, energy, and essential minerals (Akinnifesi et al., Citation2008; Ndabikunze et al., Citation2010; Vinceti et al., Citation2013). Fallen ripe fruits are collected from the ground and/or harvested directly from the tree. (Akinnifesi et al., Citation2004; Mithofer and Waibel, Citation2003). In most areas of Zimbabwe ripe fruits are sold by street vendors along the roadside and in rural and urban markets in Sub-Saharan Africa (Chawafambira et al., Citation2020). It is a useful supplement (Mithofer and Waibel, Citation2003; Mpofu et al., Citation2014) and a socio-economic importance among the rural and urban dwellers. Furthermore, the fruits are fermented in Zambia to brew wine (masuku) (Muchuweti et al., Citation2006). Traditionally wild fruits of sub-Saharan Africa have a history of being safe, nutritious, and affordable (Mpofu et al., Citation2014).
The consumption of fruits has increased and became more important because of their health benefits and presence of vitamins, essential minerals, and fibers, contributing to the prevention or slowing down the progression of cardiovascular diseases and some form of cancer (Bowen-Forbes et al., Citation2010; Tsantili et al., Citation2010). The presence of antioxidant phytochemicals, vitamin C and E, flavonoids, and carotenoids as non-enzymatic antioxidants offers protective effect and possibly body beneficial effect (Silva et al., Citation2010; Wolfe et al., Citation2008).
There are many inter-related factors that influence the functionality and chemical composition of the fruit. Hence, the application of multivariate tools (Maji and Shaibu, Citation2012) to determine their correlations (Abbe et al., Citation2017) becomes important. Wall (Citation2006) reported that geographic region and mineral composition of the soil on which the fruit tree grows can affect the nutritional and mineral content of its fruits. It is also important to determine to relationships between climatic conditions and fruit compositions. This study is aimed at determining the correlations between functional and chemical properties of U. kirkiana fruit pulp collected from different areas and show any significant differences in the variations.
Materials and Methods
Fruit Collection
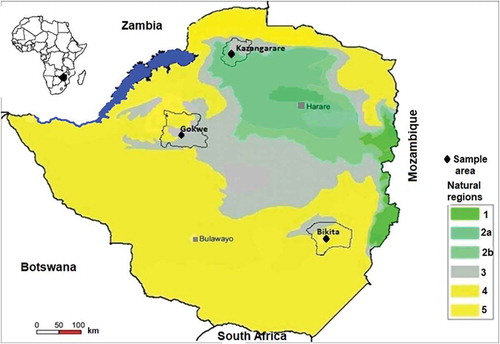
Ripe U. kirkiana fruits were collected from domesticated trees in Gokwe (a semi-dry region located 18.22°S 28.93°E in Agro farming region 4 and has regosol and basaltic vertisol soils), Bikita (a dry region located 20.5 S° 31.37° E in Agro farming region 4), and Kazangarare (an area located 16.30°S 29.56°E in Agro farming region 3) in Zimbabwe (). Permission to carry out the study was granted local leaders (councilors) and consent form was signed by participating families. Fruit trees were chosen randomly using a stratified sampling method. In each area, 10 domesticated trees were selected from a total of 5 wards. In each ward, two domesticated fruit trees were randomly selected from trees belonging to families that were willing to participate in this study. Samples of 100 ripe fruits that had fallen from different parts of the tree were randomly collected from the ground. A total of 1000 fruits with a total mass of 8 kg were collected in each area. Each area represented a treatment, making a total of three treatments. The fruits from each treatment (area) were transported in clean polythene bags and were stored at room temperature (25°C) in a laboratory.
Figure 1. Map showing sampling areas (Bikita, Gokwe, and Kazangarare) of U. kirkiana fruits in Zimbabwe
Sample Preparation
Fruits from each sample area were separated into three sub-groups of 330 fruits and each group represented a replication. The fruits were cut open and the seeds and skins were removed. The fruits were pulped using a mortar and pestle, and the crude pulp mixture was sieved through an 800 μM sieve in the laboratory to obtain a composite pulp sample from each area. The fruits were weighed before and after pulping to determine the pulp yield. The pulped samples from each area were analyzed for the following properties: pH, total soluble solids (TSS), total titratable acid, dry matter, mineral content, pulp yield, antioxidant activity, and vitamin C. All results were expressed in fruit fresh mass (FM).
pH Measurement
The pH was determined according to the Association of Official Analytical Chemistry (AOAC) standard method using a digital pH meter (BT-675, BOECO, Hamburg, Germany). The glass electrode of the pH meter was calibrated using standard buffer solutions (pH 4 and pH 7) prior to pH measurements (AOAC, Citation2000).
Total Soluble Solids
Total soluble solids (TSS) content of the U. kirkiana pulp were determined according to AOAC standard method (Association of Official Analytical Chemistry, Citation2000) using a bench brix refractometer (MA871, North Carolina, Milwaukee Instruments, USA) and distilled water was used to calibrate and rinse-off residual sample after each reading.
Dry Matter
Dry matter was determined using a method adopted by Magaia et al. (Citation2013). A 2 g sample was dried in an automatic oven in a crucible and incubating at 100°C overnight until constant moisture loss.
Determination of Vitamin C
Ascorbic acid concentration was determined by the dichlorophenolindophenol (DCPIP) titration test according to a method adopted by Nyanga et al. (Citation2013). DCPIP solution was prepared by dissolving 0.25 g of 2, 6-DCPIP in 500 mL of distilled water. Exactly 0.21 g of sodium bicarbonate was then added to the solution and allowed to dissolve. The resulting solution was finally diluted to 1 L with distilled water. Ten grams of the fruit pulp was placed into a 100 mL volumetric beaker and mixed with 40 mL of 5% acetic acid. After 20 min, water was added to 100 mL. The resulting solution (with sample) was then titrated against the prepared standard DCPIP.
Total Titratable Acidity
Pulp acidity (expressed as total titratable acidity) was determined according to AOAC standard method by titrating 10 g of sample dissolved in 100 mL distilled water against 0.1 M NaOH solution. Development of a pink color was recorded as the end point using phenolphthalein as an indicator (Association of Official Analytical Chemistry, Citation2000).
Antioxidant Activity
The radical scavenging activity was determined using a method adopted by Kuda et al. (Citation2005). Methanolic solution of DPPH (1.5 mL, 1 mM) was mixed with 0.1 mL sample and incubated at 25°C for 25 min. The sample was mixed at five equal time intervals during the incubation period. The absorbance was determined at 517 nm on a Spectronic Genesys Spectrophotometer (Genesys 5, Thermo Fisher Scientific, Waltham, Massachusetts, USA) after calibration with methanol. Ascorbic acid (0.1 M) was used as a reference control. The scavenging activity was calculated as the percentage decrease in absorbance with time using the following equation:
where Abcontrol = Absorbance of control; Absample = Absorbance of sample
Mineral Content Analyses
Iron and Zn contents were determined according to a method adopted from Altundag and Tuzen (Citation2011) using an Inductively Coupled Plasma-Optical Emission Spectrometer (ICP-OES) (Agilent 5100, Agilent Technologies, Santa Clara, California, USA), which allows for simultaneous detection of minerals. A fruit pulp sample was digested using concentrated solutions of nitric acid (HNO3) and sulfuric acid (H2SO4), followed by the addition of ultrapure hydrogen peroxide (H2O2) to complete digestion. Residual pulp samples were filtered off where necessary. The digested pulp samples were then fed into the automated ICP-OES by vacuum-operated pipes and results were recorded. Data were standardized per 100 g fresh pulp mass.
Statistical Analysis
Regression analysis was performed on the data using the XLSTAT statistical computer package (Version 2015.04.36025). Pearson’s correlation coefficients were used to show the correlations. Principal component analysis (PCA) was used to determine variances.
Results and Discussion
Physicochemical and Functional Properties
The results for the physicochemical properties of the fruit pulps collected from the three areas are detailed in . Most of the functional and chemical properties parameters measured showed a significant effect (p < 0.05). The highest pulp pH content was obtained from fruits obtained from Gokwe higher than Gokwe and Kazangarare. The antioxidant activity showed that fruits from Bikita had a relatively higher activity of 36.68 ± 0.46% but it was not significantly different from Gokwe fruits. Mapunda and Mligo (Citation2019), observed a flavonoid content of 55.97 ± 4.36 mg RE/100 g fresh fruit sample. The high antioxidant activity could be explained by the presence of polyphenols in the fruit pulp. Fruits from Bikita had a high total phenolic content of 82.5 ± 0.01 µg GAE/g dry weight (unpublished work) as compared to other fruits obtained from other areas. Phenolic compounds contain hydroxyl groups which are hydrogen donors and react with nitrogen and oxygen of organic radicals. This reaction is important because it delays the oxidation of organic radicals and promotes health (Fardet et al., Citation2008). Mapunda and Mligo (Citation2019), reported a total phenolic acid content of 255.38 ± 23.80 mg GAE/100 g fresh weight for U. kirkiana fruits from Tanzania. Their result was very significant in the total phenolic content as compared to fruits obtained from Bikita, Gokwe, and Kazangarare in Zimbabwe. This is due to the drying process used in sample preparation. Drying of fruit pulp can cause degradation of phenolic compounds such as catechin, dihydroxybenzene, and gallic acid in fruit samples from Bikita, Gokwe, and Kazangarare thereby reducing the phenolic content. Furthermore, the differences in the soils and climatic conditions of the sample areas might have affected the total phenolic content of the fruits.
Table 1. Functional and chemical properties of U.kirkiana fruit pulp per 100 g edible portion
TTA was also better in Bikita and Gokwe regions. Our results on TTA and pH values were in agreement with other results by Ndabikunze et al. (Citation2010) who observed a TTA content of 0.5 g/100 g and pH (4.67). Fruit pH and TTA are important parameters that determine the organoleptic quality of the fruit (Bugaud et al., Citation2011; Harker et al., Citation2002). The relatively high mineral content of the fruit was observed in this study. Fruits from Kazangarare area had high Fe and Zn content of 12.16 ± 0.54 and 0.94 ± 0.13 mg/100 g, respectively (). Our results noted a no significant difference (p < 0.05) in the Zn content in all the fruits from the three treatment areas. The mineral values from our study were higher compared to mean values reported by Ndabikunze et al. (Citation2010) but were in agreement with values observed by Stadlmayr et al. (Citation2013) in the same fruit.
Likewise, the variation of most results in the chemical and functional properties of the fruit and other researchers may be attributed to differences in climatic regions, soil types, and methods of analysis. This is supported by Haque et al. (Citation2009) who reported that soil–plant interaction together with weather conditions of the area plays an important function in the growth and development of the plant. The author also noted that the nutritional composition of fruit varies from region to region within the same country because of changes in soil quality and climate (Haque et al., Citation2009). These differences in pulp composition have been other authors who noted the effect of climate (Rodriguez-Amaya et al., Citation2008), fruit maturity (Gull et al., Citation2012), and cultivar (Burlingame et al., Citation2009; Toledo and Burlingame, Citation2006a) as possible causal factors.
Principal Component Analysis
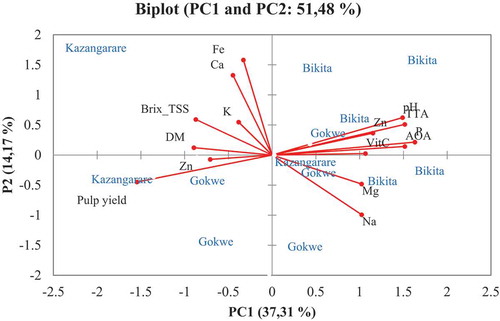
The factors in were used to develop the Principal component analysis model. The model was applied to determine the variances and to explain the relationships between the fruit pulp properties and sample area, and to identify any group patterns. Two principal components (PC) explained a 51.48% variance (37.31% for PC1 and 14.17% for PC 2). The factors that contributed to positive variance in PC 1 were pH, Vitamin C, antioxidant activity, total titratable acidity, Mg, Na, K, and Cu contents of the fruit pulp. Pulp yield contributed to negative variance in PC 1. In PC 1, pH and TTA were the most significant factors and were grouped together. Phosphorus and AOA were correlated and grouped together. Calcium and Fe content in the pulp contributed most to the most variability and Na content had a negative variance in PC 2.
Table 2. Principal component analysis of U. kirkiana fruit pulp properties
The biplot indicated that fruits from Kazangarare were grouped due to their Brix (TSS), K, pulp yield, and Fe and Ca content. Fruits obtained from Bikita had high contents in pulp pH, TTA, Cu, AOA, vitamin C, and phosphorus content. Our results also indicated that fruits from Gokwe tend to cluster together because of Mg content (). These results suggest that tree to tree variations, soil quality, genomic tree differences, and climatic conditions of the sampled areas have an effect on fruit pulp compositions.
Figure 2. Principal component biplot showing variation of fruit pulp characteristics collected from three regions of Zimbabwe
Correlation of Functional and Chemical Properties
The observed results in the study for correlation analysis revealed that the pH of the pulp had a significant positive correlation between TTA and AOA (). TTA had a positive correlation with phosphorus content (). Approximately 74% and 69% of the variation in pulp properties were attributed to pH (R2 = 0.74) and TTA (R2 = 0.69). The measurement of pH is a determinant of the concentration of free hydrogen ions, while the TTA measures the total amount of hydrogen ions in the pulp. Therefore, pH is not correlated with the concentration of acids present but is influenced by their ability to dissociate in solution. The pH of fruit pulp is an important factor in microbiological safety, determining the effectiveness of enzyme additions in fruit processing, influencing the solubility of proteins, and regulating the oxidative and browning reactions in fruits (Boulton et al., Citation1996).
Table 3. Analysis of variance model
Table 4. Model parameters for pulp yield (Standardized coefficients)
Table 5. Correlation matrix analysis for functional and chemical fruit pulp properties
Figure 3. The correlation between pH and AOA (a), and the correlation between pH and TTA (b)
Loquat fruits contain organic acids such as malic acid (84.5 mg/100 g), oxalic acid (2.7 mg/100 g), tartaric acid (9.0 mg/100 g), succinic acid (2.9 mg/100 g) (Chen et al., Citation2009; Toker et al., Citation2013) and citric acid (1.5 mg/100 g) when ripened (Seymour et al., Citation1993) and this can explain the total titratable acid observed. Malic acid accounts for >73% of the total organic acids in fruits (Toker et al., Citation2013). A study by Ding et al. (Citation1998) observed that malic acid is the principal acid contributing 90% of the total organic acid content in loquat fruits. A positive relationship between moisture content and TTA content in ripe fruits has been reported by other researchers (De La Hera-Orts et al., Citation2005; Des Gachons et al., Citation2004; Thakur and Singh, Citation2012). Ball (Citation1997) suggested that TTA decreases either by the fermentation process or breakdown of acids to sugars in fruits when they respire. This observation was also supported by Walton and De Jong (Citation1990) who noted that fruits that grow in higher temperatures have higher rates of respiration. Our results also correlate to these explanations in TTA contents because the U. kirkiana fruits were collected from a high-temperature area of Bikita (32°C max.) and Gokwe (31°C max.) during the summer period. Also, Crisosto and Crisosto (Citation2001) reported a rapid metabolism of organic acids when the fruit is first placed in storage under high temperatures.
Antioxidant activity had a positive correlation with pulp TTA content, Cu content, and phosphorus content (). TTA had a positive correlation with phosphorus as shown in . The results observed indicated that an increase in pulp- TTA would also increase the antioxidant activity in the fruit pulp. Furthermore, an increase in phosphorus content would significantly increase the antioxidant activity and TTA in the fruit pulp. An increase in Cu content in the pulp increases significantly the antioxidant activity of the pulp (). The variations noted in the antioxidant activity could be attributed to differences in fruit genotype variations, environmental conditions, geographical location of the fruit trees, and fruit harvest times (Cho et al., Citation2004; Zadernowski et al., Citation2005). More so, the presence of the different phenolic compound groups and their concentrations in the fruit pulps can result in the variations noted. This is supported by Kalt et al. (Citation2001) who reported that the presence of anthocyanins contributed to a more AOA in blueberries. Indeed, our results indicated that the ripe fruits had a high pulp antioxidant activity which can be explained by a high total phenolic content (67.0–82.5 µg GAE/g FM) in the fruit pulp (Unpublished work). Studies by Castrejón et al. (Citation2008) and Wang et al. (Citation2009b) reported that antioxidant compounds are mainly synthesized during the maturation process of fruits, from the unripe green stages until ripeness. Also, the differences in the maturity index of each fruit can have an effect on the concentration of antioxidant compounds.
Figure 4. The correlation between AOA and TTA (a), the correlation between AOA and phosphorus (b), the correlation between AOA and Cu (c), correlation between TTA and Phosphorus (d)
Iron content had a low positive correlation with Ca content, and a weak positive correlation with the Zn content in the fruit pulp (). The study observed that an increase in Fe content in the fruit gave a small increase in Zn concentration in the pulp. Furthermore, the results indicated that as Fe content increases in the fruit, Ca content in the pulp increases significantly (). The correlation results of Fe content and Cu content showed a weak positive correlation (). Results observed by Welch et al. (Citation1993) indicated that Cu plays an important role in the plasma membrane in enhancing Fe absorption and regulating the sulfhydryl groups in transport protein involved in divalent cation transport across the root cell.
Figure 5. The correlation between Fe and Ca and the correlation between Fe and Zn
Pulp yield showed a negative correlation with pH content and AOA. Pulp yield also exhibited negative correlations with TTA and phosphorus as shown in . These results can further be used to explain that as pulp-pH increases it negatively reduces pulp yield. An increase in phosphorus content negatively reduces pulp yield (). Pulp yield had a weak positive correlation with TSS (). Mehmood et al. (Citation2014) and Singh et al. (Citation2015) also reported a poor accumulation of TSS in guavas (Psidium guajava L) Myrtaceae. Consequently, Chiveu et al. (Citation2019) reported that pulp mass has a positive correlation with the fruit water content, indicating that much of the juicy pulp in fruits primarily consists of water. This explanation could be used to support our results by confirming that the weak positive correlation between the pulp yield and TSS is caused by the higher dilution effect of TSS with water in the pulp.
Figure 6. The correlation between pulp yield and pH (a) and the correlation between pulp yield and phosphorus (b)
Regression and ANOVA Analysis
Regression data for our study indicated that 75% (R2 = 0.758) of the variance in pulp yield is explained by both TTA and phosphorus content. This meant that only 25% of the variance is explained by other factors. Phosphorus content had a 66% (R2 = 0.663) variance on pulp yield. Different inorganic forms of phosphorus (H2PO4−, HPO4 2−, H3PO4) exist in the soil at a concentration of 0.1–10 μM. The P is actively taken up via transporter system in the roots due to the concentration difference between the soil and plant tissue (5–20 mM) (Shen et al., Citation2011). Phosphorus is vital in the synthesis of biomolecules and formation of high-energy molecules such as adenosine triphosphate (ATP), guanosine triphosphate (GTP), cytidine triphosphate (CTP), uridine triphosphate (UTP), phosphoenol pyruvate (PEP), and other phosphorylated intermediate compounds (Hina et al., Citation2018). Phosphorus is important in carbohydrate metabolism (Razaq et al., Citation2017). This could suggest the relationship with pulp yield since carbohydrates are the major component of the fruit pulp. The fruit pulp contains a carbohydrate content of 28.7 to 92 g/100 g edible portion (Chawafambira et al., Citation2020).
A simple linear regression was calculated to predict the pulp yield based on phosphorus b = 0.537, t (24) = −3.98, p < 0.001.
A linear regression to predict the pulp yield based on TTA, b = 0.415, t (24) = – 3.08, p < 0.005 Equationequation 2(2)
(2) represents the relationship between TTA and phosphorus contents in the pulp content.
Our results observed a significant difference using one way ANOVA at p < 0.05 on the effect of TTA and phosphorus on pulp yield as F (2, 24) = 37.631, p < 0.01, with R2 = 75.8. ANOVA model showed that only variables, TTA and phosphorus content in the fruit were significant (P < 0.001) in the model (). This implied that the overall regression model used in this study was significant (p < 0.05).
Model Parameters (Pulp Yield)
TTA content had a significant difference on pulp yield content (P < 0.005). Phosphorus content had a significant difference on pulp yield content (P < 0.001). All other pulp attributes had no significant effect on pulp yield content in the fruit ().
Conclusion
Principal component analysis showed a 51.4% variance. Two components were accepted and used in the study. There is a positive relationship between pH and TTA and pH and phosphorus contents in fruits. Seven factors in PC 1 were responsible for the positive variation. Pulp yield is negatively affected by the pulp-pH levels. Fruits from Bikita grouped together toward positive factors in PC 1 (pH, TTA, Cu, AOA, phosphorus, and vitamin C). TTA and phosphorus content are significant (P < 0.01) in affecting the pulp yield. Antioxidant activity and phosphorus content of the pulp were correlated and grouped together on PC 1. The regression model was significant and 75% of the variance was attributed to pulp TTA and phosphorus. Environmental conditions have been observed to influence the functional and chemical properties in fruit pulps. The fruit is a good source of essential minerals and has good functionality characteristics. The good correlation of most functional and chemical properties in the pulp can aid in the processing of the fruit into many commercial products. Research prospects must be centered on the effects of genetic tree variations on the fruit pulp compositions and their correlations.
Additional information
Funding
Literature Cited
- Abbe, E., J. Fan, K. Wang, and Y. Zhong. 2017. Entry wise eigenvector analysis of random matrices with low expected rank. [online] Available at: https://arxiv.abs/1709.09565
- Akinnifesi, F. K., R. R. B. Leakey, O. Ajayi, G. Sileshi, Z. Tchoundjeu, and P. Matakala. 2008. Indigenous Fruit Trees in the Tropics: Domestication, Utilization and Commercialization. Columns Design Limited, Reading, UK.
- Akinnifesi, F.K., F. Kwesiga, J. Mhango, A. Mkonda, T. Chilanga, and R. Swai. 2004. Domesticating priority miombo indigenous fruit trees as a promising livelihood option for smallholder farmers in southern Africa. Acta Horticulture. 632:15–30. doi: 10.17660/ActaHortic.2004.632.1.
- Altundag, H., and M. Tuzen. 2011. Comparison of dry wet and microwave digestion methods for the multi element determination in some dried fruit samples by ICP-OES. Food Chem. Toxicol. Food Chem. Toxicol 49(11):2800–2807. doi: 10.1016/j.fct.2011.07.064.
- Association of Official Analytical Chemistry. 2000. Official method of analysis (AOAC) International. 17th ed. AOAC International, Maryland. USA.
- Ball, J.A. 1997. Evaluation of two lipid based edible coating for their ability to preserve post-harvest quality of green bell peppers. Master Diss., Faculty of the Virginia Polytecnic Institute and state University. Blacksburg, Virginia, USA.
- Bille, P., M. Shikongo-Nambab, and A. Cheikhyoussef. 2013. Value addition and processed products of three indigenous fruits in Namibia. Afr. J. Food Agric. Nutr. Dev. 13:7192–7212.
- Boulton, R.B., V.L. Singleton, L.F. Bisson, and R.E. Kunkee. 1996. Principles and practices of winemaking. Chapman & Hall, New York, 253–521.
- Bowen-Forbes, C.S., Y. Zhang, and M.G. Nair. 2010. Anthocyanin content, antioxidant, anti-inflammatory and anticancer properties of blackberry and raspberry fruits. J. Food Compos. Anal. 23:554–560. doi: 10.1016/j.jfca.2009.08.012.
- Bugaud, C., E. Deverge, M.O. Daribo, F. Ribeyre, B. Fils-lycaon, A. Mbeguine, and D. Mbeguine. 2011. Sensory characterisation enabled the first classification of dessert bananas. J. Sci. Food Agric. 91(6):992–1000. doi: 10.1002/jsfa.4270.
- Burlingame, B., R. Charrondiere, and B. Mouille. 2009. Food composition is fundamental to the cross-cutting initiative on biodiversity for food and nutrition. J. Food Compos. Anal. 22(5):361–365. doi: 10.1016/j.jfca.2009.05.003.
- Castrejón, A.D.R., I. Eichholz, S. Rohn, L.W. Kroh, and S. Huyskens-Keil. 2008. Phenolic profile and antioxidant activity of highbush blueberry (Vaccinium corymbosum L.) during fruit maturation and ripening. Food Chem. 109:564–572. doi: 10.1016/j.foodchem.2008.01.007.
- Chawafambira, A., M.M. Sedibe, A. Mpofu, and M. Achilonu. 2020. Uapaca kirkiana, an indigenous fruit tree in sub-Saharan Africa: A comprehensive review. Cogent Food Agric. 00:1766735. doi: 10.1080/23311932.2020.1766735.
- Chen, F.X., X.H. Liu, and L.S. Chen. 2009. Developmental changes in pulp organic acid concentration and activities of acid-metabolising enzymes during the fruit development of two loquat (Eriobotrya japonica Lindl.) cultivars differing in fruit acidity. Food Chem. 114(2):657–664. doi: 10.1016/j.foodchem.2008.10.003.
- Chiveu, J., M. Naumann, K. Kehlenbeck, and E. Pawelzik. 2019. Variation in fruit chemical and mineral composition of Kenyan guava (Psidium guajava L.): Inferences from climatic conditions, and fruit morphological traits. J. Appl. Bot. Food Qual. 92:151–159. doi: 10.5073/JABFQ.2019.092.021.
- Cho, M.J., L.R. Howard, R.L. Prior, and J.R. Clark. 2004. Flavonoid glycosides and antioxidant capacity of various blackberry, blueberry and red grape genotypes determined by high-performance liquid chromatography/mass spectrometry. J. Sci. Food Agric. 84:1771–1782. doi: 10.1002/jsfa.1885.
- Crisosto, C.H., and G. Crisosto. 2001. Understanding consumer acceptance of early harvested ‘Hayward’ kiwifruit. Postharvest Biol. Technol. 22(3):205–213. doi: 10.1016/S0925-5214(01)00097-7.
- De La Hera-Orts, M., A. Martinez-Cutillas, L. Lopez-Roca, and E. Gomez-Plaza. 2005. Effect of moderate irrigation on grape composition during ripening. Spanish. J. Agric. Res. 3:352–361.
- Des Gachons, C.P., C.V. Leeuwen, T. Tominaga, J.P. Soyer, J.P. Gaudillere, and D. Dubourdieu. 2004. Influence of water and nitrogen deficit on fruit ripening and aroma potential of Vitis viniferaL cv Sauvignon blanc in field conditions. J. Sci. Food Agric. 85(1):73–85. doi: 10.1002/jsfa.1919.
- Ding, C.K., Y. Chachin, Y. Hamauzu, Y. Ueda, and Y. Imahori. 1998. Effects of storage temperatures on physiology and quality of loquat fruit. Postharvest Biol. Technol. 14(3):309–315. doi: 10.1016/S0925-5214(98)00053-2.
- Fardet, A., E. Rock, and C. Re. 2008. Is the in vitro antioxidant potential of whole-grain cereals and cereal products well reflected in vivo? J. Cereal Sci. 48:258–276. doi: 10.1016/j.jcs.2008.01.002.
- Gull, J., B. Sultana, F. Anwar, R. Naseer, M. Ashraf, and M. Ashrafuzzaman. 2012. Variation in antioxidant attributes at three ripening stages of guava (Psidium guajava L.) fruit from different geographical regions of Pakistan. Molecules 17(3):3165–3180. doi: 10.3390/molecules17033165.
- Haque, M.N., B.K. Saha, M.R. Karim, and M.N.H. Bhuiyan. 2009. Evaluation of nutritional and physico-chemical properties of several selected fruits in Bangladesh. Bangladesh J. Sci. Ind. Res. 44(3):353–358. doi: 10.3329/bjsir.v44i3.4410.
- Harker, F., K. Marsh, H. Young, S. Murray, F. Gunson, and S. Walker. 2002. Sensory interpretation of instrumental measurements 2: Sweet and acid taste of apple fruit. Postharvest Biol. Technol. 24(3):241–250. doi: 10.1016/S0925-5214(01)00157-0.
- Hina, M., V.S. Sandeep, and P. Renu. 2018. Phosphorus nutrition: Plant growth in response to deficiency and excess. In Plant Nutrients and Abiotic Stress Tolerance (pp. 171-190). Springer, Singapore. doi:10.1007/978-981-10-9044-8_7
- Kalt, W., A. Howell, J.C. Duy, C.F. Forney, and J.E. McDonald. 2001. Horticultural factors affecting antioxidant capacity of blueberries and other small fruits. Hortic. Technol. 11:523–528. doi: 10.21273/HORTTECH.11.4.523.
- Kuda, T., M. Tsunekawa, H. Goto, and Y. Araki. 2005. Antioxidant properties of four edible algae harvested in the Noto Peninsula, Japan. J. Food Compos. Anal. 18(7):625–633. doi: 10.1016/j.jfca.2004.06.015.
- Magaia, T., A. Uamusse, I. Sjöholm, and K. Skog. 2013. Proximate analysis of five wild fruits of Mozambique. Sci. World J. 1–6. doi: 10.1155/2013/601435.
- Maji, A.T., and A.A. Shaibu. 2012. Application of principal component analysis for rice germplasm characterization and evaluation. J. Plant Breed. Crop Sci. 4(6):87–97. doi: 10.5897/JPBCS11.093.
- Mapunda, E.P., and C. Mligo. 2019. Nutritional content and antioxidant properties of edible indigenous wild fruits from miombo woodlands in Tanzania. Int. J. Biol. Chem. Sci. 13(2):849–860.
- Maroyi, A. 2013. Traditional use of medicinal plants in south-central Zimbabwe: Review and perspectives. J Ethnobiol Ethnomed 9–31:1–18.
- Mehmood, A., M.J. Jaskani, I.A. Khan, S. Ahmad, R. Ahmad, S. Luo, and N.M. Ahmad. 2014. Genetic diversity of Pakistani guava (Psidium guajava L.) germplasm and its implications for conservation and breeding. Sci. Hortic. 172:221–232. doi: 10.1016/j.scienta.2014.04.005.
- Mithofer, D., and H. Waibel. 2003. Income and labour productivity of collection and use of indigenous fruit tree products in Zimbabwe. Agrofor. Syst. 59:295–305. doi: 10.1023/B:AGFO.0000005230.09714.b4.
- Moombe, K.B., H. Cori, J.S. Clarke, S. Franzel, and P. Ackerman. 2014. Consumer preferences for Uapaca kirkiana fruits in Zambia. For. Trees Livelihoods 23(4):248–260. doi: 10.1080/14728028.2014.929981.
- Mpofu, A., A.R. Linnemann, M.J.R. Nout, M.H. Zwietering, and E.J. Smid. 2014. Mutandabota, a food product from Zimbabwe: Processing, composition, and socioeconomic aspects. Ecol Food Nutr 53(1):24–41. doi: 10.1080/03670244.2013.767802.
- Muchuweti, M., A.R. Ndhlala, and A. Kasiamhuru. 2006. Analysis of phenolic compounds including tannins, gallotannins and flavanols of Uapaca kirkiana fruit. Food Chem. 94(3):415–419. doi: 10.1016/j.foodchem.2004.11.030.
- Ndabikunze, B.K., B.N. Masambu, and B.M. Tiisekwa. 2010. Vitamin C and mineral contents, acceptability and shelf life of juice prepared from four indigenous fruits of the Miombo woodlands of Tanzania. J. Food Agric. Environ. 8:91–96.
- Nhukarume, L., Z. Chikwambi, M. Muchuweti, and B. Chipurura. 2010. Phenolic content and antioxidant capacities of Parinari curatelifolia, Strychnos spinosa and Adansonia digitata. J. Food Biochem. 34(1):207–221. doi: 10.1111/j.1745-4514.2009.00325.x.
- Nyanga, L.K., T.H. Gadaga, M.J.R. Nout, E.J. Smid, T. Boekhout, and M.H. Zwietering. 2013. Nutritive value of masau (Ziziphus mauritiana) fruits from Zambezi Valley in Zimbabwe. Food Chem. 138(1):168–172. doi: 10.1016/j.foodchem.2012.10.016.
- Razaq, M., P. Zhang, H. Shen, and Salahuddin. 2017. Influence of nitrogen and phosphorus on the growth and root morphology of Acer mono. PLoS ONE. 12:1–13. doi: 10.1371/journal.pone.0171321.
- Rodriguez-Amaya, D.B., M. Kimura, H.T. Godoy, and J. Amaya-Farfan. 2008. Updated Brazilian database on food carotenoids: Factors affecting carotenoid composition. J. Agric. Food Chem. 21(6):445–463. doi: 10.1016/j.jfca.2008.04.001.
- Saka, J.K., R. Swai, A. Mkonda, A. Schomburg, F. Kwesiga, and F.K. Akinnifesi. 2004. Processing and utilisation of indigenous fruits of the miombo in Southern Africa. In proceedings of the Agroforestry impacts on Livelihoods in Southern Africa: Putting Research into Practice conference. Aventura Resorts Warmbaths, South Africa: World Agroforestry Centre publication.
- Seymour, G.B., J. Taylor, and G.A. Tucker. 1993. Biochemistry of fruit ripening. Chapman & Hall, London.
- Shen, J., L. Yuan, J. Zhang, H. Li, Z. Bai, X. Chen, W. Zhang, and F. Zhang. 2011. Phosphorus dynamics: From soil to plant. Plant Physiol. 156(3):997–1005. doi: 10.1104/pp.111.175232.
- Silva, M.L.C., R.S. Costa, A.S. Santana, and M.B.G. Koblitz. 2010. Compostos fenólicos, carotenoides e atividade antioxidante em produtos vegetais. Semina 31:669–681.
- Singh, D., M. Gill, R. Boora, and N. Arora. 2015. Genetic diversity analysis in guava (Psidium guajava) on the basis of morphological and physicochemical traits. Indian J. Agric. Sci. 85:678–683.
- Stadlmayr, B., U.R. Charrondiere, S. Eisenwagen, R. Jamnadassand, and K. Kehlenbeck. 2013. Nutrient composition of selected indigenous fruits from sub-Saharan Africa. J. Sci. Food Agric. 93(11):2627–2636. doi: 10.1002/jsfa.6196.
- Thakur, A., and Z. Singh. 2012. Responses of ‘Spring Bright’ and ‘Summer Bright’ nectarines to deficit irrigation: Fruit growth and concentration of sugars and organic acids. Sci. Hortic. 135(24):112–119. doi: 10.1016/j.scienta.2011.12.013.
- Toker, R., M. Gölükcü, H. Tokgöz, and S. Tepe. 2013. Organic acids and sugar compositions of some loquat cultivars (Eriobotrya japonica L.) grown in Turkey. Tarim Bilimleri Dergisi 19:121–128.
- Toledo, Á., and B. Burlingame. 2006a. Biodiversity and nutrition: A common path toward global food security and sustainable development. J. Food Compos. Anal. 19(6):477–483. doi: 10.1016/j.jfca.2006.05.001.
- Tsantili, E., Y. Shin, J.F. Nock, and B. Watkins. 2010. Antioxidant concentrations during chilling injury development in peaches. Postharvest Biol. Technol. 57:27–34. doi: 10.1016/j.postharvbio.2010.02.002.
- Vinceti, B., A. Ickowitz, B. Powell, K. Kehlenbeck, C. Termote, B. Cogill, and D. Hunter. 2013. The contributions of forest foods to sustainable diets. Unasylvia 64:54–64.
- Wall, M.M. 2006. Ascorbic acid, vitamin A, and mineral composition of banana (Musa sp.) and papaya (Carica papaya) cultivars grown in Hawaii. J. Food Compos. Anal. 19(5):434–445. doi: 10.1016/j.jfca.2006.01.002.
- Walton, E.F., and T.M. De Jong. 1990. Growth and compositional changes in kiwi fruit berries from three Californian locations. Ann. Bot. 66(3):285–298. doi: 10.1093/oxfordjournals.aob.a088027.
- Wang, C.Y., C.T. Chen, and S.Y. Wang. 2009b. Changes of flavonoid content and antioxidant capacity in blueberries after illumination with UV-C. Food Chem. 117(3):426–431. doi: 10.1016/j.foodchem.2009.04.037.
- Welch, R.M., W.A. Norvell, S.C. Schaefe, J.E. Shaff, and L.V. Kochian. 1993. Induction of iron (III) and copper (II) reduction in pea (Pisum sativum L.) roots by Fe and Cu status: Does the root-cell plasmalemma Fe (III)-chelate reductase perform a general role in regulating cation uptake? Planta. 190:555–561. doi: 10.1007/BF00224795.
- Wolfe, K.L., X. Kang, X. He, M. Dong, Q. Zhang, and R.H. Liu. 2008. Celular antioxidant activity of common fruits. J. Agric. Food Chem. 56:8418–8426. doi: 10.1021/jf801381y.
- Zadernowski, R., M. Naczk, and J. Nesterowicz. 2005. Phenolic acid profiles in some small berries. J. Agric. Food Chem. 53:2118–2124. doi: 10.1021/jf040411p.